
|
|||||
|
 | |
| |
| |
| |
| |
| |
|
Gene: HDAC2 |
Gene summary for HDAC2 |
| Gene information | Species | Human | Gene symbol | HDAC2 | Gene ID | 3066 |
| Gene name | histone deacetylase 2 | |
| Gene Alias | HD2 | |
| Cytomap | 6q21 | |
| Gene Type | protein-coding | GO ID | GO:0000003 | UniProtAcc | Q92769 |
Top |
Malignant transformation analysis |
| Identification of the aberrant gene expression in precancerous and cancerous lesions by comparing the gene expression of stem-like cells in diseased tissues with normal stem cells |
| Entrez ID | Symbol | Replicates | Species | Organ | Tissue | Adj P-value | Log2FC | Malignancy |
| 3066 | HDAC2 | LZE3D | Human | Esophagus | HGIN | 9.45e-03 | 2.81e-01 | 0.0668 |
| 3066 | HDAC2 | LZE4T | Human | Esophagus | ESCC | 1.17e-24 | 9.03e-01 | 0.0811 |
| 3066 | HDAC2 | LZE7T | Human | Esophagus | ESCC | 1.38e-12 | 1.34e+00 | 0.0667 |
| 3066 | HDAC2 | LZE8T | Human | Esophagus | ESCC | 1.11e-09 | 4.33e-01 | 0.067 |
| 3066 | HDAC2 | LZE20T | Human | Esophagus | ESCC | 4.81e-05 | 1.95e-01 | 0.0662 |
| 3066 | HDAC2 | LZE22T | Human | Esophagus | ESCC | 2.27e-02 | 6.43e-01 | 0.068 |
| 3066 | HDAC2 | LZE24T | Human | Esophagus | ESCC | 5.78e-26 | 9.91e-01 | 0.0596 |
| 3066 | HDAC2 | LZE21T | Human | Esophagus | ESCC | 9.52e-05 | 6.39e-01 | 0.0655 |
| 3066 | HDAC2 | LZE6T | Human | Esophagus | ESCC | 9.50e-11 | 8.43e-01 | 0.0845 |
| 3066 | HDAC2 | P1T-E | Human | Esophagus | ESCC | 1.16e-06 | 6.96e-01 | 0.0875 |
| 3066 | HDAC2 | P2T-E | Human | Esophagus | ESCC | 9.90e-69 | 1.35e+00 | 0.1177 |
| 3066 | HDAC2 | P4T-E | Human | Esophagus | ESCC | 2.29e-61 | 1.57e+00 | 0.1323 |
| 3066 | HDAC2 | P5T-E | Human | Esophagus | ESCC | 2.44e-26 | 9.01e-01 | 0.1327 |
| 3066 | HDAC2 | P8T-E | Human | Esophagus | ESCC | 1.60e-41 | 8.63e-01 | 0.0889 |
| 3066 | HDAC2 | P9T-E | Human | Esophagus | ESCC | 8.03e-15 | 5.17e-01 | 0.1131 |
| 3066 | HDAC2 | P10T-E | Human | Esophagus | ESCC | 1.05e-73 | 1.38e+00 | 0.116 |
| 3066 | HDAC2 | P11T-E | Human | Esophagus | ESCC | 1.37e-09 | 7.30e-01 | 0.1426 |
| 3066 | HDAC2 | P12T-E | Human | Esophagus | ESCC | 1.44e-67 | 1.50e+00 | 0.1122 |
| 3066 | HDAC2 | P15T-E | Human | Esophagus | ESCC | 7.08e-52 | 1.27e+00 | 0.1149 |
| 3066 | HDAC2 | P16T-E | Human | Esophagus | ESCC | 3.43e-80 | 1.68e+00 | 0.1153 |
| Page: 1 2 3 4 5 6 7 8 9 |
| Tissue | Expression Dynamics | Abbreviation |
| Breast |  | IDC: Invasive ductal carcinoma |
| DCIS: Ductal carcinoma in situ | ||
| Precancer(BRCA1-mut): Precancerous lesion from BRCA1 mutation carriers | ||
| Endometrium |  | AEH: Atypical endometrial hyperplasia |
| EEC: Endometrioid Cancer | ||
| Esophagus | 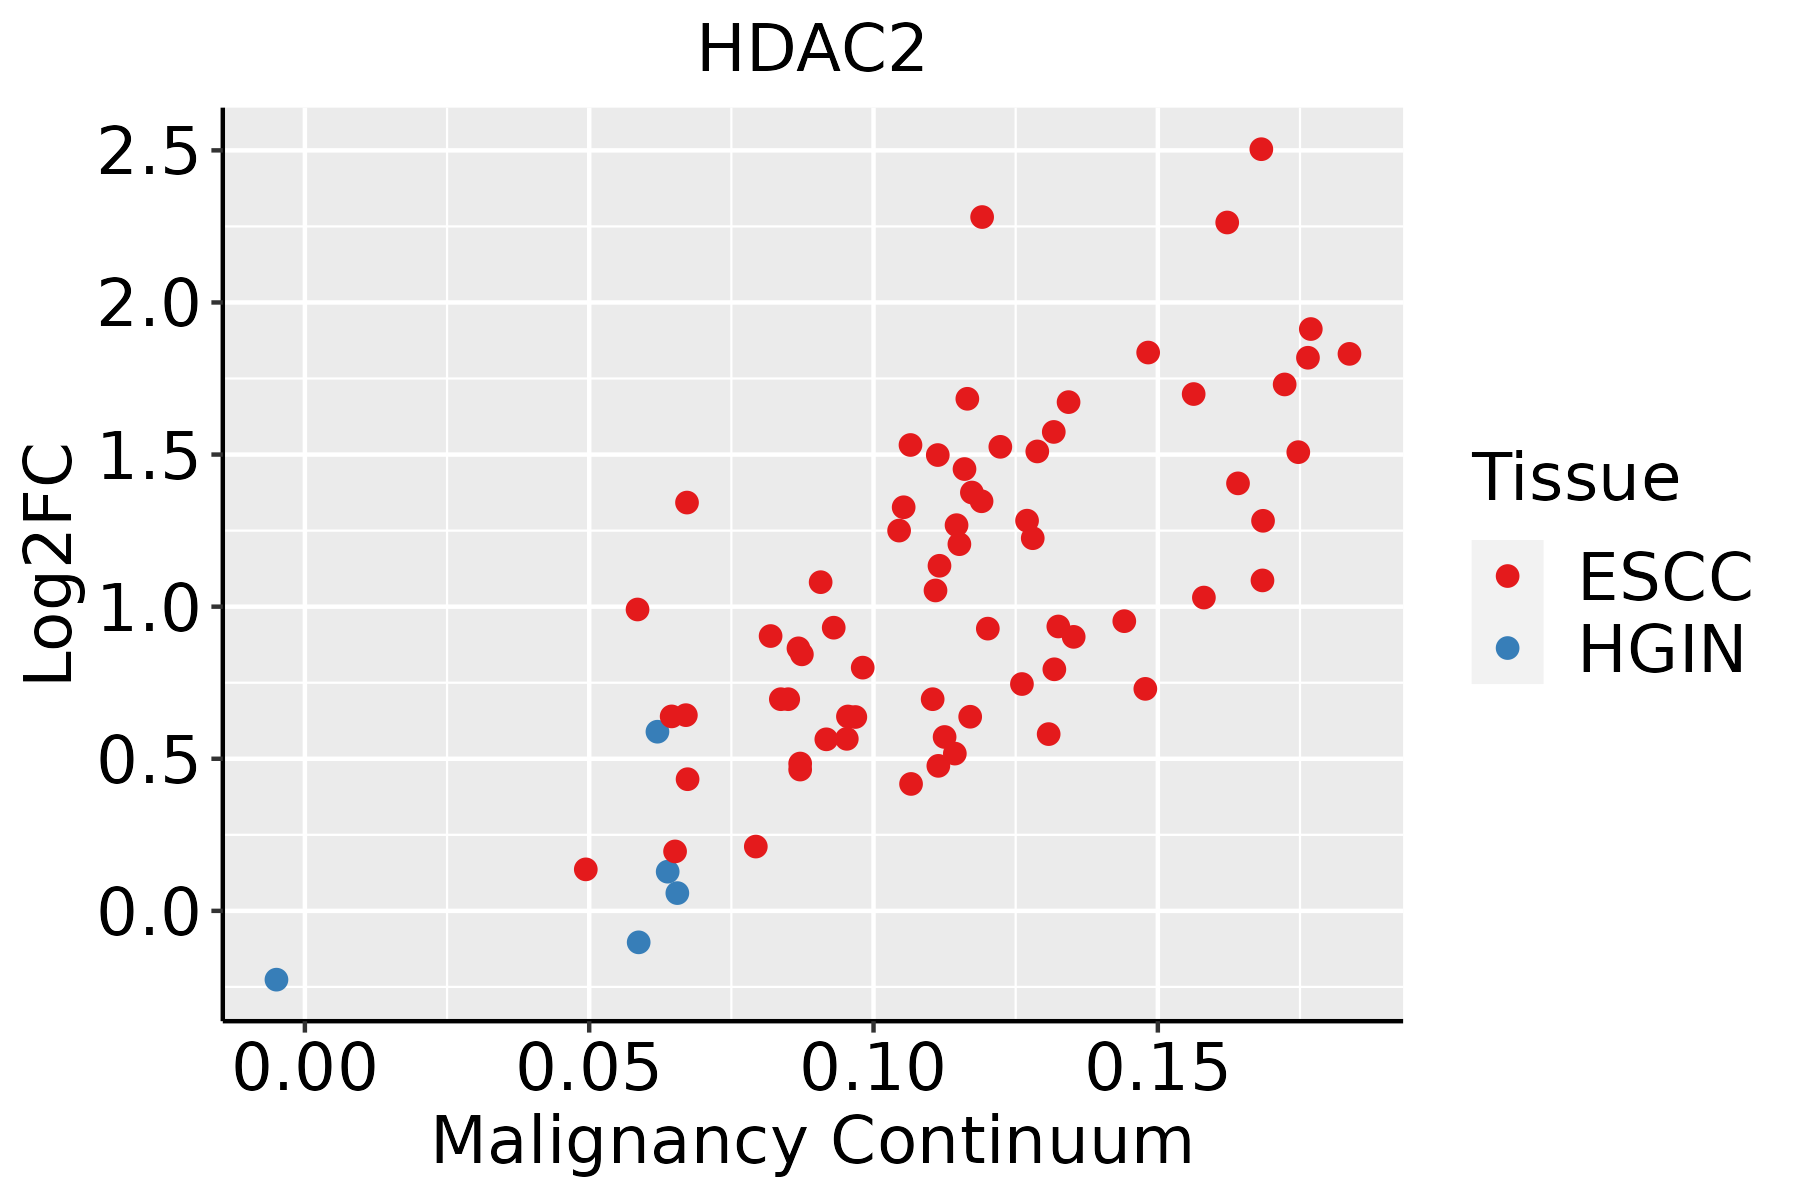 | ESCC: Esophageal squamous cell carcinoma |
| HGIN: High-grade intraepithelial neoplasias | ||
| LGIN: Low-grade intraepithelial neoplasias | ||
| Liver | 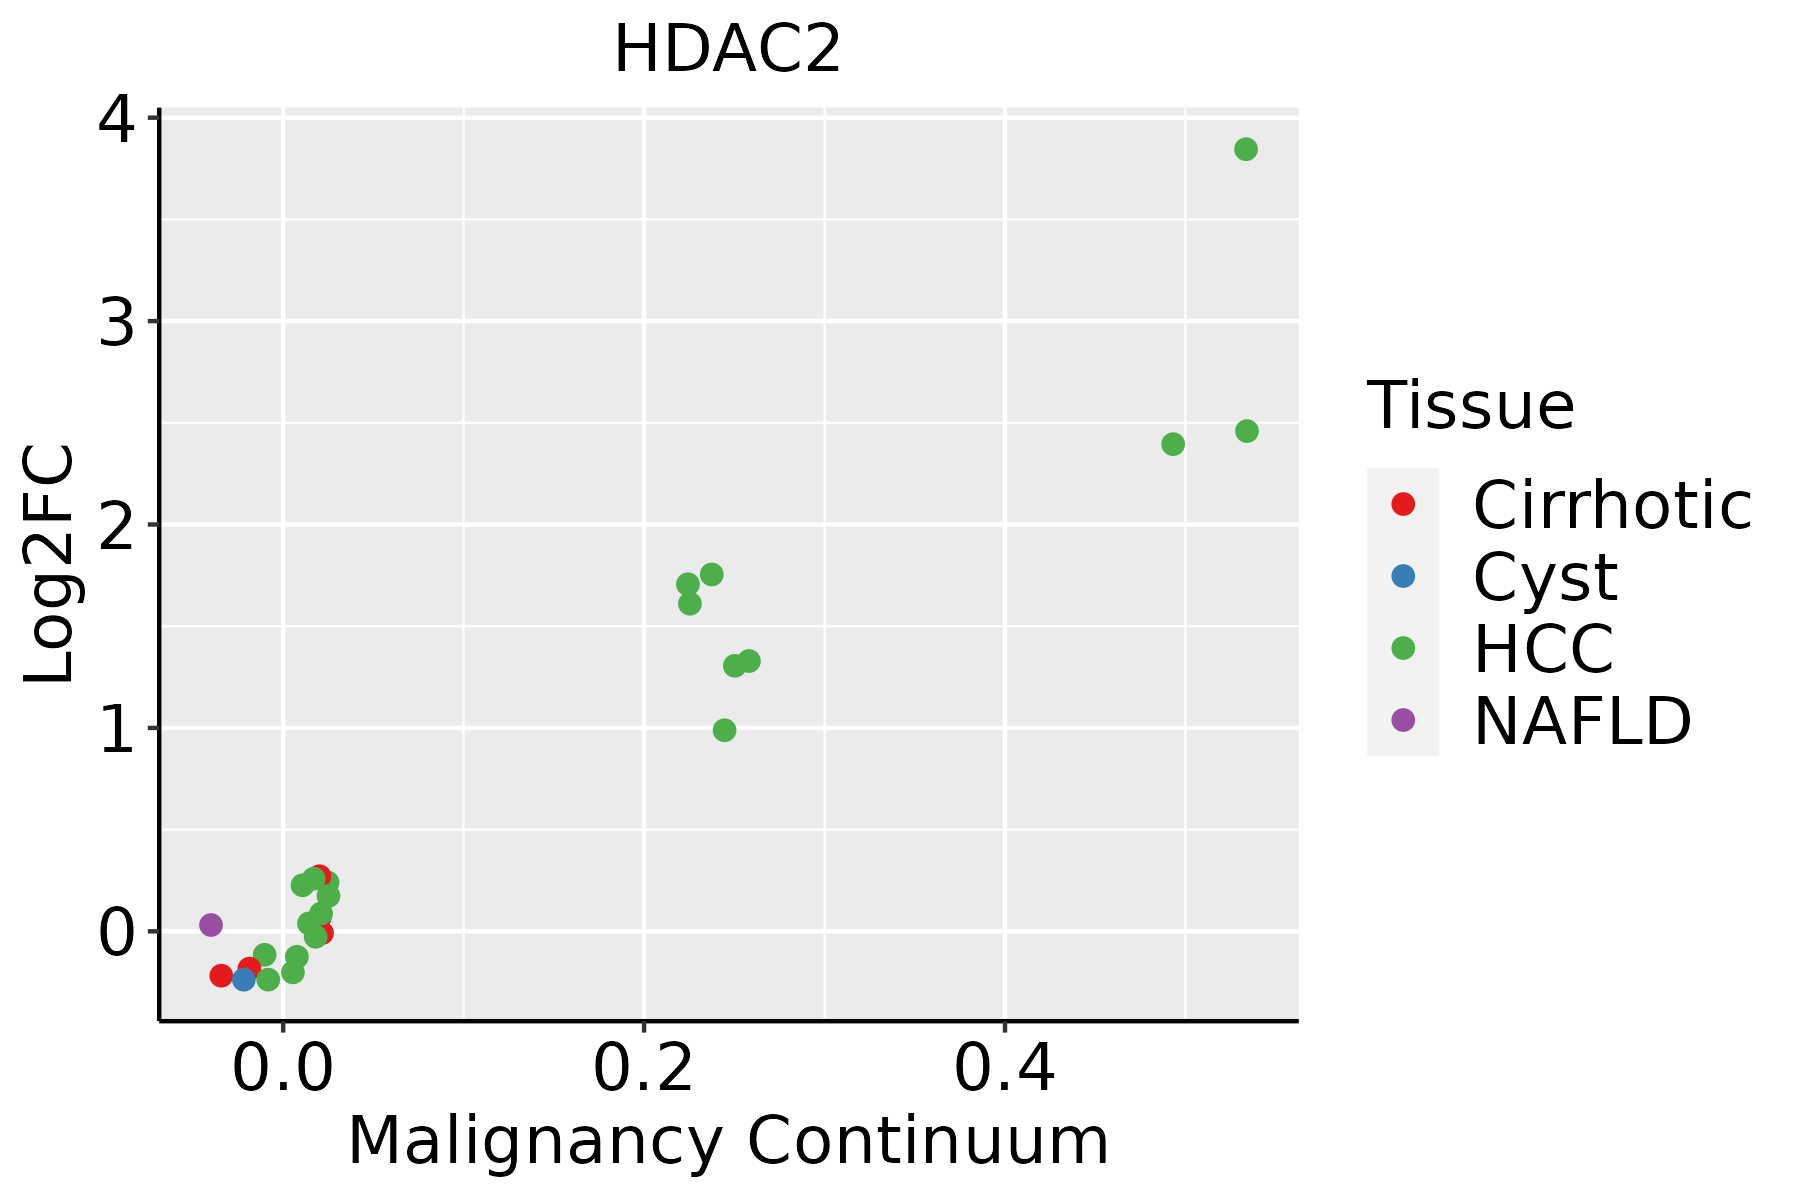 | HCC: Hepatocellular carcinoma |
| NAFLD: Non-alcoholic fatty liver disease | ||
| Oral Cavity | 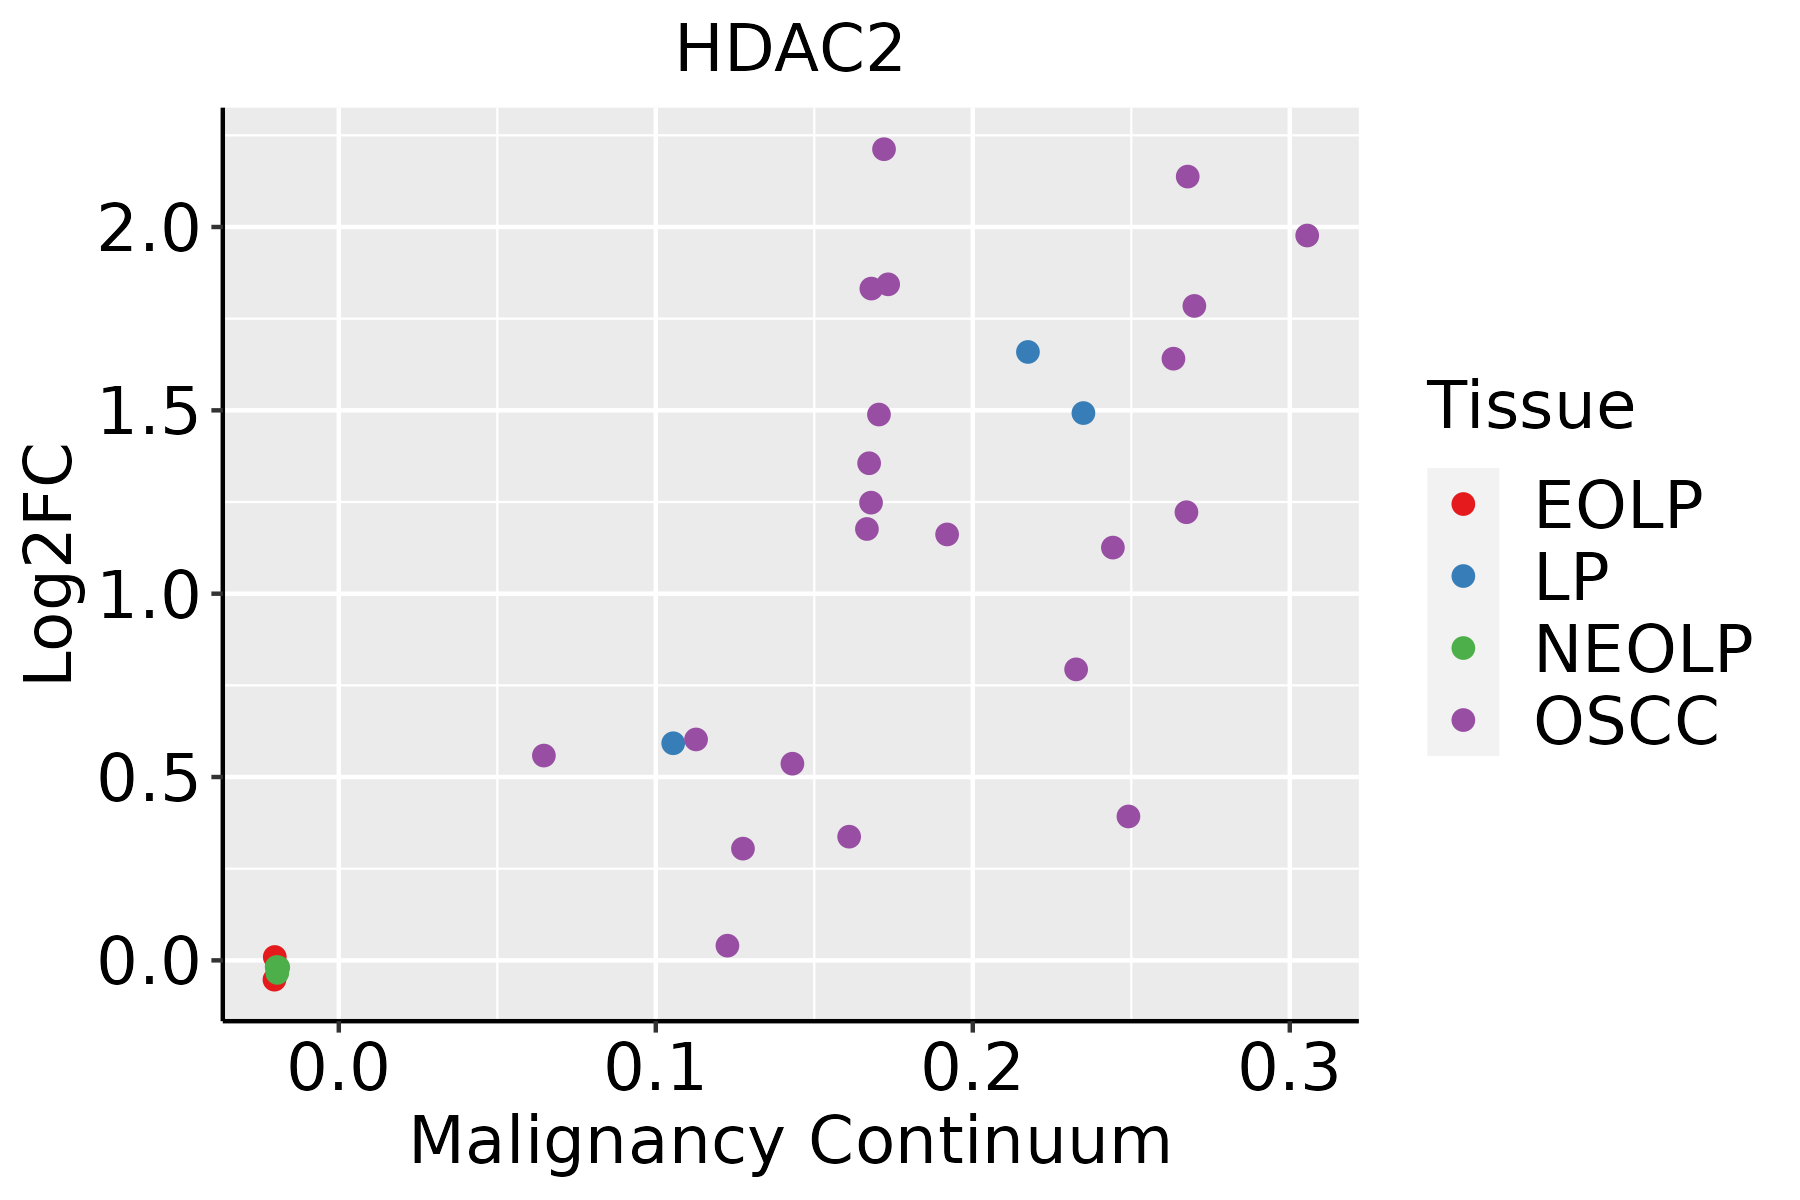 | EOLP: Erosive Oral lichen planus |
| LP: leukoplakia | ||
| NEOLP: Non-erosive oral lichen planus | ||
| OSCC: Oral squamous cell carcinoma | ||
| Prostate | 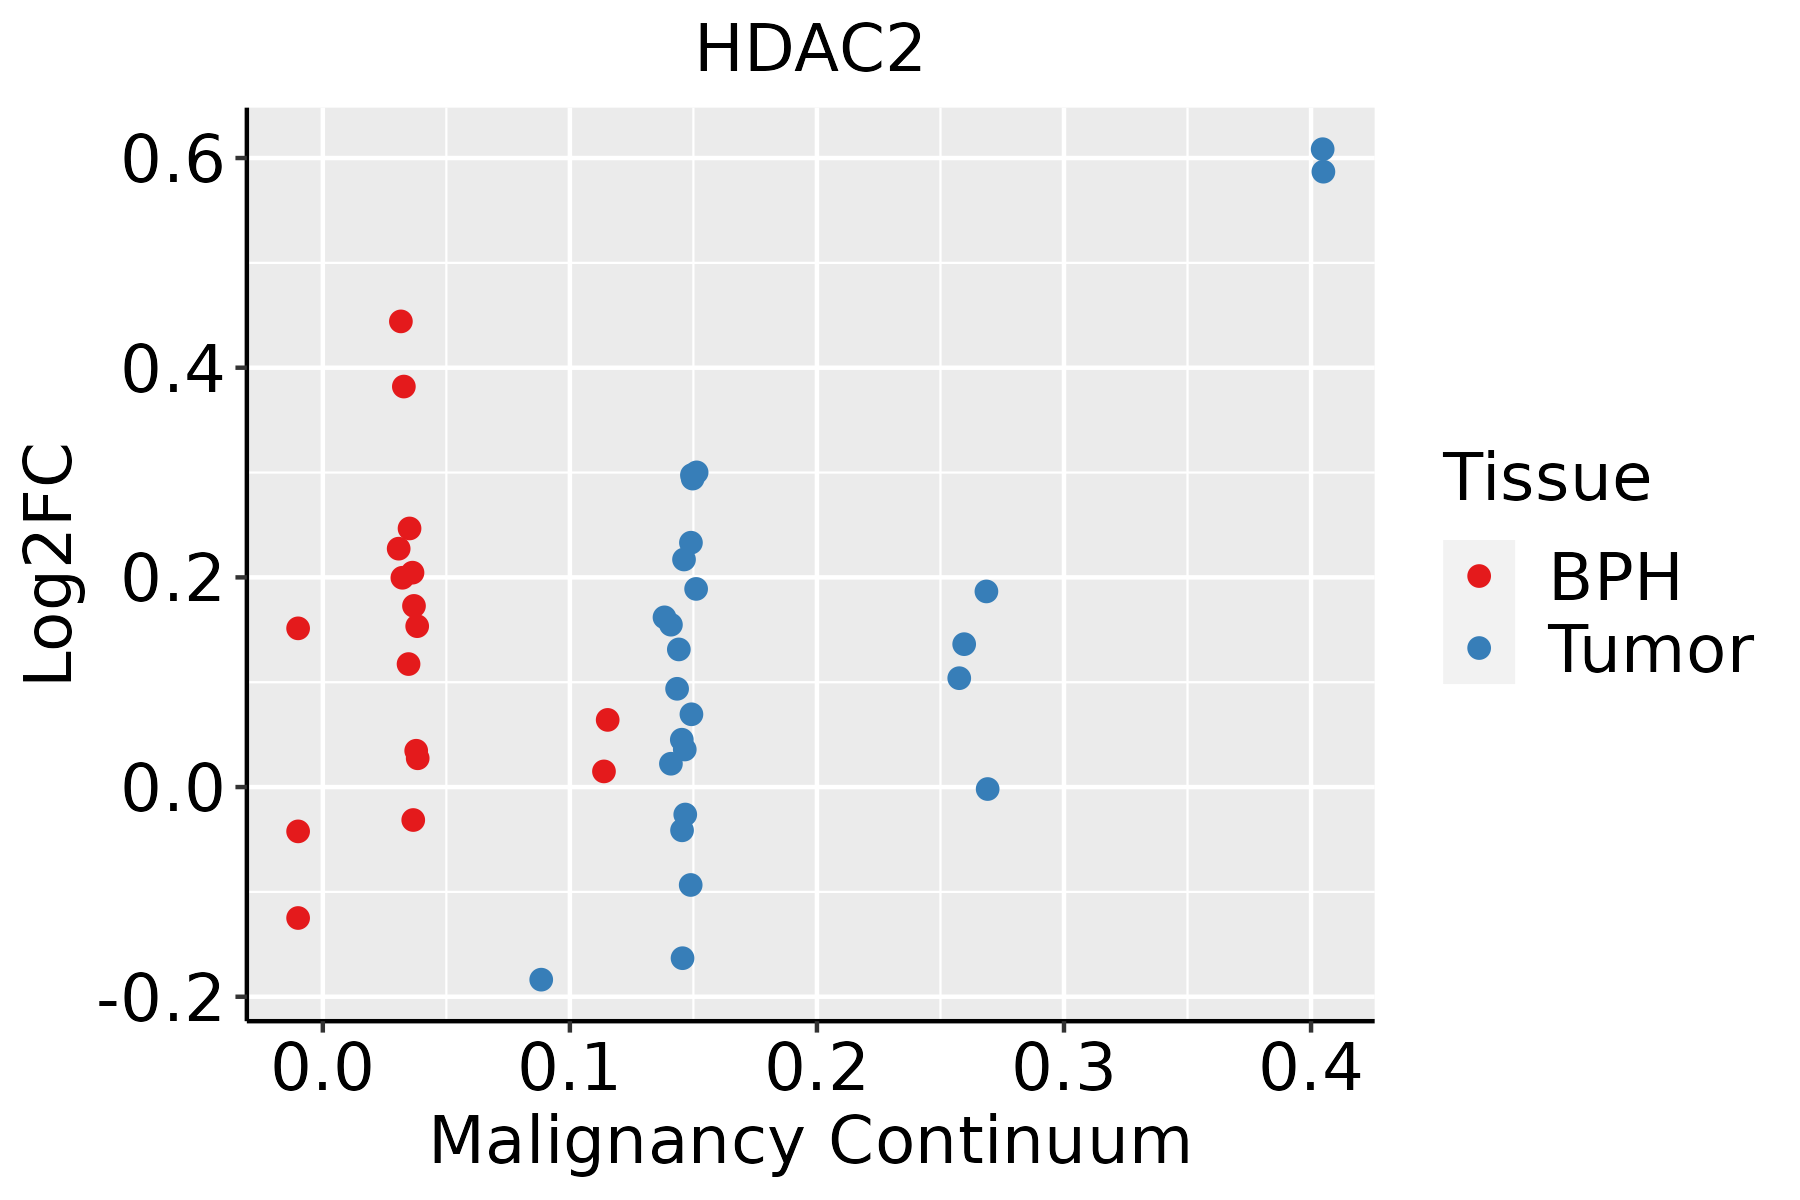 | BPH: Benign Prostatic Hyperplasia |
| Skin | 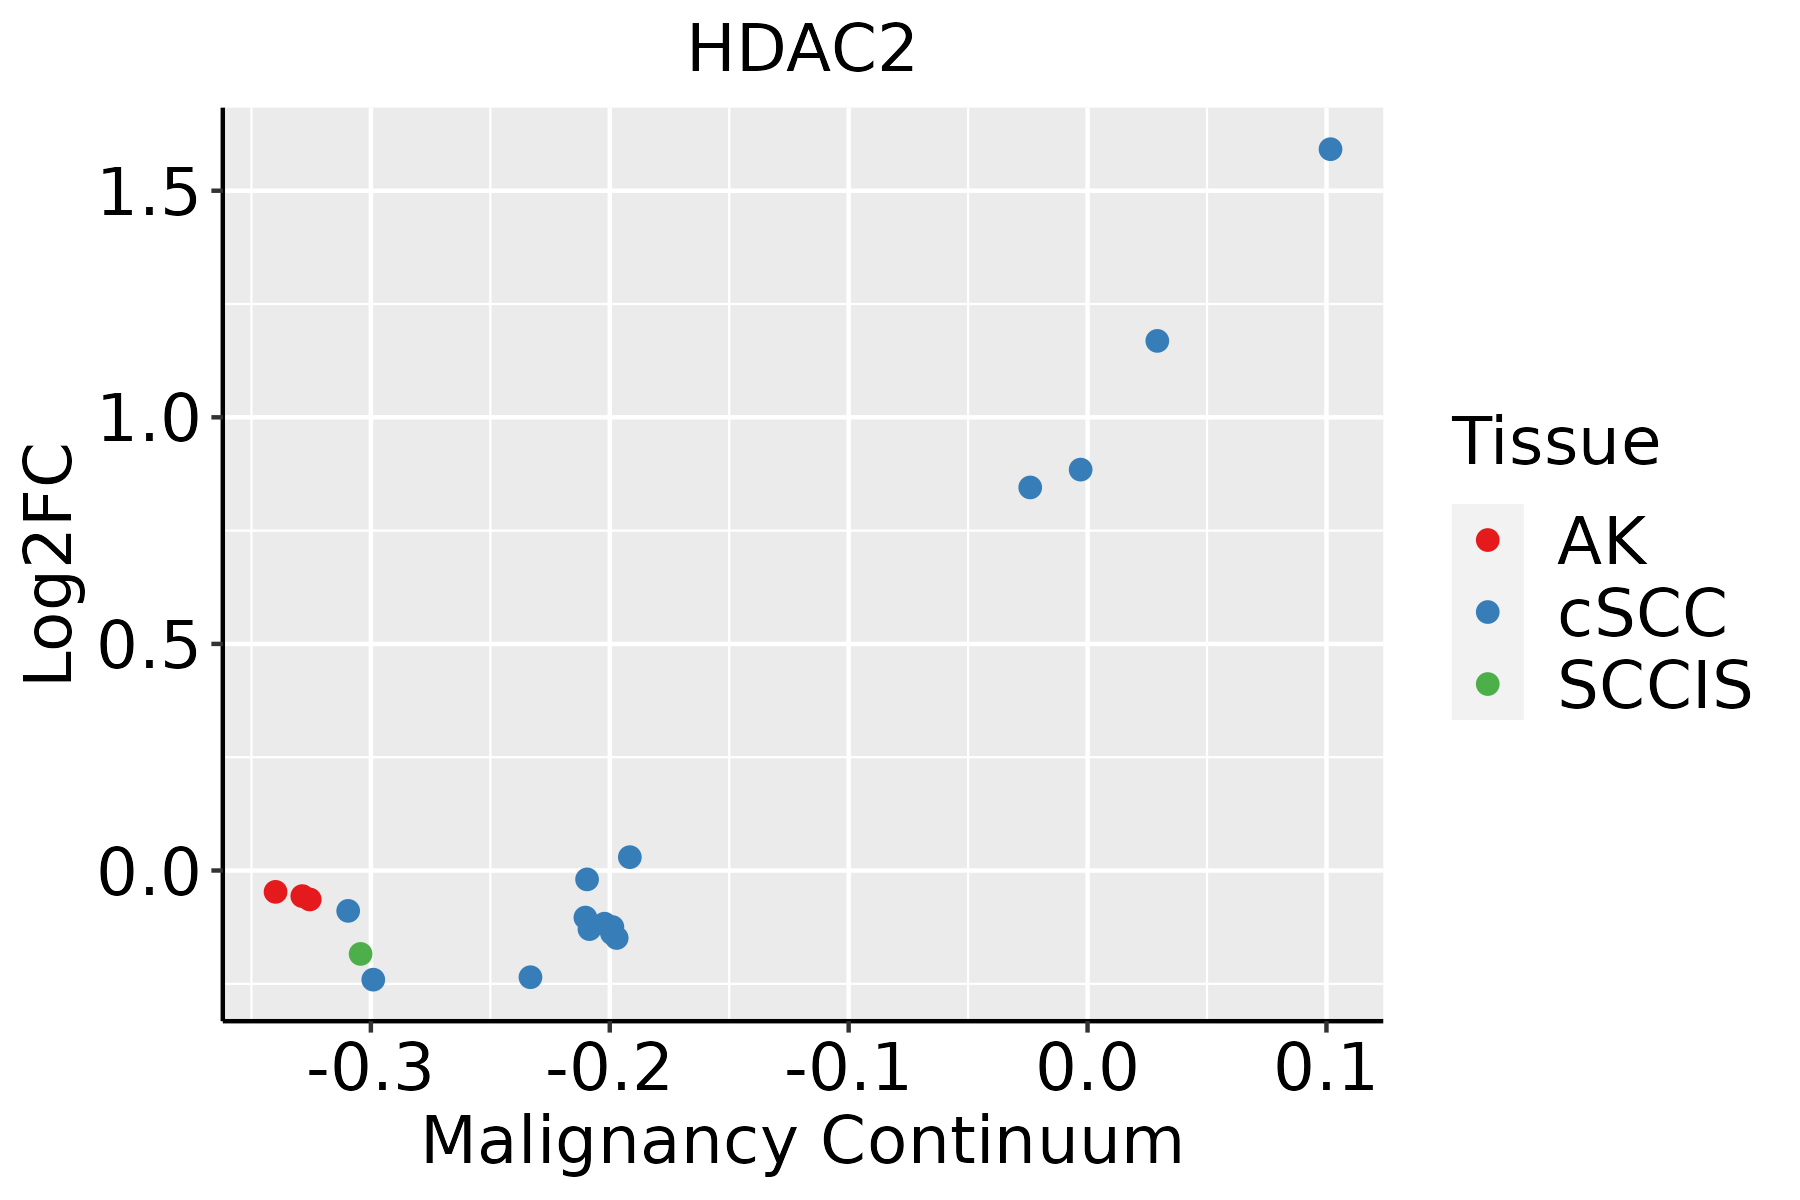 | AK: Actinic keratosis |
| cSCC: Cutaneous squamous cell carcinoma | ||
| SCCIS:squamous cell carcinoma in situ | ||
| Thyroid | 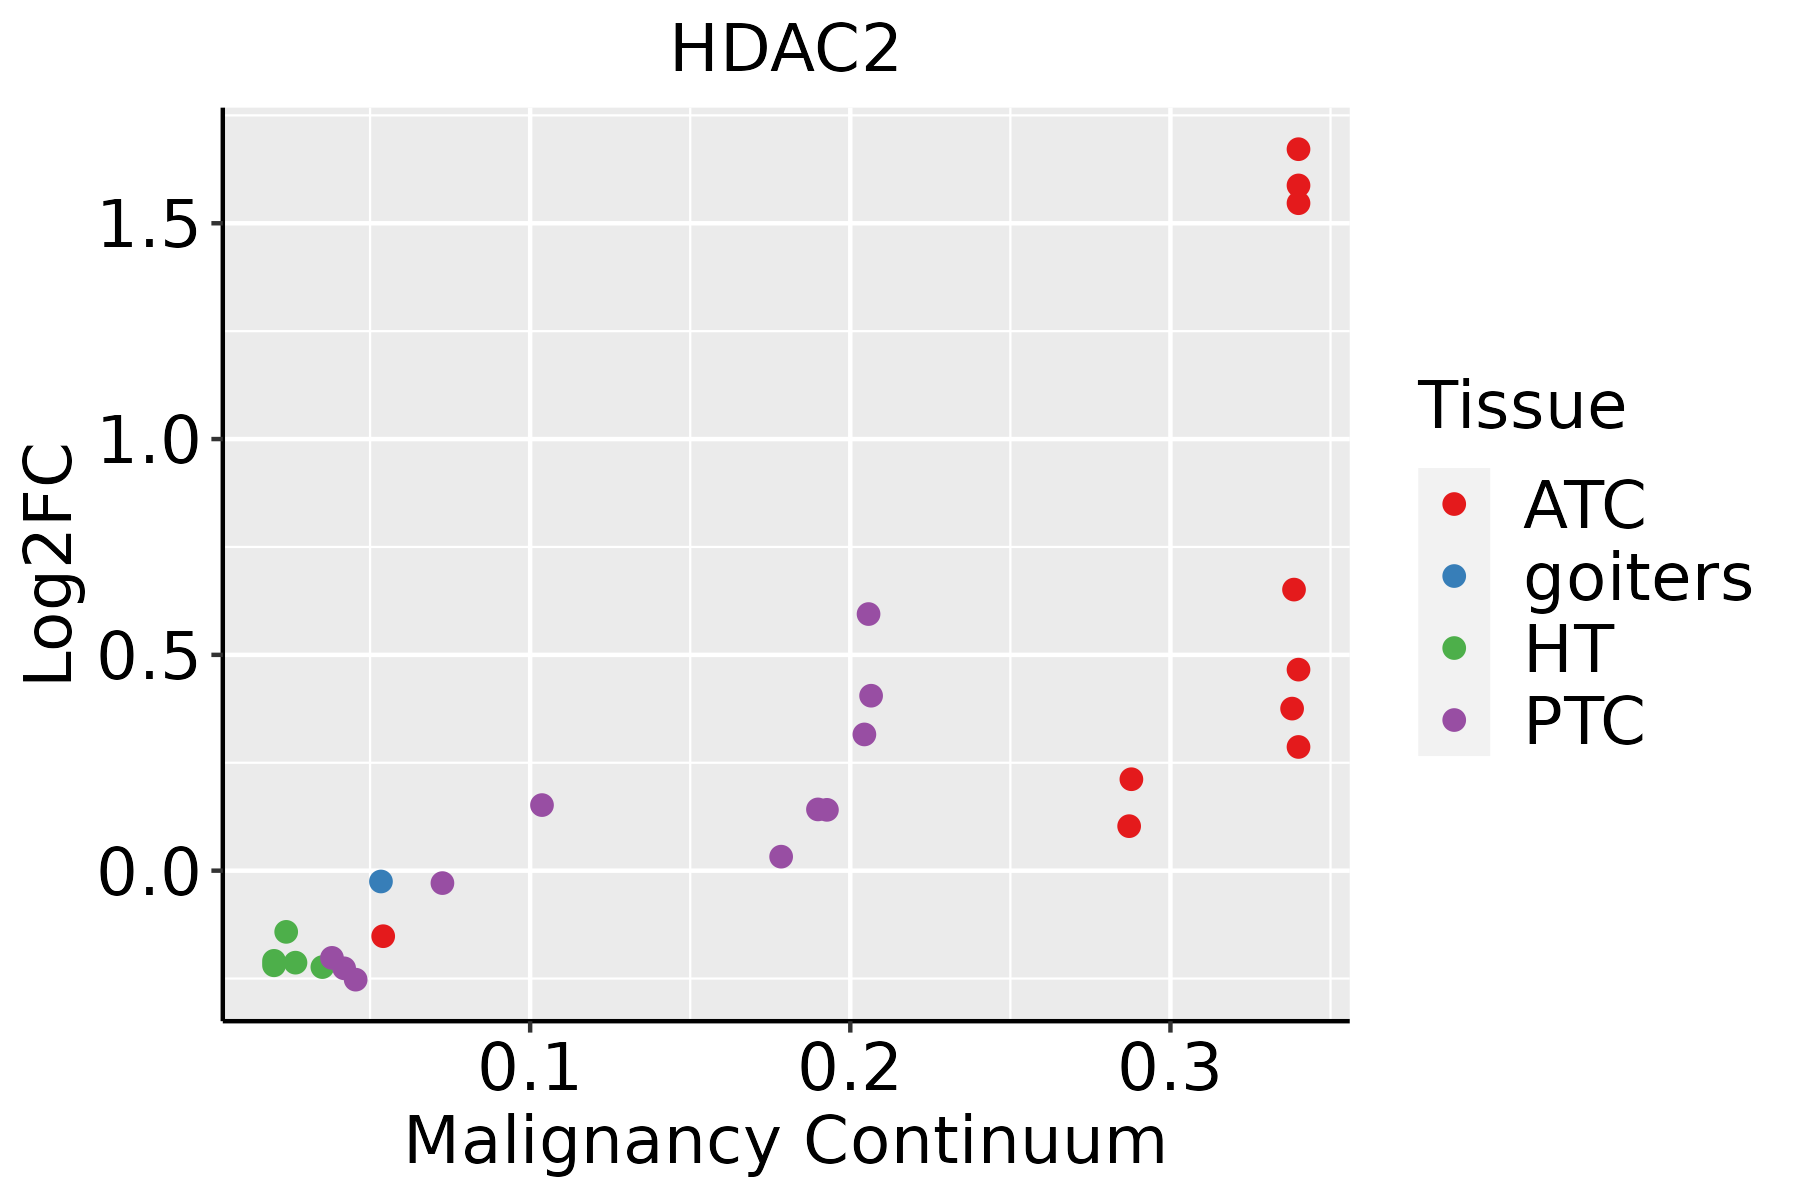 | ATC: Anaplastic thyroid cancer |
| HT: Hashimoto's thyroiditis | ||
| PTC: Papillary thyroid cancer |
| ∗log2FC in expression of this searched gene in stem-like cells from each diseased tissue sample relative to stem-like cells in normal samples in each tissue plotted against the malignancy continuum. Samples are colored based on if they are from different disease stage. |
Top |
Malignant transformation related pathway analysis |
| Find out the enriched GO biological processes and KEGG pathways involved in transition from healthy to precancer to cancer |
| Tissue | Disease Stage | Enriched GO biological Processes |
| Colorectum | AD |  |
| Colorectum | SER |  |
| Colorectum | MSS |  |
| Colorectum | MSI-H |  |
| Colorectum | FAP |  |
| ∗Top 15 enriched GO BP terms are showed in the bar plot of each disease state in each tissue. Each row represents a significant GO biological process which is colored according to the -log10(p.adjust). |
| Page: 1 2 3 4 5 6 7 8 9 |
| GO ID | Tissue | Disease Stage | Description | Gene Ratio | Bg Ratio | pvalue | p.adjust | Count |
| GO:00069799 | Breast | Precancer | response to oxidative stress | 70/1080 | 446/18723 | 1.59e-14 | 4.26e-12 | 70 |
| GO:00704829 | Breast | Precancer | response to oxygen levels | 55/1080 | 347/18723 | 7.47e-12 | 1.11e-09 | 55 |
| GO:00621979 | Breast | Precancer | cellular response to chemical stress | 51/1080 | 337/18723 | 2.40e-10 | 2.34e-08 | 51 |
| GO:00003029 | Breast | Precancer | response to reactive oxygen species | 38/1080 | 222/18723 | 1.47e-09 | 1.23e-07 | 38 |
| GO:00458629 | Breast | Precancer | positive regulation of proteolysis | 51/1080 | 372/18723 | 7.77e-09 | 5.70e-07 | 51 |
| GO:00345999 | Breast | Precancer | cellular response to oxidative stress | 42/1080 | 288/18723 | 2.78e-08 | 1.79e-06 | 42 |
| GO:00425429 | Breast | Precancer | response to hydrogen peroxide | 26/1080 | 146/18723 | 2.52e-07 | 1.26e-05 | 26 |
| GO:00511019 | Breast | Precancer | regulation of DNA binding | 22/1080 | 118/18723 | 9.28e-07 | 3.71e-05 | 22 |
| GO:00510989 | Breast | Precancer | regulation of binding | 44/1080 | 363/18723 | 2.59e-06 | 8.65e-05 | 44 |
| GO:00092667 | Breast | Precancer | response to temperature stimulus | 27/1080 | 178/18723 | 3.85e-06 | 1.21e-04 | 27 |
| GO:00018196 | Breast | Precancer | positive regulation of cytokine production | 52/1080 | 467/18723 | 4.18e-06 | 1.29e-04 | 52 |
| GO:00022378 | Breast | Precancer | response to molecule of bacterial origin | 43/1080 | 363/18723 | 6.05e-06 | 1.72e-04 | 43 |
| GO:00346059 | Breast | Precancer | cellular response to heat | 15/1080 | 69/18723 | 7.08e-06 | 1.95e-04 | 15 |
| GO:00324968 | Breast | Precancer | response to lipopolysaccharide | 41/1080 | 343/18723 | 7.94e-06 | 2.17e-04 | 41 |
| GO:00346149 | Breast | Precancer | cellular response to reactive oxygen species | 23/1080 | 155/18723 | 2.82e-05 | 6.31e-04 | 23 |
| GO:00094088 | Breast | Precancer | response to heat | 18/1080 | 110/18723 | 5.57e-05 | 1.15e-03 | 18 |
| GO:00085445 | Breast | Precancer | epidermis development | 35/1080 | 324/18723 | 2.71e-04 | 3.96e-03 | 35 |
| GO:00420633 | Breast | Precancer | gliogenesis | 33/1080 | 301/18723 | 3.06e-04 | 4.40e-03 | 33 |
| GO:00094108 | Breast | Precancer | response to xenobiotic stimulus | 45/1080 | 462/18723 | 4.17e-04 | 5.56e-03 | 45 |
| GO:00100013 | Breast | Precancer | glial cell differentiation | 25/1080 | 225/18723 | 1.29e-03 | 1.37e-02 | 25 |
| Page: 1 2 3 4 5 6 7 8 9 10 11 12 13 14 15 16 17 18 19 20 21 22 23 24 25 26 27 28 29 30 31 32 33 34 35 36 37 38 39 40 41 42 43 44 |
| Pathway ID | Tissue | Disease Stage | Description | Gene Ratio | Bg Ratio | pvalue | p.adjust | qvalue | Count |
| hsa0501616 | Breast | Precancer | Huntington disease | 98/684 | 306/8465 | 2.85e-35 | 2.25e-33 | 1.72e-33 | 98 |
| hsa0516918 | Breast | Precancer | Epstein-Barr virus infection | 35/684 | 202/8465 | 1.15e-05 | 1.26e-04 | 9.64e-05 | 35 |
| hsa05031 | Breast | Precancer | Amphetamine addiction | 14/684 | 69/8465 | 1.05e-03 | 7.35e-03 | 5.63e-03 | 14 |
| hsa052036 | Breast | Precancer | Viral carcinogenesis | 27/684 | 204/8465 | 7.19e-03 | 4.06e-02 | 3.11e-02 | 27 |
| hsa0501617 | Breast | Precancer | Huntington disease | 98/684 | 306/8465 | 2.85e-35 | 2.25e-33 | 1.72e-33 | 98 |
| hsa0516919 | Breast | Precancer | Epstein-Barr virus infection | 35/684 | 202/8465 | 1.15e-05 | 1.26e-04 | 9.64e-05 | 35 |
| hsa050311 | Breast | Precancer | Amphetamine addiction | 14/684 | 69/8465 | 1.05e-03 | 7.35e-03 | 5.63e-03 | 14 |
| hsa0520312 | Breast | Precancer | Viral carcinogenesis | 27/684 | 204/8465 | 7.19e-03 | 4.06e-02 | 3.11e-02 | 27 |
| hsa0501623 | Breast | IDC | Huntington disease | 103/867 | 306/8465 | 5.14e-30 | 4.17e-28 | 3.12e-28 | 103 |
| hsa0516922 | Breast | IDC | Epstein-Barr virus infection | 45/867 | 202/8465 | 3.16e-07 | 6.05e-06 | 4.52e-06 | 45 |
| hsa050312 | Breast | IDC | Amphetamine addiction | 18/867 | 69/8465 | 1.42e-04 | 1.36e-03 | 1.01e-03 | 18 |
| hsa0491916 | Breast | IDC | Thyroid hormone signaling pathway | 23/867 | 121/8465 | 2.45e-03 | 1.69e-02 | 1.27e-02 | 23 |
| hsa0520322 | Breast | IDC | Viral carcinogenesis | 34/867 | 204/8465 | 2.82e-03 | 1.86e-02 | 1.39e-02 | 34 |
| hsa0522010 | Breast | IDC | Chronic myeloid leukemia | 15/867 | 76/8465 | 9.24e-03 | 4.37e-02 | 3.27e-02 | 15 |
| hsa0501633 | Breast | IDC | Huntington disease | 103/867 | 306/8465 | 5.14e-30 | 4.17e-28 | 3.12e-28 | 103 |
| hsa0516932 | Breast | IDC | Epstein-Barr virus infection | 45/867 | 202/8465 | 3.16e-07 | 6.05e-06 | 4.52e-06 | 45 |
| hsa050313 | Breast | IDC | Amphetamine addiction | 18/867 | 69/8465 | 1.42e-04 | 1.36e-03 | 1.01e-03 | 18 |
| hsa0491917 | Breast | IDC | Thyroid hormone signaling pathway | 23/867 | 121/8465 | 2.45e-03 | 1.69e-02 | 1.27e-02 | 23 |
| hsa0520332 | Breast | IDC | Viral carcinogenesis | 34/867 | 204/8465 | 2.82e-03 | 1.86e-02 | 1.39e-02 | 34 |
| hsa0522013 | Breast | IDC | Chronic myeloid leukemia | 15/867 | 76/8465 | 9.24e-03 | 4.37e-02 | 3.27e-02 | 15 |
| Page: 1 2 3 4 5 6 7 8 9 |
Top |
Cell-cell communication analysis |
| Identification of potential cell-cell interactions between two cell types and their ligand-receptor pairs for different disease states |
| Ligand | Receptor | LRpair | Pathway | Tissue | Disease Stage |
| Page: 1 |
Top |
Single-cell gene regulatory network inference analysis |
| Find out the significant the regulons (TFs) and the target genes of each regulon across cell types for different disease states |
| TF | Cell Type | Tissue | Disease Stage | Target Gene | RSS | Regulon Activity |
| HDAC2 | STM | Colorectum | CRC | LINC01594,FMNL3,GRM8, etc. | 3.25e-01 |  |
| HDAC2 | ASC | Colorectum | CRC | LINC01594,FMNL3,GRM8, etc. | 3.29e-01 | |
| HDAC2 | ASC | Colorectum | FAP | LINC01594,FMNL3,GRM8, etc. | 2.90e-01 |  |
| HDAC2 | ASC | Colorectum | SER | ESD,MT-ND3,RPL39, etc. | 1.19e-01 |  |
| HDAC2 | AT2L | Lung | IAC | CD24,DBN1,SPINT2, etc. | 4.95e-01 |  |
| HDAC2 | STM | Prostate | Healthy | PHF10,ITGB1BP1,NSDHL, etc. | 4.66e-01 |  |
| HDAC2 | MESC | Stomach | SIM | RPARP-AS1,SLC38A11,SOX4, etc. | 1.20e-01 |  |
| ∗The dot plots of a searched regulon are shown for all cell subpopulations in each disease state of each tissue based on the regulon specific score inferred using pySCENIC and by calculating the average expression. |
| Page: 1 |
Top |
Somatic mutation of malignant transformation related genes |
| Annotation of somatic variants for genes involved in malignant transformation |
| Hugo Symbol | Variant Class | Variant Classification | dbSNP RS | HGVSc | HGVSp | HGVSp Short | SWISSPROT | BIOTYPE | SIFT | PolyPhen | Tumor Sample Barcode | Tissue | Histology | Sex | Age | Stage | Therapy Types | Drugs | Outcome |
| HDAC2 | SNV | Missense_Mutation | c.502N>T | p.His168Tyr | p.H168Y | Q92769 | protein_coding | deleterious(0.04) | possibly_damaging(0.828) | TCGA-A7-A0DA-01 | Breast | breast invasive carcinoma | Female | <65 | I/II | Chemotherapy | adriamycin | SD | |
| HDAC2 | SNV | Missense_Mutation | c.523N>A | p.Asp175Asn | p.D175N | Q92769 | protein_coding | deleterious(0.03) | probably_damaging(0.915) | TCGA-BH-A0BR-01 | Breast | breast invasive carcinoma | Female | <65 | I/II | Unknown | Unknown | SD | |
| HDAC2 | deletion | Nonsense_Mutation | c.459_463delNNNNN | p.Tyr153Ter | p.Y153* | Q92769 | protein_coding | TCGA-AR-A0TU-01 | Breast | breast invasive carcinoma | Female | <65 | I/II | Unspecific | Doxorubicin | SD | |||
| HDAC2 | SNV | Missense_Mutation | novel | c.691G>A | p.Asp231Asn | p.D231N | Q92769 | protein_coding | deleterious(0) | probably_damaging(0.999) | TCGA-MA-AA3Z-01 | Cervix | cervical & endocervical cancer | Female | <65 | I/II | Unknown | Unknown | SD |
| HDAC2 | deletion | Frame_Shift_Del | novel | c.883_884delNN | p.Pro295IlefsTer13 | p.P295Ifs*13 | Q92769 | protein_coding | TCGA-MA-AA3Y-01 | Cervix | cervical & endocervical cancer | Female | <65 | I/II | Unknown | Unknown | SD | ||
| HDAC2 | SNV | Missense_Mutation | c.875N>G | p.Phe292Cys | p.F292C | Q92769 | protein_coding | deleterious(0) | probably_damaging(0.973) | TCGA-CA-6717-01 | Colorectum | colon adenocarcinoma | Male | <65 | I/II | Chemotherapy | oxaliplatin | CR | |
| HDAC2 | SNV | Missense_Mutation | c.1229N>T | p.Ala410Val | p.A410V | Q92769 | protein_coding | tolerated(0.32) | benign(0.423) | TCGA-F4-6703-01 | Colorectum | colon adenocarcinoma | Male | <65 | I/II | Unknown | Unknown | SD | |
| HDAC2 | SNV | Missense_Mutation | c.230T>C | p.Leu77Pro | p.L77P | Q92769 | protein_coding | deleterious(0) | probably_damaging(1) | TCGA-NH-A50T-01 | Colorectum | colon adenocarcinoma | Female | >=65 | I/II | Unknown | Unknown | SD | |
| HDAC2 | SNV | Missense_Mutation | novel | c.1001N>G | p.Tyr334Cys | p.Y334C | Q92769 | protein_coding | deleterious(0) | possibly_damaging(0.761) | TCGA-EI-6917-01 | Colorectum | rectum adenocarcinoma | Male | <65 | III/IV | Chemotherapy | 5fluorouracil+oxaciplatina+l-folinian | SD |
| HDAC2 | SNV | Missense_Mutation | novel | c.1271N>T | p.Ser424Phe | p.S424F | Q92769 | protein_coding | deleterious(0.01) | probably_damaging(0.997) | TCGA-A5-A0G2-01 | Endometrium | uterine corpus endometrioid carcinoma | Female | <65 | III/IV | Unknown | Unknown | SD |
| Page: 1 2 3 4 5 |
Top |
Related drugs of malignant transformation related genes |
| Identification of chemicals and drugs interact with genes involved in malignant transfromation |
| (DGIdb 4.0) |
| Entrez ID | Symbol | Category | Interaction Types | Drug Claim Name | Drug Name | PMIDs |
| 3066 | HDAC2 | DRUGGABLE GENOME, CLINICALLY ACTIONABLE, ENZYME, TRANSCRIPTION FACTOR | 2-ENE-VALPROATE | CHEMBL117487 | 17566732 | |
| 3066 | HDAC2 | DRUGGABLE GENOME, CLINICALLY ACTIONABLE, ENZYME, TRANSCRIPTION FACTOR | inhibitor | 187051807 | SCRIPTAID | |
| 3066 | HDAC2 | DRUGGABLE GENOME, CLINICALLY ACTIONABLE, ENZYME, TRANSCRIPTION FACTOR | inhibitor | BELINOSTAT | BELINOSTAT | |
| 3066 | HDAC2 | DRUGGABLE GENOME, CLINICALLY ACTIONABLE, ENZYME, TRANSCRIPTION FACTOR | inhibitor | 187051797 | APICIDIN | |
| 3066 | HDAC2 | DRUGGABLE GENOME, CLINICALLY ACTIONABLE, ENZYME, TRANSCRIPTION FACTOR | PAZOPANIB | PAZOPANIB | 28221861 | |
| 3066 | HDAC2 | DRUGGABLE GENOME, CLINICALLY ACTIONABLE, ENZYME, TRANSCRIPTION FACTOR | PRACINOSTAT | PRACINOSTAT | ||
| 3066 | HDAC2 | DRUGGABLE GENOME, CLINICALLY ACTIONABLE, ENZYME, TRANSCRIPTION FACTOR | inhibitor | 187051798 | BELINOSTAT | |
| 3066 | HDAC2 | DRUGGABLE GENOME, CLINICALLY ACTIONABLE, ENZYME, TRANSCRIPTION FACTOR | inhibitor | SODIUM PHENYLBUTYRATE | ||
| 3066 | HDAC2 | DRUGGABLE GENOME, CLINICALLY ACTIONABLE, ENZYME, TRANSCRIPTION FACTOR | VORINOSTAT | VORINOSTAT | 24694055,19344175,19966789,26211462,23622981,22260166,17447750,20491440,21548582,24074025,23672185,19084294 | |
| 3066 | HDAC2 | DRUGGABLE GENOME, CLINICALLY ACTIONABLE, ENZYME, TRANSCRIPTION FACTOR | PANOBINOSTAT | PANOBINOSTAT |
| Page: 1 2 3 4 5 6 7 8 9 10 11 |

Copyright 2023-Present -The University of Texas Health Science Center at Houston |