
|
|||||
|
 | |
| |
| |
| |
| |
| |
|
Gene: GTF3C1 |
Gene summary for GTF3C1 |
| Gene information | Species | Human | Gene symbol | GTF3C1 | Gene ID | 2975 |
| Gene name | general transcription factor IIIC subunit 1 | |
| Gene Alias | TFIIIC | |
| Cytomap | 16p12.1 | |
| Gene Type | protein-coding | GO ID | GO:0006139 | UniProtAcc | Q12789 |
Top |
Malignant transformation analysis |
| Identification of the aberrant gene expression in precancerous and cancerous lesions by comparing the gene expression of stem-like cells in diseased tissues with normal stem cells |
| Entrez ID | Symbol | Replicates | Species | Organ | Tissue | Adj P-value | Log2FC | Malignancy |
| 2975 | GTF3C1 | P47T-E | Human | Esophagus | ESCC | 1.42e-17 | 2.29e-01 | 0.1067 |
| 2975 | GTF3C1 | P48T-E | Human | Esophagus | ESCC | 5.12e-22 | 3.45e-01 | 0.0959 |
| 2975 | GTF3C1 | P49T-E | Human | Esophagus | ESCC | 1.45e-11 | 1.05e+00 | 0.1768 |
| 2975 | GTF3C1 | P52T-E | Human | Esophagus | ESCC | 1.36e-23 | 4.66e-01 | 0.1555 |
| 2975 | GTF3C1 | P54T-E | Human | Esophagus | ESCC | 2.54e-14 | 3.58e-01 | 0.0975 |
| 2975 | GTF3C1 | P56T-E | Human | Esophagus | ESCC | 2.94e-11 | 6.61e-01 | 0.1613 |
| 2975 | GTF3C1 | P57T-E | Human | Esophagus | ESCC | 1.12e-15 | 3.99e-01 | 0.0926 |
| 2975 | GTF3C1 | P61T-E | Human | Esophagus | ESCC | 9.69e-18 | 4.09e-01 | 0.099 |
| 2975 | GTF3C1 | P62T-E | Human | Esophagus | ESCC | 5.46e-36 | 7.25e-01 | 0.1302 |
| 2975 | GTF3C1 | P65T-E | Human | Esophagus | ESCC | 8.93e-20 | 2.15e-01 | 0.0978 |
| 2975 | GTF3C1 | P74T-E | Human | Esophagus | ESCC | 5.75e-09 | 3.84e-01 | 0.1479 |
| 2975 | GTF3C1 | P75T-E | Human | Esophagus | ESCC | 6.93e-21 | 3.98e-01 | 0.1125 |
| 2975 | GTF3C1 | P76T-E | Human | Esophagus | ESCC | 1.21e-12 | 2.62e-01 | 0.1207 |
| 2975 | GTF3C1 | P79T-E | Human | Esophagus | ESCC | 5.04e-32 | 5.24e-01 | 0.1154 |
| 2975 | GTF3C1 | P80T-E | Human | Esophagus | ESCC | 3.88e-22 | 5.26e-01 | 0.155 |
| 2975 | GTF3C1 | P82T-E | Human | Esophagus | ESCC | 1.99e-06 | 4.72e-01 | 0.1072 |
| 2975 | GTF3C1 | P83T-E | Human | Esophagus | ESCC | 2.53e-18 | 6.05e-01 | 0.1738 |
| 2975 | GTF3C1 | P84T-E | Human | Esophagus | ESCC | 6.49e-06 | 4.73e-01 | 0.0933 |
| 2975 | GTF3C1 | P89T-E | Human | Esophagus | ESCC | 3.18e-05 | 5.09e-01 | 0.1752 |
| 2975 | GTF3C1 | P91T-E | Human | Esophagus | ESCC | 2.55e-11 | 9.24e-01 | 0.1828 |
| Page: 1 2 3 4 5 6 |
| Tissue | Expression Dynamics | Abbreviation |
| Esophagus | 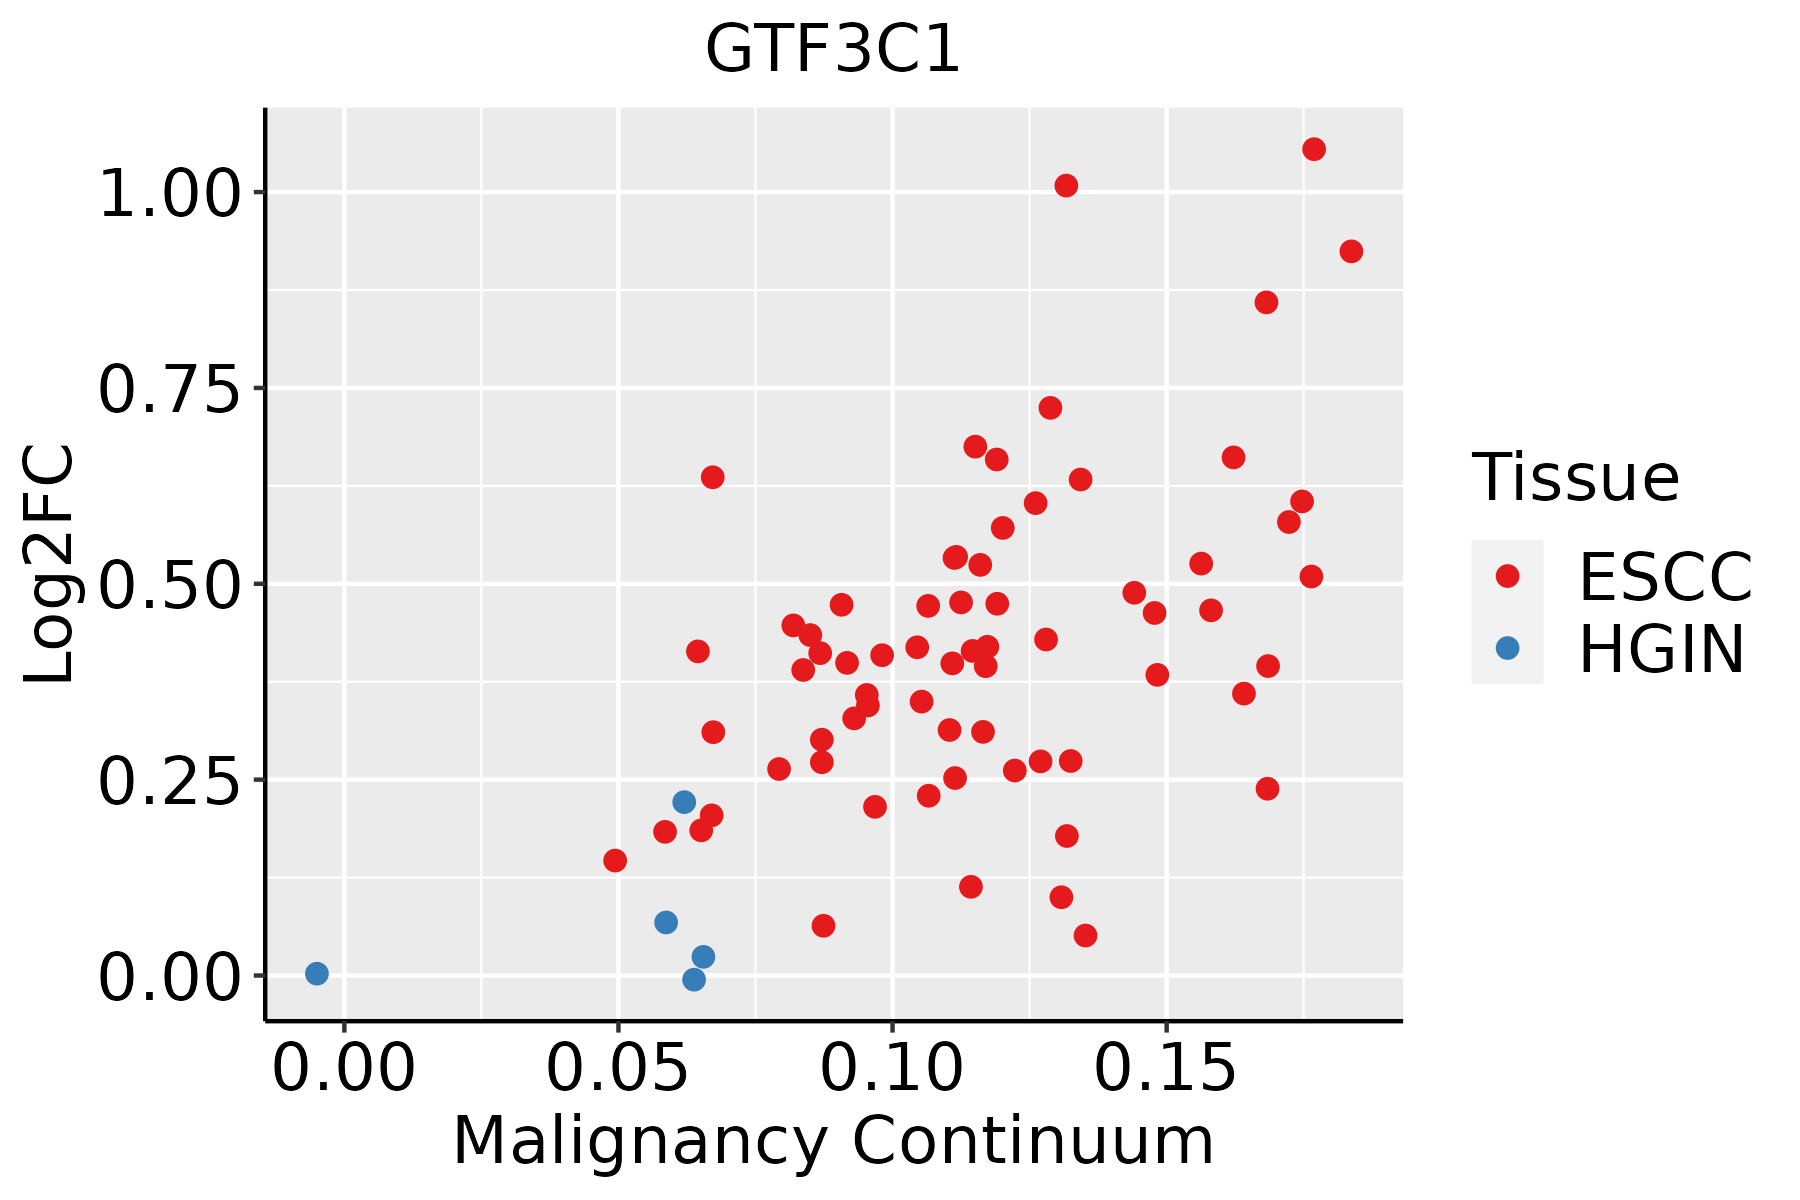 | ESCC: Esophageal squamous cell carcinoma |
| HGIN: High-grade intraepithelial neoplasias | ||
| LGIN: Low-grade intraepithelial neoplasias | ||
| Liver | 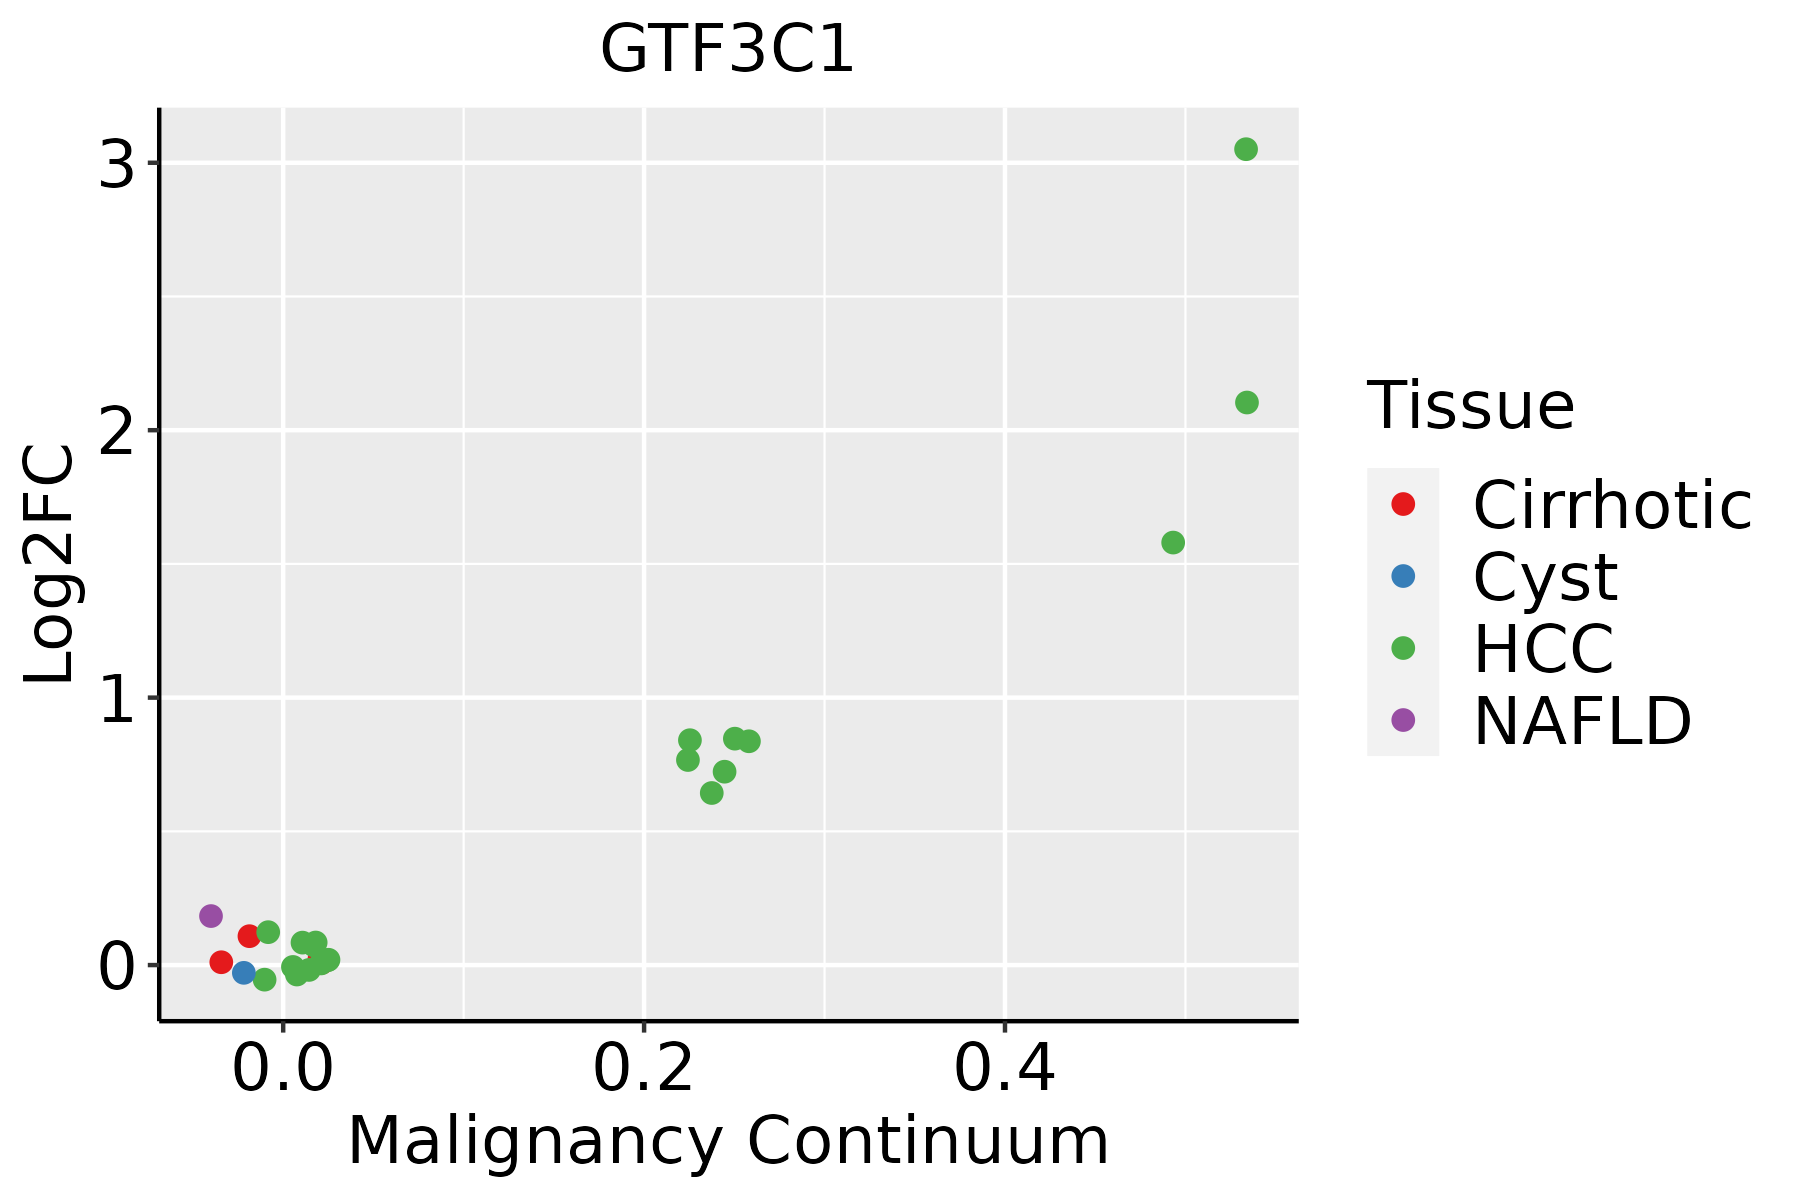 | HCC: Hepatocellular carcinoma |
| NAFLD: Non-alcoholic fatty liver disease | ||
| Oral Cavity | 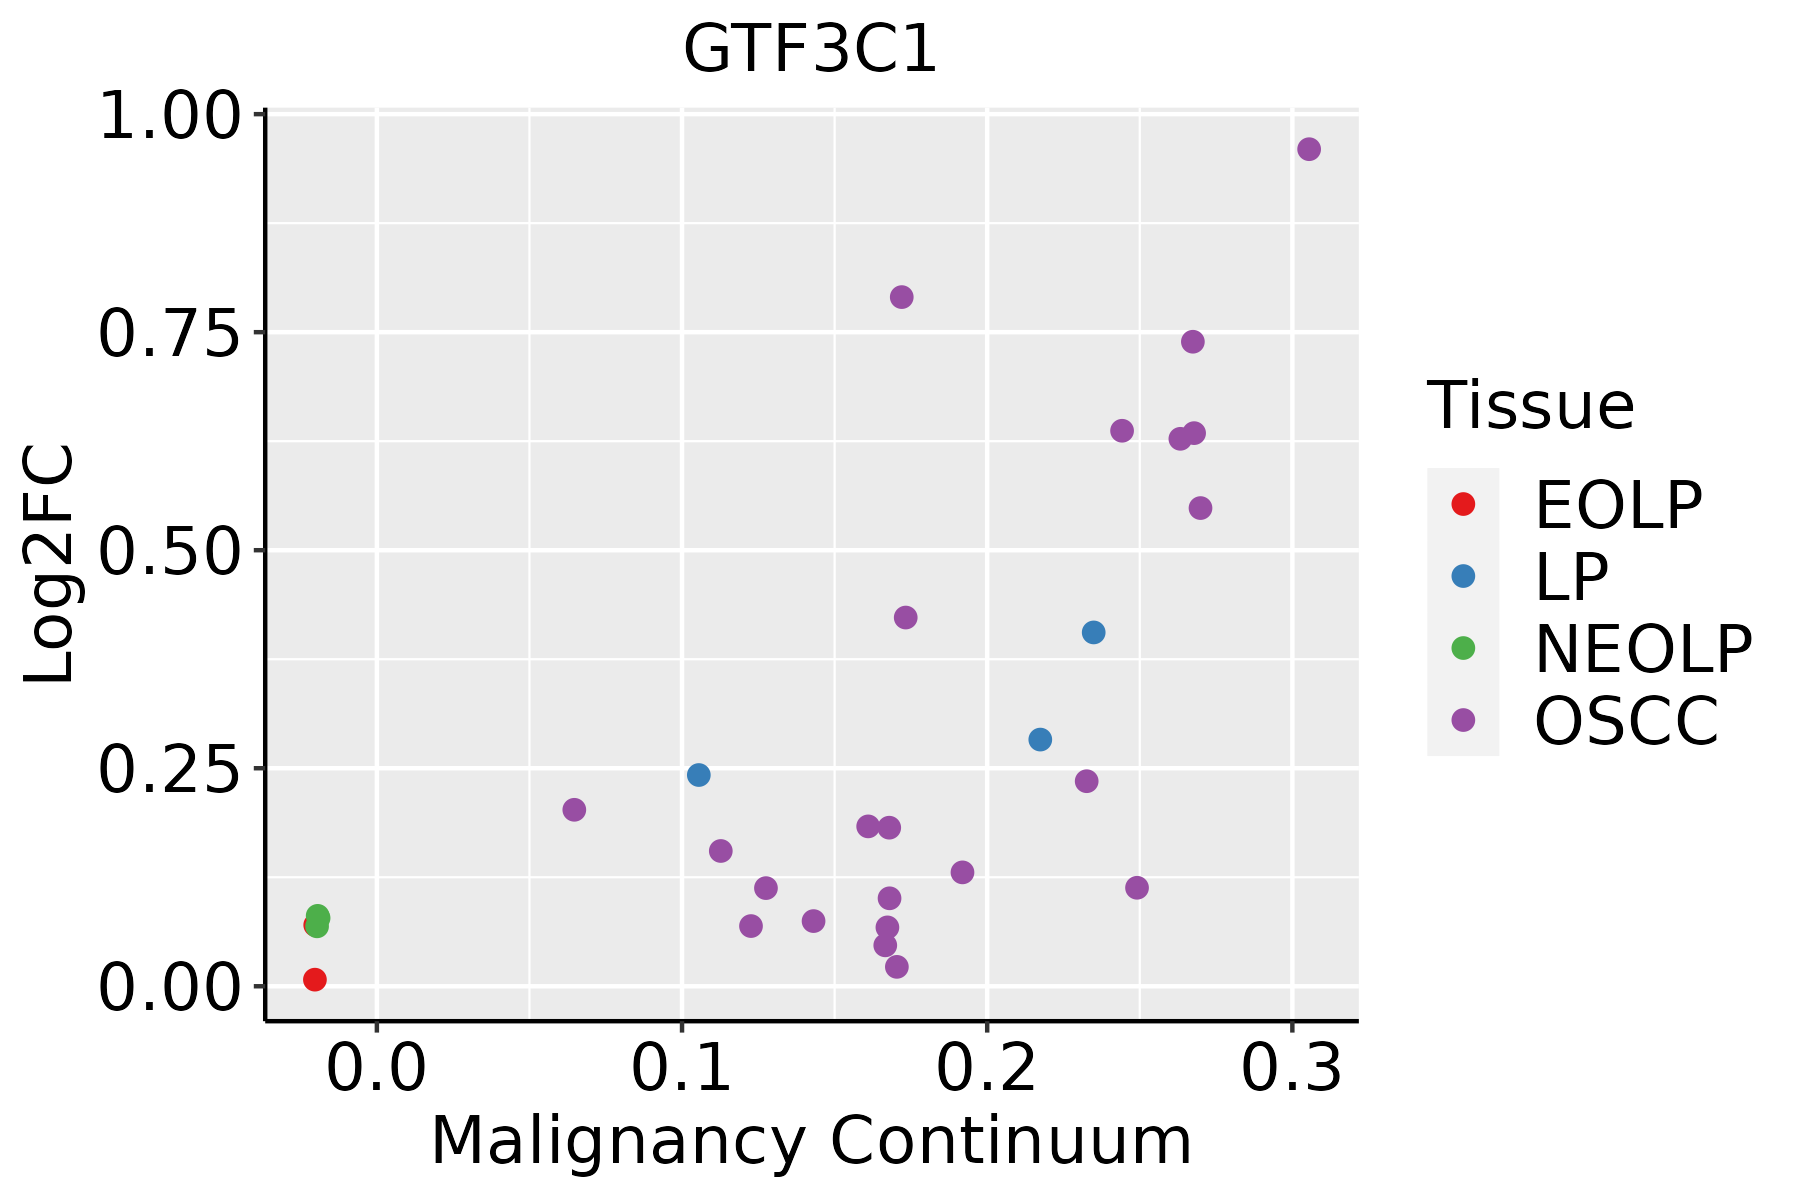 | EOLP: Erosive Oral lichen planus |
| LP: leukoplakia | ||
| NEOLP: Non-erosive oral lichen planus | ||
| OSCC: Oral squamous cell carcinoma | ||
| Prostate | 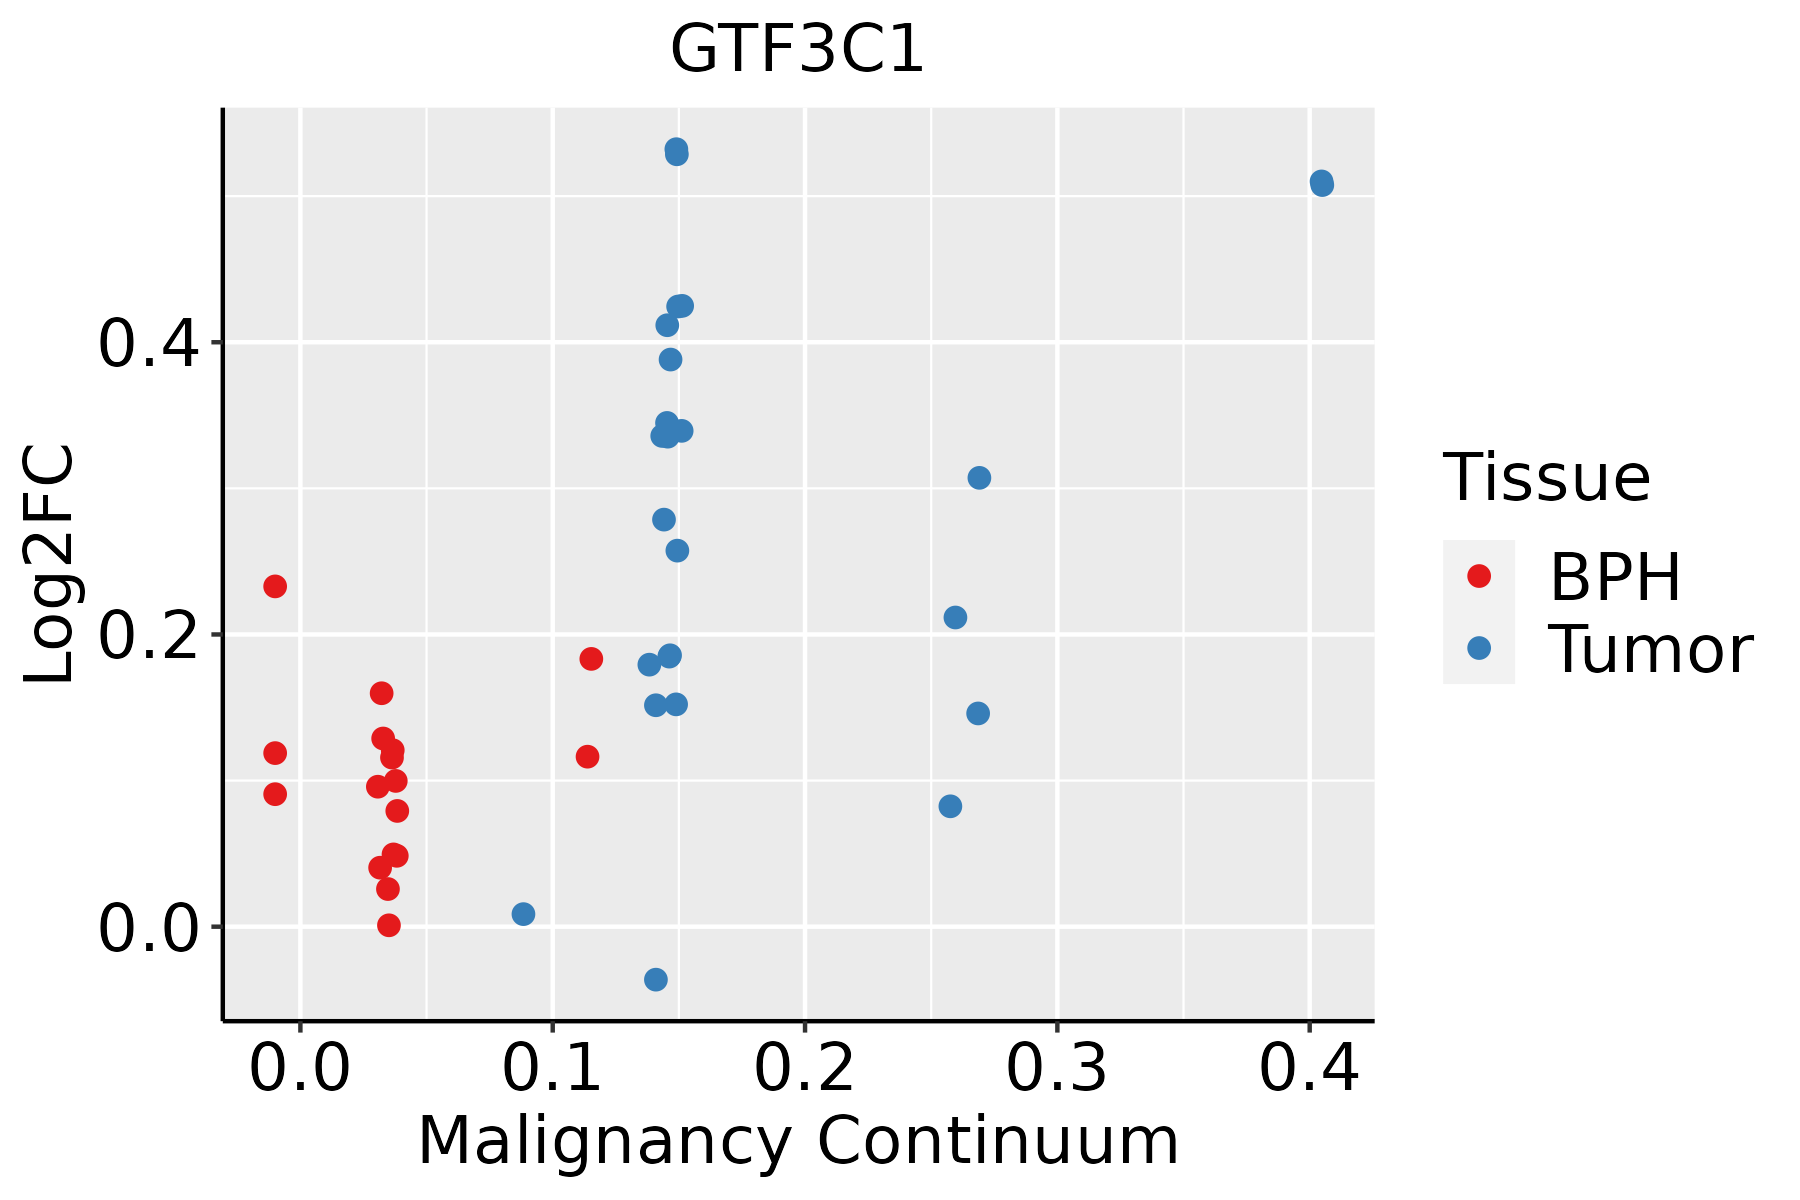 | BPH: Benign Prostatic Hyperplasia |
| Thyroid | 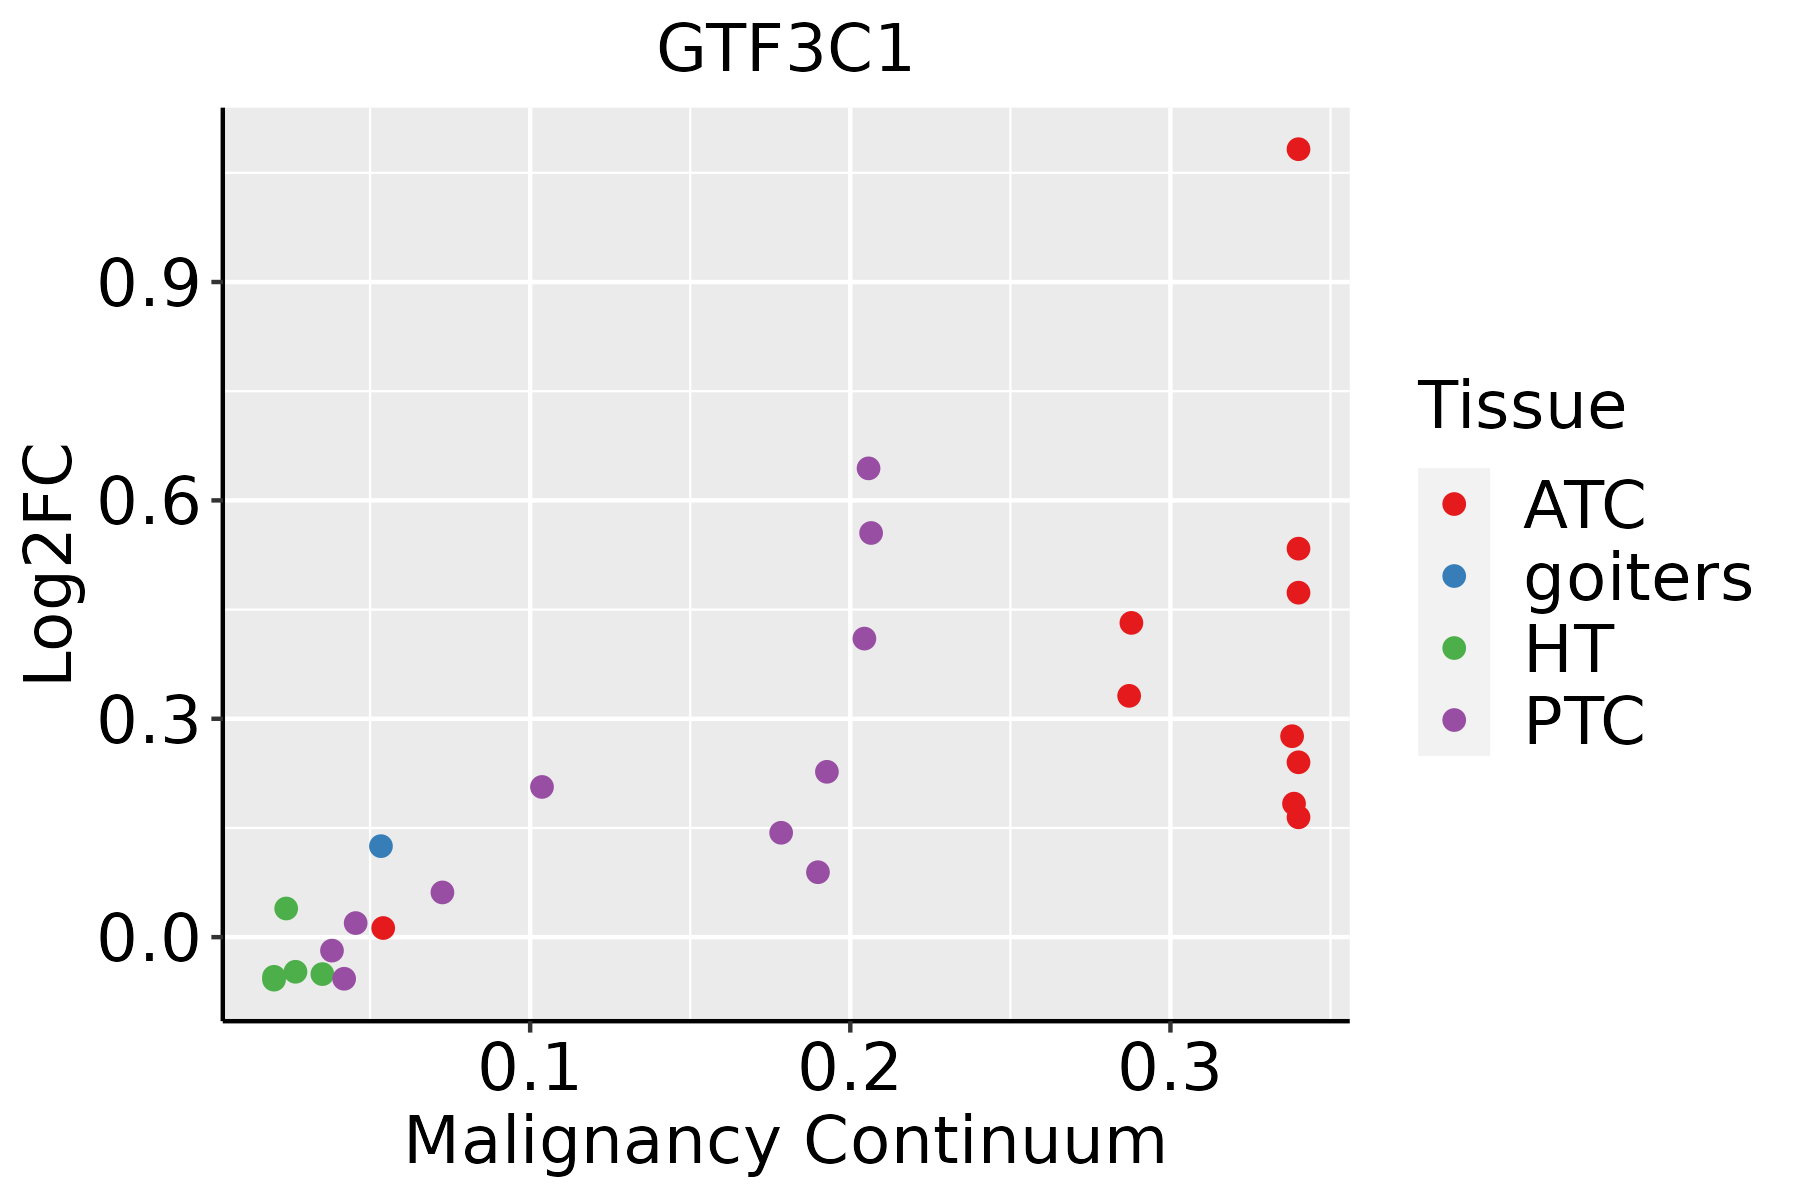 | ATC: Anaplastic thyroid cancer |
| HT: Hashimoto's thyroiditis | ||
| PTC: Papillary thyroid cancer |
| ∗log2FC in expression of this searched gene in stem-like cells from each diseased tissue sample relative to stem-like cells in normal samples in each tissue plotted against the malignancy continuum. Samples are colored based on if they are from different disease stage. |
Top |
Malignant transformation related pathway analysis |
| Find out the enriched GO biological processes and KEGG pathways involved in transition from healthy to precancer to cancer |
| Tissue | Disease Stage | Enriched GO biological Processes |
| Colorectum | AD |  |
| Colorectum | SER |  |
| Colorectum | MSS |  |
| Colorectum | MSI-H |  |
| Colorectum | FAP |  |
| ∗Top 15 enriched GO BP terms are showed in the bar plot of each disease state in each tissue. Each row represents a significant GO biological process which is colored according to the -log10(p.adjust). |
| Page: 1 2 3 4 5 6 7 8 9 |
| GO ID | Tissue | Disease Stage | Description | Gene Ratio | Bg Ratio | pvalue | p.adjust | Count |
| GO:00063523 | Esophagus | HGIN | DNA-templated transcription, initiation | 30/2587 | 130/18723 | 2.86e-03 | 2.79e-02 | 30 |
| GO:00063833 | Esophagus | ESCC | transcription by RNA polymerase III | 41/8552 | 46/18723 | 7.69e-10 | 1.90e-08 | 41 |
| GO:00987812 | Esophagus | ESCC | ncRNA transcription | 45/8552 | 56/18723 | 1.05e-07 | 1.72e-06 | 45 |
| GO:000635211 | Esophagus | ESCC | DNA-templated transcription, initiation | 86/8552 | 130/18723 | 1.88e-06 | 2.19e-05 | 86 |
| GO:00093032 | Esophagus | ESCC | rRNA transcription | 28/8552 | 34/18723 | 1.21e-05 | 1.12e-04 | 28 |
| GO:0006352 | Liver | HCC | DNA-templated transcription, initiation | 78/7958 | 130/18723 | 4.19e-05 | 4.11e-04 | 78 |
| GO:0009303 | Liver | HCC | rRNA transcription | 25/7958 | 34/18723 | 2.42e-04 | 1.81e-03 | 25 |
| GO:0006383 | Liver | HCC | transcription by RNA polymerase III | 31/7958 | 46/18723 | 5.67e-04 | 3.61e-03 | 31 |
| GO:0098781 | Liver | HCC | ncRNA transcription | 33/7958 | 56/18723 | 9.64e-03 | 3.63e-02 | 33 |
| GO:00063832 | Oral cavity | OSCC | transcription by RNA polymerase III | 34/7305 | 46/18723 | 1.61e-06 | 2.11e-05 | 34 |
| GO:00987811 | Oral cavity | OSCC | ncRNA transcription | 38/7305 | 56/18723 | 1.15e-05 | 1.18e-04 | 38 |
| GO:00063522 | Oral cavity | OSCC | DNA-templated transcription, initiation | 74/7305 | 130/18723 | 2.56e-05 | 2.39e-04 | 74 |
| GO:00093031 | Oral cavity | OSCC | rRNA transcription | 24/7305 | 34/18723 | 1.89e-04 | 1.28e-03 | 24 |
| GO:00063525 | Thyroid | PTC | DNA-templated transcription, initiation | 63/5968 | 130/18723 | 5.72e-05 | 5.05e-04 | 63 |
| GO:00987814 | Thyroid | PTC | ncRNA transcription | 27/5968 | 56/18723 | 7.77e-03 | 3.29e-02 | 27 |
| GO:00063835 | Thyroid | PTC | transcription by RNA polymerase III | 23/5968 | 46/18723 | 7.89e-03 | 3.33e-02 | 23 |
| GO:000635213 | Thyroid | ATC | DNA-templated transcription, initiation | 64/6293 | 130/18723 | 1.60e-04 | 1.10e-03 | 64 |
| Page: 1 |
| Pathway ID | Tissue | Disease Stage | Description | Gene Ratio | Bg Ratio | pvalue | p.adjust | qvalue | Count |
| Page: 1 |
Top |
Cell-cell communication analysis |
| Identification of potential cell-cell interactions between two cell types and their ligand-receptor pairs for different disease states |
| Ligand | Receptor | LRpair | Pathway | Tissue | Disease Stage |
| Page: 1 |
Top |
Single-cell gene regulatory network inference analysis |
| Find out the significant the regulons (TFs) and the target genes of each regulon across cell types for different disease states |
| TF | Cell Type | Tissue | Disease Stage | Target Gene | RSS | Regulon Activity |
| ∗The dot plots of a searched regulon are shown for all cell subpopulations in each disease state of each tissue based on the regulon specific score inferred using pySCENIC and by calculating the average expression. |
| Page: 1 |
Top |
Somatic mutation of malignant transformation related genes |
| Annotation of somatic variants for genes involved in malignant transformation |
| Hugo Symbol | Variant Class | Variant Classification | dbSNP RS | HGVSc | HGVSp | HGVSp Short | SWISSPROT | BIOTYPE | SIFT | PolyPhen | Tumor Sample Barcode | Tissue | Histology | Sex | Age | Stage | Therapy Types | Drugs | Outcome |
| GTF3C1 | SNV | Missense_Mutation | novel | c.3554N>T | p.Ser1185Phe | p.S1185F | Q12789 | protein_coding | tolerated(0.09) | benign(0.007) | TCGA-5L-AAT1-01 | Breast | breast invasive carcinoma | Female | <65 | III/IV | Hormone Therapy | letrozol | SD |
| GTF3C1 | SNV | Missense_Mutation | rs773175888 | c.3066N>C | p.Glu1022Asp | p.E1022D | Q12789 | protein_coding | tolerated(0.19) | benign(0.033) | TCGA-A2-A3Y0-01 | Breast | breast invasive carcinoma | Female | <65 | I/II | Chemotherapy | adriamycin | CR |
| GTF3C1 | SNV | Missense_Mutation | novel | c.1706N>C | p.His569Pro | p.H569P | Q12789 | protein_coding | deleterious(0.04) | benign(0.003) | TCGA-A8-A07G-01 | Breast | breast invasive carcinoma | Female | >=65 | I/II | Chemotherapy | 5-fluorouracil | CR |
| GTF3C1 | SNV | Missense_Mutation | c.4424G>T | p.Ser1475Ile | p.S1475I | Q12789 | protein_coding | deleterious(0.01) | probably_damaging(0.929) | TCGA-AR-A24H-01 | Breast | breast invasive carcinoma | Female | >=65 | I/II | Hormone Therapy | tamoxiphen | SD | |
| GTF3C1 | SNV | Missense_Mutation | c.1230C>G | p.Phe410Leu | p.F410L | Q12789 | protein_coding | tolerated(0.06) | benign(0.079) | TCGA-BH-A0H5-01 | Breast | breast invasive carcinoma | Female | <65 | I/II | Chemotherapy | cytoxan | CR | |
| GTF3C1 | SNV | Missense_Mutation | c.287A>T | p.Asp96Val | p.D96V | Q12789 | protein_coding | deleterious(0) | possibly_damaging(0.834) | TCGA-C8-A26W-01 | Breast | breast invasive carcinoma | Female | <65 | I/II | Chemotherapy | doxorubicin | CR | |
| GTF3C1 | SNV | Missense_Mutation | c.5230G>C | p.Glu1744Gln | p.E1744Q | Q12789 | protein_coding | tolerated(0.21) | benign(0.314) | TCGA-D8-A1JA-01 | Breast | breast invasive carcinoma | Female | <65 | III/IV | Chemotherapy | adriamycin | PD | |
| GTF3C1 | SNV | Missense_Mutation | c.1609N>A | p.Gly537Arg | p.G537R | Q12789 | protein_coding | tolerated(0.24) | benign(0) | TCGA-D8-A1JP-01 | Breast | breast invasive carcinoma | Female | >=65 | I/II | Hormone Therapy | tamoxiphen | SD | |
| GTF3C1 | SNV | Missense_Mutation | novel | c.3737N>C | p.Tyr1246Ser | p.Y1246S | Q12789 | protein_coding | deleterious(0.01) | possibly_damaging(0.797) | TCGA-E2-A1LK-01 | Breast | breast invasive carcinoma | Female | >=65 | III/IV | Unknown | Unknown | PD |
| GTF3C1 | SNV | Missense_Mutation | c.384N>C | p.Arg128Ser | p.R128S | Q12789 | protein_coding | deleterious(0) | possibly_damaging(0.581) | TCGA-E9-A226-01 | Breast | breast invasive carcinoma | Female | <65 | III/IV | Hormone Therapy | tamoxiphen | PD |
| Page: 1 2 3 4 5 6 7 8 9 10 11 12 13 14 15 16 17 18 19 20 21 22 23 24 25 26 27 |
Top |
Related drugs of malignant transformation related genes |
| Identification of chemicals and drugs interact with genes involved in malignant transfromation |
| (DGIdb 4.0) |
| Entrez ID | Symbol | Category | Interaction Types | Drug Claim Name | Drug Name | PMIDs |
| Page: 1 |

Copyright 2023-Present -The University of Texas Health Science Center at Houston |