
|
|||||
|
 | |
| |
| |
| |
| |
| |
|
Gene: GTDC1 |
Gene summary for GTDC1 |
| Gene information | Species | Human | Gene symbol | GTDC1 | Gene ID | 79712 |
| Gene name | glycosyltransferase like domain containing 1 | |
| Gene Alias | Hmat-Xa | |
| Cytomap | 2q22.3 | |
| Gene Type | protein-coding | GO ID | GO:0003674 | UniProtAcc | Q4AE62 |
Top |
Malignant transformation analysis |
| Identification of the aberrant gene expression in precancerous and cancerous lesions by comparing the gene expression of stem-like cells in diseased tissues with normal stem cells |
| Entrez ID | Symbol | Replicates | Species | Organ | Tissue | Adj P-value | Log2FC | Malignancy |
| 79712 | GTDC1 | P79T-E | Human | Esophagus | ESCC | 1.46e-13 | 1.49e-01 | 0.1154 |
| 79712 | GTDC1 | P80T-E | Human | Esophagus | ESCC | 2.19e-04 | 1.05e-01 | 0.155 |
| 79712 | GTDC1 | P82T-E | Human | Esophagus | ESCC | 3.95e-03 | 1.96e-01 | 0.1072 |
| 79712 | GTDC1 | P83T-E | Human | Esophagus | ESCC | 3.19e-07 | 2.03e-01 | 0.1738 |
| 79712 | GTDC1 | P84T-E | Human | Esophagus | ESCC | 1.53e-03 | 1.74e-01 | 0.0933 |
| 79712 | GTDC1 | P91T-E | Human | Esophagus | ESCC | 5.82e-09 | 6.68e-01 | 0.1828 |
| 79712 | GTDC1 | P107T-E | Human | Esophagus | ESCC | 6.58e-09 | 1.97e-01 | 0.171 |
| 79712 | GTDC1 | P128T-E | Human | Esophagus | ESCC | 1.53e-10 | 3.34e-01 | 0.1241 |
| 79712 | GTDC1 | P130T-E | Human | Esophagus | ESCC | 1.77e-24 | 4.82e-01 | 0.1676 |
| 79712 | GTDC1 | HTA12-26-1 | Human | Pancreas | PDAC | 2.65e-11 | 6.44e-01 | 0.3728 |
| 79712 | GTDC1 | HTA12-29-1 | Human | Pancreas | PDAC | 5.23e-35 | 8.11e-01 | 0.3722 |
| 79712 | GTDC1 | male-WTA | Human | Thyroid | PTC | 9.12e-06 | 3.42e-02 | 0.1037 |
| 79712 | GTDC1 | PTC01 | Human | Thyroid | PTC | 1.86e-03 | 2.95e-02 | 0.1899 |
| 79712 | GTDC1 | PTC04 | Human | Thyroid | PTC | 1.54e-08 | 6.90e-02 | 0.1927 |
| 79712 | GTDC1 | PTC05 | Human | Thyroid | PTC | 7.48e-08 | 1.43e-01 | 0.2065 |
| 79712 | GTDC1 | PTC06 | Human | Thyroid | PTC | 3.06e-06 | 1.99e-01 | 0.2057 |
| 79712 | GTDC1 | PTC07 | Human | Thyroid | PTC | 2.77e-07 | 1.10e-01 | 0.2044 |
| 79712 | GTDC1 | ATC12 | Human | Thyroid | ATC | 2.12e-04 | -3.37e-03 | 0.34 |
| 79712 | GTDC1 | ATC13 | Human | Thyroid | ATC | 6.41e-52 | 9.75e-01 | 0.34 |
| 79712 | GTDC1 | ATC2 | Human | Thyroid | ATC | 1.43e-02 | 5.04e-01 | 0.34 |
| Page: 1 2 3 4 |
| Tissue | Expression Dynamics | Abbreviation |
| Cervix |  | CC: Cervix cancer |
| HSIL_HPV: HPV-infected high-grade squamous intraepithelial lesions | ||
| N_HPV: HPV-infected normal cervix | ||
| Esophagus | 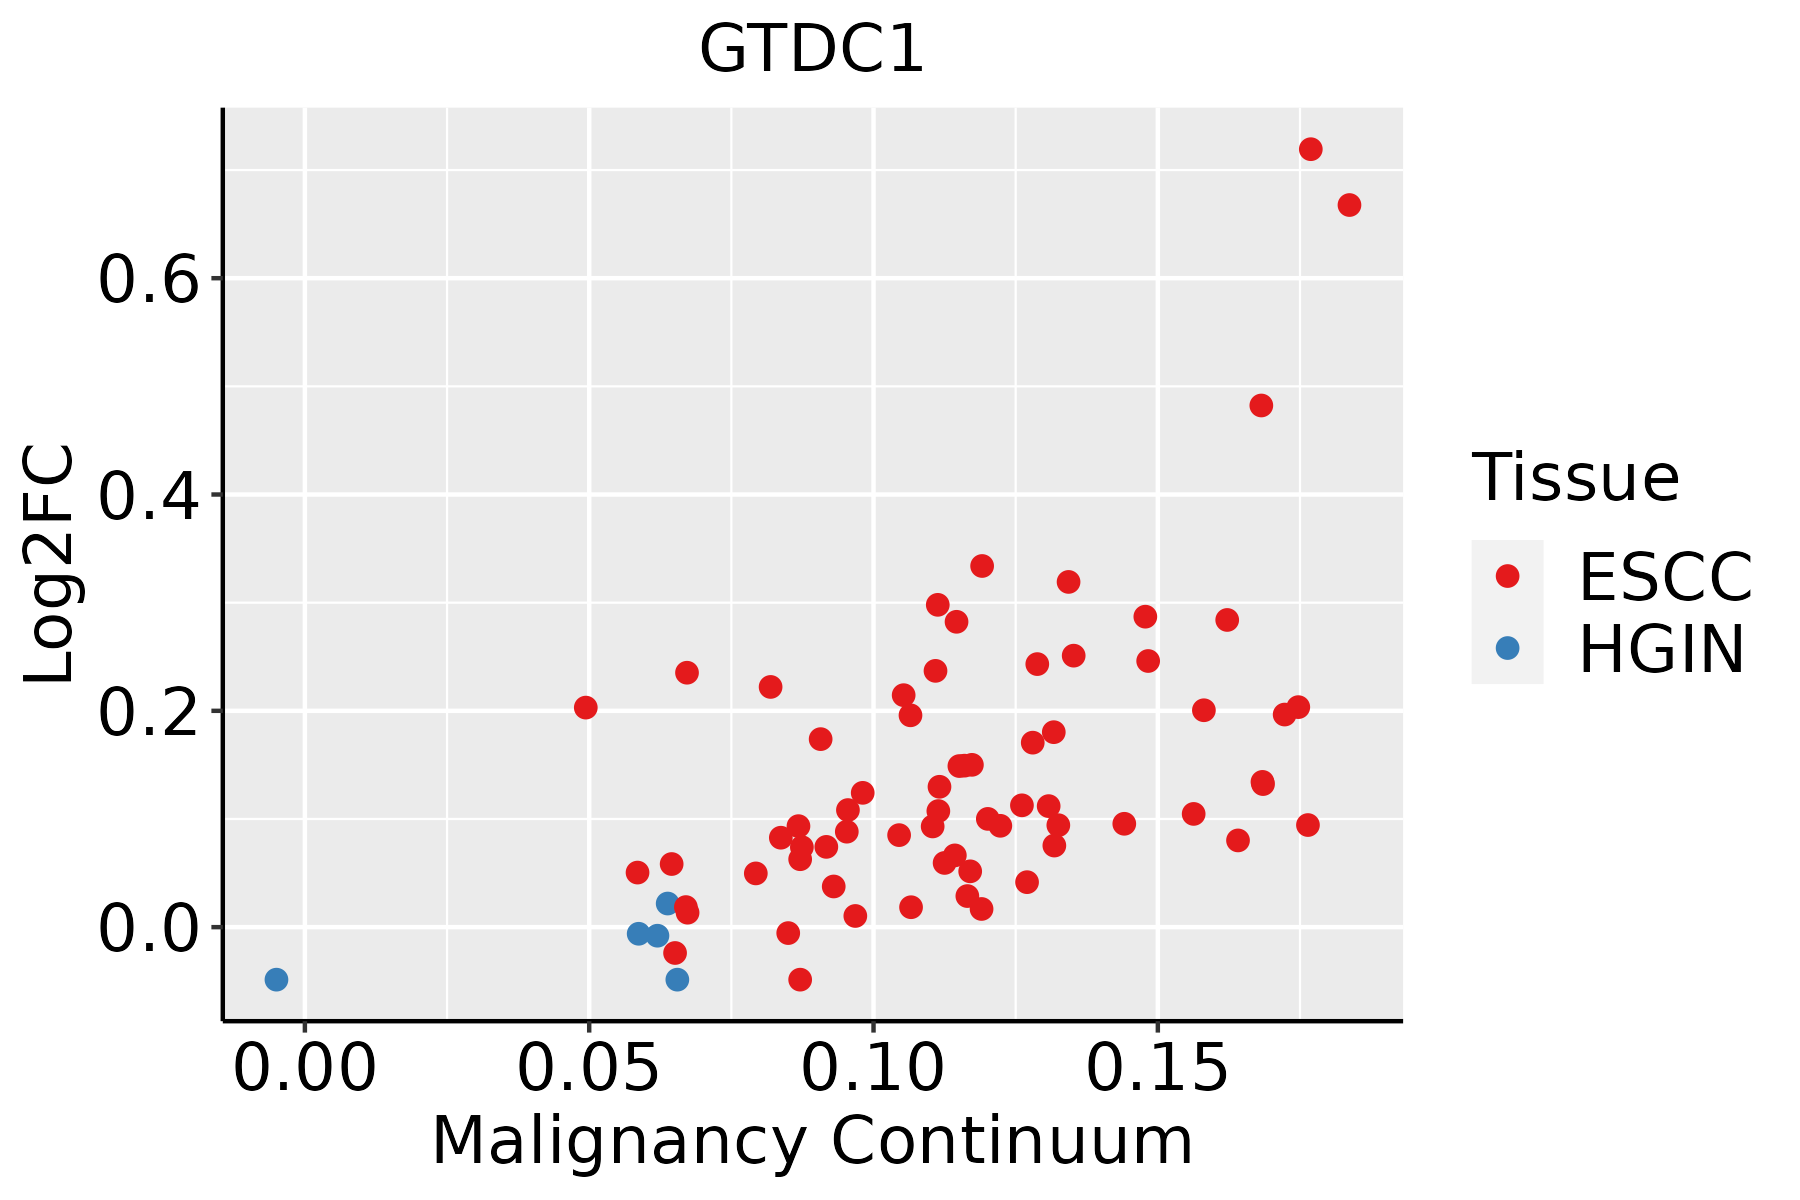 | ESCC: Esophageal squamous cell carcinoma |
| HGIN: High-grade intraepithelial neoplasias | ||
| LGIN: Low-grade intraepithelial neoplasias | ||
| Thyroid |  | ATC: Anaplastic thyroid cancer |
| HT: Hashimoto's thyroiditis | ||
| PTC: Papillary thyroid cancer |
| ∗log2FC in expression of this searched gene in stem-like cells from each diseased tissue sample relative to stem-like cells in normal samples in each tissue plotted against the malignancy continuum. Samples are colored based on if they are from different disease stage. |
Top |
Malignant transformation related pathway analysis |
| Find out the enriched GO biological processes and KEGG pathways involved in transition from healthy to precancer to cancer |
| Tissue | Disease Stage | Enriched GO biological Processes |
| Colorectum | AD |  |
| Colorectum | SER |  |
| Colorectum | MSS |  |
| Colorectum | MSI-H |  |
| Colorectum | FAP |  |
| ∗Top 15 enriched GO BP terms are showed in the bar plot of each disease state in each tissue. Each row represents a significant GO biological process which is colored according to the -log10(p.adjust). |
| Page: 1 2 3 4 5 6 7 8 9 |
| GO ID | Tissue | Disease Stage | Description | Gene Ratio | Bg Ratio | pvalue | p.adjust | Count |
| Page: 1 |
| Pathway ID | Tissue | Disease Stage | Description | Gene Ratio | Bg Ratio | pvalue | p.adjust | qvalue | Count |
| Page: 1 |
Top |
Cell-cell communication analysis |
| Identification of potential cell-cell interactions between two cell types and their ligand-receptor pairs for different disease states |
| Ligand | Receptor | LRpair | Pathway | Tissue | Disease Stage |
| Page: 1 |
Top |
Single-cell gene regulatory network inference analysis |
| Find out the significant the regulons (TFs) and the target genes of each regulon across cell types for different disease states |
| TF | Cell Type | Tissue | Disease Stage | Target Gene | RSS | Regulon Activity |
| ∗The dot plots of a searched regulon are shown for all cell subpopulations in each disease state of each tissue based on the regulon specific score inferred using pySCENIC and by calculating the average expression. |
| Page: 1 |
Top |
Somatic mutation of malignant transformation related genes |
| Annotation of somatic variants for genes involved in malignant transformation |
| Hugo Symbol | Variant Class | Variant Classification | dbSNP RS | HGVSc | HGVSp | HGVSp Short | SWISSPROT | BIOTYPE | SIFT | PolyPhen | Tumor Sample Barcode | Tissue | Histology | Sex | Age | Stage | Therapy Types | Drugs | Outcome |
| GTDC1 | SNV | Missense_Mutation | novel | c.257N>A | p.Ile86Asn | p.I86N | Q4AE62 | protein_coding | deleterious(0) | possibly_damaging(0.899) | TCGA-C8-A12K-01 | Breast | breast invasive carcinoma | Female | >=65 | I/II | Unknown | Unknown | SD |
| GTDC1 | SNV | Missense_Mutation | c.997N>C | p.Glu333Gln | p.E333Q | Q4AE62 | protein_coding | tolerated(0.09) | possibly_damaging(0.653) | TCGA-C8-A1HM-01 | Breast | breast invasive carcinoma | Female | >=65 | I/II | Chemotherapy | doxorubicin | CR | |
| GTDC1 | SNV | Missense_Mutation | rs150712882 | c.1141N>A | p.Val381Met | p.V381M | Q4AE62 | protein_coding | deleterious(0) | probably_damaging(1) | TCGA-E9-A1NF-01 | Breast | breast invasive carcinoma | Female | <65 | I/II | Chemotherapy | doxorubicin | PD |
| GTDC1 | insertion | Nonsense_Mutation | novel | c.527_528insTACCTAAGCGAGCCATGTCAGCTCTCTG | p.Met176IlefsTer3 | p.M176Ifs*3 | Q4AE62 | protein_coding | TCGA-A8-A08H-01 | Breast | breast invasive carcinoma | Female | >=65 | I/II | Unknown | Unknown | SD | ||
| GTDC1 | SNV | Missense_Mutation | novel | c.624N>C | p.Gln208His | p.Q208H | Q4AE62 | protein_coding | tolerated_low_confidence(0.39) | benign(0.088) | TCGA-C5-A8YQ-01 | Cervix | cervical & endocervical cancer | Female | >=65 | I/II | Chemotherapy | cisplatin | PD |
| GTDC1 | SNV | Missense_Mutation | novel | c.624N>C | p.Gln208His | p.Q208H | Q4AE62 | protein_coding | tolerated_low_confidence(0.39) | benign(0.088) | TCGA-EK-A2RM-01 | Cervix | cervical & endocervical cancer | Female | <65 | I/II | Unknown | Unknown | SD |
| GTDC1 | SNV | Missense_Mutation | c.27C>G | p.Phe9Leu | p.F9L | Q4AE62 | protein_coding | deleterious(0) | probably_damaging(0.996) | TCGA-EX-A1H6-01 | Cervix | cervical & endocervical cancer | Female | <65 | I/II | Unknown | Unknown | SD | |
| GTDC1 | SNV | Missense_Mutation | novel | c.101N>T | p.Pro34Leu | p.P34L | Q4AE62 | protein_coding | deleterious(0) | possibly_damaging(0.566) | TCGA-JW-A5VL-01 | Cervix | cervical & endocervical cancer | Female | <65 | I/II | Unknown | Unknown | SD |
| GTDC1 | SNV | Missense_Mutation | rs142181617 | c.214G>A | p.Glu72Lys | p.E72K | Q4AE62 | protein_coding | deleterious(0) | probably_damaging(0.999) | TCGA-AA-3510-01 | Colorectum | colon adenocarcinoma | Male | >=65 | I/II | Unknown | Unknown | SD |
| GTDC1 | SNV | Missense_Mutation | c.636G>T | p.Glu212Asp | p.E212D | Q4AE62 | protein_coding | tolerated_low_confidence(0.26) | benign(0.021) | TCGA-AA-3977-01 | Colorectum | colon adenocarcinoma | Male | >=65 | I/II | Unknown | Unknown | SD |
| Page: 1 2 3 4 5 6 7 8 9 |
Top |
Related drugs of malignant transformation related genes |
| Identification of chemicals and drugs interact with genes involved in malignant transfromation |
| (DGIdb 4.0) |
| Entrez ID | Symbol | Category | Interaction Types | Drug Claim Name | Drug Name | PMIDs |
| Page: 1 |

Copyright 2023-Present -The University of Texas Health Science Center at Houston |