Schematic overview of the cellular and molecular mechanisms involved in the cancer progression, including the proposed cellular and molecular mechanisms in cancer cells trajectory. AT1: alveolar type 1 cells; AT2: alveolar type 2 cells; AAH: atypical adenomatous hyperplasia; AIS: adenocarcinoma in situ; MIA: minimally invasive adenocarcinoma; IA: invasive adenocarcinoma; EMT: epithelial-mesenchymal transition

Home

Download

Statistics

Help

Contact

Center for Computational Systems Medicine
leaf

Gene summary

leaf

Malignant transformation analysis

leaf

Malignant transformation related pathway analysis

leaf

Cell-cell communication analysis

leaf

Single-cell gene regulatory network inference analysis

leaf

Somatic mutation of malignant transformation related genes

leaf

Related drugs of malignant transformation related genes

Gene: GRIPAP1

Gene summary for GRIPAP1

check button Gene summary.

Gene informationSpeciesHuman
Gene symbol

GRIPAP1

Gene ID

56850

Gene nameGRIP1 associated protein 1
Gene AliasGRASP-1
CytomapXp11.23
Gene Typeprotein-coding
GO ID

GO:0006810

UniProtAcc

Q4V328


Top

Malignant transformation analysis

check button Identification of the aberrant gene expression in precancerous and cancerous lesions by comparing the gene expression of stem-like cells in diseased tissues with normal stem cells
check button Malignant transformation involving gene list.
Entrez IDSymbolReplicatesSpeciesOrganTissueAdj P-valueLog2FCMalignancy
56850GRIPAP1P57T-EHumanEsophagusESCC5.67e-222.04e-010.0926
56850GRIPAP1P61T-EHumanEsophagusESCC2.48e-244.88e-010.099
56850GRIPAP1P62T-EHumanEsophagusESCC1.07e-335.94e-010.1302
56850GRIPAP1P65T-EHumanEsophagusESCC1.28e-101.30e-010.0978
56850GRIPAP1P74T-EHumanEsophagusESCC9.40e-154.34e-010.1479
56850GRIPAP1P75T-EHumanEsophagusESCC1.50e-183.86e-010.1125
56850GRIPAP1P76T-EHumanEsophagusESCC4.90e-121.77e-010.1207
56850GRIPAP1P79T-EHumanEsophagusESCC4.29e-183.27e-010.1154
56850GRIPAP1P80T-EHumanEsophagusESCC1.09e-306.55e-010.155
56850GRIPAP1P82T-EHumanEsophagusESCC6.90e-114.20e-010.1072
56850GRIPAP1P83T-EHumanEsophagusESCC1.03e-083.09e-010.1738
56850GRIPAP1P84T-EHumanEsophagusESCC6.74e-072.61e-010.0933
56850GRIPAP1P89T-EHumanEsophagusESCC1.68e-084.53e-010.1752
56850GRIPAP1P91T-EHumanEsophagusESCC2.92e-171.12e+000.1828
56850GRIPAP1P104T-EHumanEsophagusESCC2.98e-021.95e-010.0931
56850GRIPAP1P107T-EHumanEsophagusESCC9.25e-122.83e-010.171
56850GRIPAP1P127T-EHumanEsophagusESCC1.95e-071.62e-010.0826
56850GRIPAP1P128T-EHumanEsophagusESCC1.00e-123.72e-010.1241
56850GRIPAP1P130T-EHumanEsophagusESCC2.69e-163.60e-010.1676
56850GRIPAP1HCC1_MengHumanLiverHCC2.01e-232.02e-020.0246
Page: 1 2 3 4 5 

check button Transcriptomic changes along malignancy continuum.
TissueExpression DynamicsAbbreviation
EsophagusThe image shows the transcriptomic changes along malignancy continuum.log2FC in expression of this searched gene in stem-like cells from each diseased tissue sample relative to stem-like cells in normal samples in each tissue plotted against the malignancy continuum. Samples are colored based on if they are from different disease stage.ESCC: Esophageal squamous cell carcinoma
HGIN: High-grade intraepithelial neoplasias
LGIN: Low-grade intraepithelial neoplasias
LiverThe image shows the transcriptomic changes along malignancy continuum.log2FC in expression of this searched gene in stem-like cells from each diseased tissue sample relative to stem-like cells in normal samples in each tissue plotted against the malignancy continuum. Samples are colored based on if they are from different disease stage.
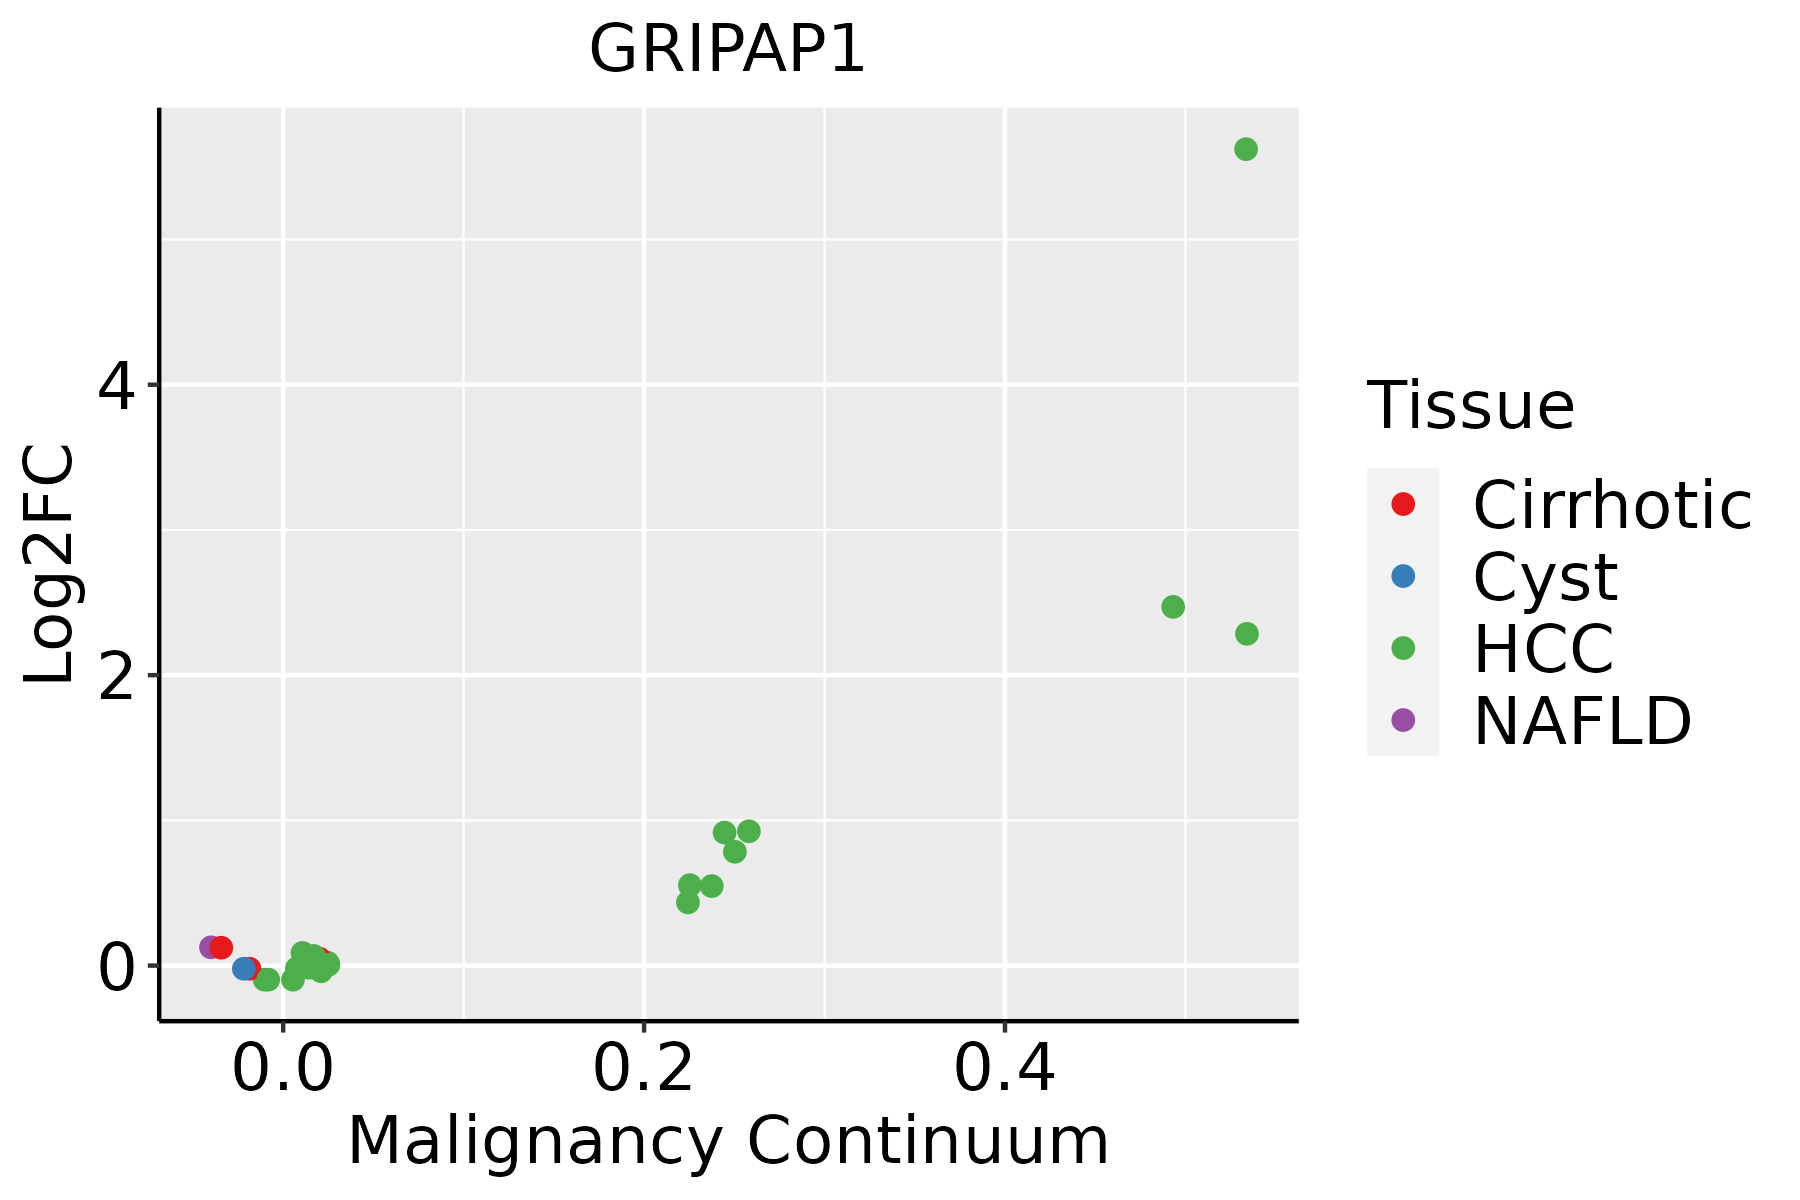
HCC: Hepatocellular carcinoma
NAFLD: Non-alcoholic fatty liver disease
Oral CavityThe image shows the transcriptomic changes along malignancy continuum.log2FC in expression of this searched gene in stem-like cells from each diseased tissue sample relative to stem-like cells in normal samples in each tissue plotted against the malignancy continuum. Samples are colored based on if they are from different disease stage.
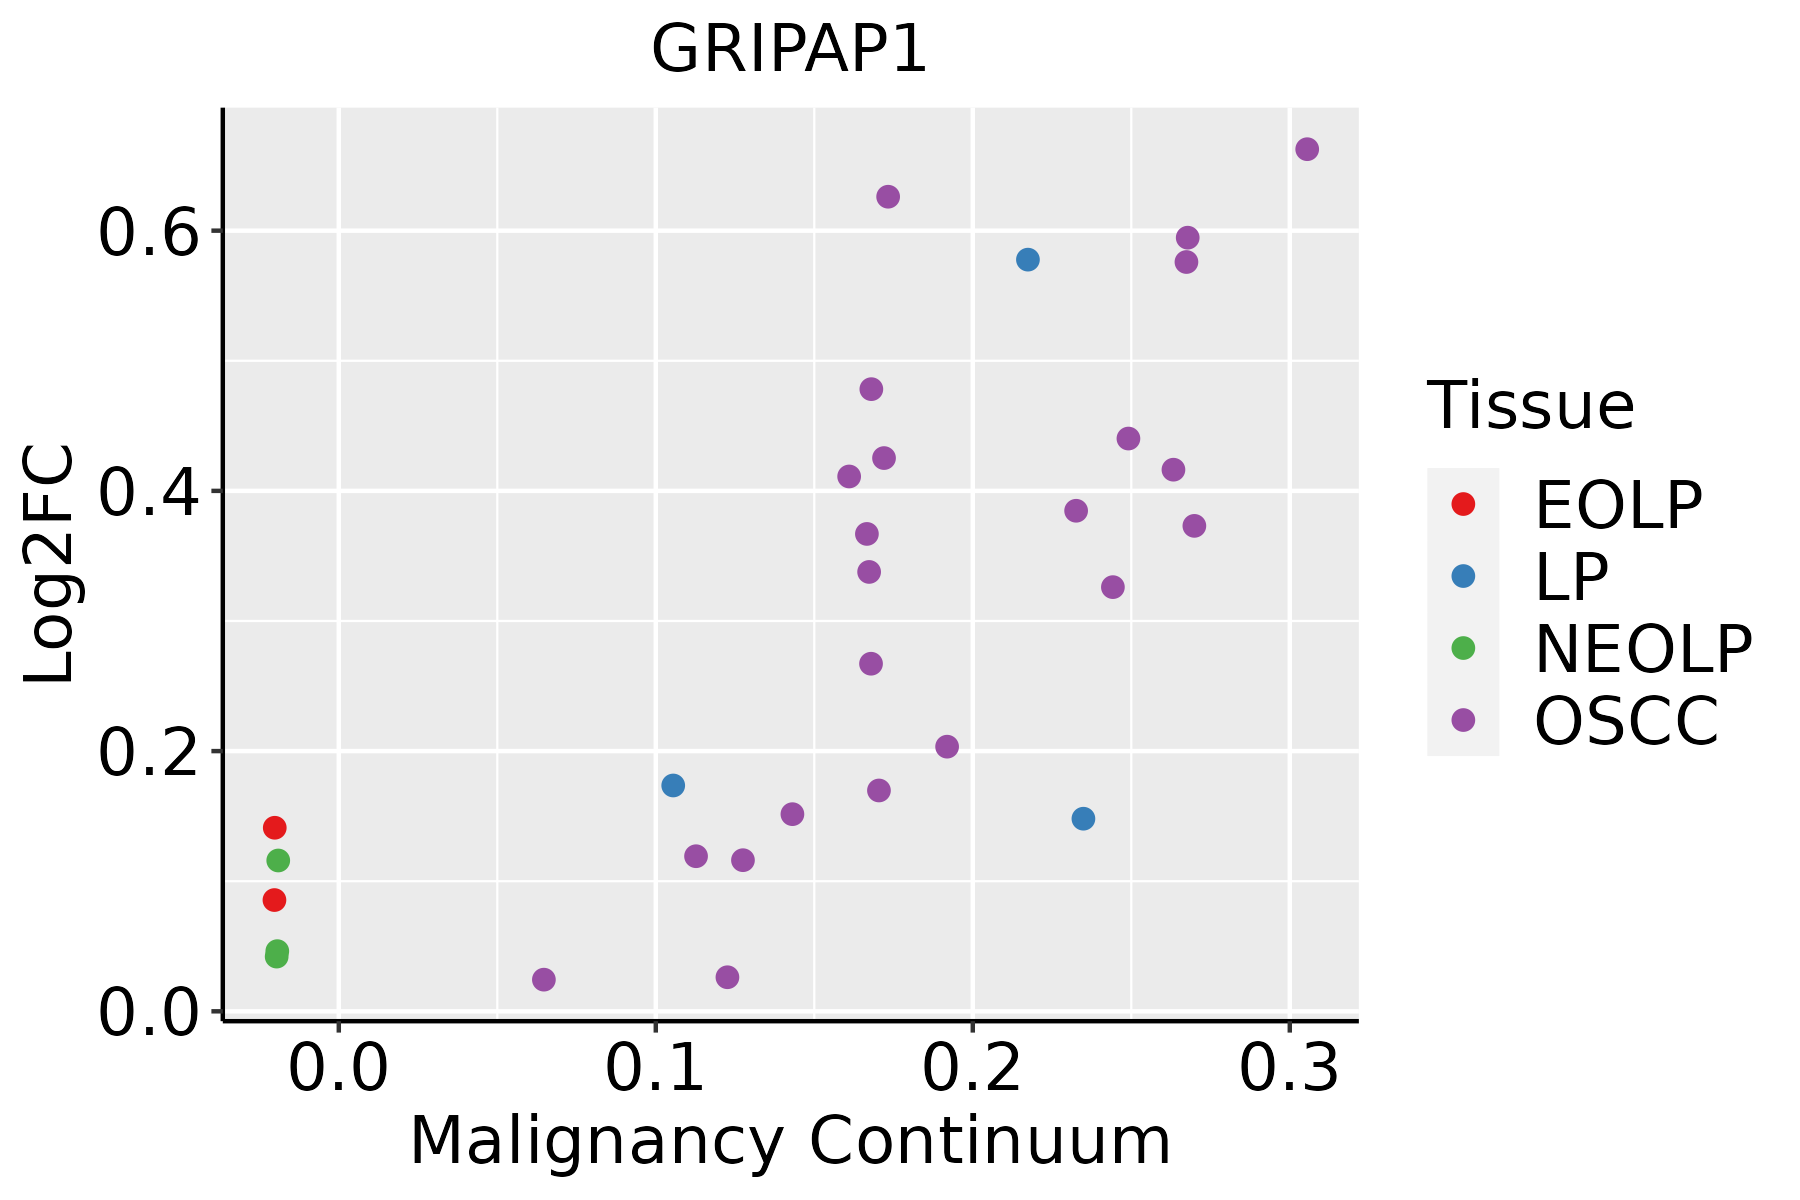
EOLP: Erosive Oral lichen planus
LP: leukoplakia
NEOLP: Non-erosive oral lichen planus
OSCC: Oral squamous cell carcinoma
ThyroidThe image shows the transcriptomic changes along malignancy continuum.log2FC in expression of this searched gene in stem-like cells from each diseased tissue sample relative to stem-like cells in normal samples in each tissue plotted against the malignancy continuum. Samples are colored based on if they are from different disease stage.ATC: Anaplastic thyroid cancer
HT: Hashimoto's thyroiditis
PTC: Papillary thyroid cancer
∗log2FC in expression of this searched gene in stem-like cells from each diseased tissue sample relative to stem-like cells in normal samples in each tissue plotted against the malignancy continuum. Samples are colored based on if they are from different disease stage.

Top

Malignant transformation related pathway analysis

check buttonFind out the enriched GO biological processes and KEGG pathways involved in transition from healthy to precancer to cancer
check button Figure of enriched GO biological processes.
TissueDisease StageEnriched GO biological Processes
ColorectumADGO analysis - Figure of enriched GO biological processes: Top 15 enriched GO BP terms are showed in the bar plot of each disease state in each tissue. Each row represents a significant GO biological process which is colored according to the -log10(p.adjust).
ColorectumSERGO analysis - Figure of enriched GO biological processes: Top 15 enriched GO BP terms are showed in the bar plot of each disease state in each tissue. Each row represents a significant GO biological process which is colored according to the -log10(p.adjust).
ColorectumMSSGO analysis - Figure of enriched GO biological processes: Top 15 enriched GO BP terms are showed in the bar plot of each disease state in each tissue. Each row represents a significant GO biological process which is colored according to the -log10(p.adjust).
ColorectumMSI-HGO analysis - Figure of enriched GO biological processes: Top 15 enriched GO BP terms are showed in the bar plot of each disease state in each tissue. Each row represents a significant GO biological process which is colored according to the -log10(p.adjust).
ColorectumFAPGO analysis - Figure of enriched GO biological processes: Top 15 enriched GO BP terms are showed in the bar plot of each disease state in each tissue. Each row represents a significant GO biological process which is colored according to the -log10(p.adjust).
∗Top 15 enriched GO BP terms are showed in the bar plot of each disease state in each tissue. Each row represents a significant GO biological process which is colored according to the -log10(p.adjust).
Page: 1 2 3 4 5 6 7 8 9 

check button Enriched GO biological processes.
GO IDTissueDisease StageDescriptionGene RatioBg Ratiopvaluep.adjustCount
GO:003238618EsophagusESCCregulation of intracellular transport243/8552337/187233.20e-237.25e-21243
GO:0033157110EsophagusESCCregulation of intracellular protein transport169/8552229/187233.31e-183.23e-16169
GO:001619715EsophagusESCCendosomal transport168/8552230/187232.28e-171.93e-15168
GO:0090150110EsophagusESCCestablishment of protein localization to membrane182/8552260/187231.27e-158.19e-14182
GO:0072659110EsophagusESCCprotein localization to plasma membrane193/8552284/187231.95e-141.03e-12193
GO:199077819EsophagusESCCprotein localization to cell periphery217/8552333/187234.08e-131.88e-11217
GO:009887615EsophagusESCCvesicle-mediated transport to the plasma membrane99/8552136/187231.13e-103.39e-0999
GO:190547519EsophagusESCCregulation of protein localization to membrane117/8552175/187231.14e-082.26e-07117
GO:003150314EsophagusESCCprotein-containing complex localization139/8552220/187231.14e-071.85e-06139
GO:190437519EsophagusESCCregulation of protein localization to cell periphery85/8552125/187233.63e-075.06e-0685
GO:1903076110EsophagusESCCregulation of protein localization to plasma membrane72/8552104/187239.74e-071.23e-0572
GO:006195114EsophagusESCCestablishment of protein localization to plasma membrane44/855260/187231.25e-051.15e-0444
GO:00324565EsophagusESCCendocytic recycling51/855273/187232.47e-052.10e-0451
GO:00995324EsophagusESCCsynaptic vesicle endosomal processing9/855210/187235.09e-031.92e-029
GO:00995635EsophagusESCCmodification of synaptic structure16/855222/187239.46e-033.28e-0216
GO:003238621LiverHCCregulation of intracellular transport231/7958337/187231.99e-223.40e-20231
GO:003315721LiverHCCregulation of intracellular protein transport165/7958229/187238.37e-201.15e-17165
GO:001619721LiverHCCendosomal transport154/7958230/187234.74e-142.95e-12154
GO:009015012LiverHCCestablishment of protein localization to membrane168/7958260/187234.07e-132.13e-11168
GO:007265921LiverHCCprotein localization to plasma membrane177/7958284/187231.02e-114.18e-10177
Page: 1 2 3 4 5 

check button Enriched KEGG pathways.
Pathway IDTissueDisease StageDescriptionGene RatioBg Ratiopvaluep.adjustqvalueCount
Page: 1 

Top

Cell-cell communication analysis

check buttonIdentification of potential cell-cell interactions between two cell types and their ligand-receptor pairs for different disease states
LigandReceptorLRpairPathwayTissueDisease Stage
Page: 1 

Top

Single-cell gene regulatory network inference analysis

check buttonFind out the significant the regulons (TFs) and the target genes of each regulon across cell types for different disease states
TFCell TypeTissueDisease StageTarget GeneRSSRegulon Activity
∗The dot plots of a searched regulon are shown for all cell subpopulations in each disease state of each tissue based on the regulon specific score inferred using pySCENIC and by calculating the average expression.
Page: 1 

Top

Somatic mutation of malignant transformation related genes

check buttonAnnotation of somatic variants for genes involved in malignant transformation
Hugo SymbolVariant ClassVariant ClassificationdbSNP RSHGVScHGVSpHGVSp ShortSWISSPROTBIOTYPESIFTPolyPhenTumor Sample BarcodeTissueHistologySexAgeStageTherapy TypesDrugsOutcome
GRIPAP1SNVMissense_Mutationnovelc.1667C>Tp.Ala556Valp.A556VQ4V328protein_codingtolerated(0.18)probably_damaging(0.994)TCGA-AN-A046-01Breastbreast invasive carcinomaFemale>=65I/IIUnknownUnknownSD
GRIPAP1SNVMissense_Mutationc.1888N>Ap.Glu630Lysp.E630KQ4V328protein_codingdeleterious(0.02)benign(0.093)TCGA-AN-A0XO-01Breastbreast invasive carcinomaFemale<65III/IVUnknownUnknownSD
GRIPAP1SNVMissense_Mutationc.571N>Ap.Glu191Lysp.E191KQ4V328protein_codingtolerated(0.12)probably_damaging(0.992)TCGA-AO-A0JC-01Breastbreast invasive carcinomaFemale<65I/IIChemotherapyfluorouracilSD
GRIPAP1SNVMissense_Mutationnovelc.2470N>Tp.Ser824Cysp.S824CQ4V328protein_codingdeleterious(0.02)probably_damaging(0.997)TCGA-B6-A0IA-01Breastbreast invasive carcinomaFemale<65I/IIUnknownUnknownSD
GRIPAP1SNVMissense_Mutationc.1067N>Cp.Leu356Prop.L356PQ4V328protein_codingdeleterious(0)probably_damaging(0.999)TCGA-BH-A18G-01Breastbreast invasive carcinomaFemale>=65I/IIUnknownUnknownSD
GRIPAP1SNVMissense_Mutationc.1314N>Ap.Met438Ilep.M438IQ4V328protein_codingtolerated(1)possibly_damaging(0.871)TCGA-D8-A1XB-01Breastbreast invasive carcinomaFemale<65I/IIUnknownUnknownSD
GRIPAP1SNVMissense_Mutationc.1105G>Ap.Glu369Lysp.E369KQ4V328protein_codingtolerated(0.09)possibly_damaging(0.878)TCGA-E2-A10C-01Breastbreast invasive carcinomaFemale<65I/IIChemotherapycytoxanSD
GRIPAP1SNVMissense_Mutationrs782656835c.1364G>Ap.Arg455Hisp.R455HQ4V328protein_codingdeleterious(0.01)probably_damaging(0.997)TCGA-EW-A1PC-01Breastbreast invasive carcinomaFemale>=65I/IIHormone TherapytamoxiphenSD
GRIPAP1SNVMissense_Mutationnovelc.913N>Ap.Glu305Lysp.E305KQ4V328protein_codingtolerated(0.08)possibly_damaging(0.885)TCGA-LD-A7W5-01Breastbreast invasive carcinomaFemale<65III/IVChemotherapytaxotereSD
GRIPAP1SNVMissense_Mutationnovelc.125N>Tp.Arg42Leup.R42LQ4V328protein_codingdeleterious(0)probably_damaging(0.995)TCGA-LL-A5YO-01Breastbreast invasive carcinomaFemale<65I/IIChemotherapytaxotereCR
Page: 1 2 3 4 5 6 7 8 9 10 

Top

Related drugs of malignant transformation related genes

check buttonIdentification of chemicals and drugs interact with genes involved in malignant transfromation
(DGIdb 4.0)
Entrez IDSymbolCategoryInteraction TypesDrug Claim NameDrug NamePMIDs
Page: 1