
|
|||||
|
 | |
| |
| |
| |
| |
| |
|
Gene: GPR89B |
Gene summary for GPR89B |
| Gene information | Species | Human | Gene symbol | GPR89B | Gene ID | 51463 |
| Gene name | G protein-coupled receptor 89B | |
| Gene Alias | GPHR | |
| Cytomap | 1q21.2 | |
| Gene Type | protein-coding | GO ID | GO:0001775 | UniProtAcc | B7ZAQ6 |
Top |
Malignant transformation analysis |
| Identification of the aberrant gene expression in precancerous and cancerous lesions by comparing the gene expression of stem-like cells in diseased tissues with normal stem cells |
| Entrez ID | Symbol | Replicates | Species | Organ | Tissue | Adj P-value | Log2FC | Malignancy |
| 51463 | GPR89B | P57T-E | Human | Esophagus | ESCC | 3.18e-10 | 2.11e-01 | 0.0926 |
| 51463 | GPR89B | P61T-E | Human | Esophagus | ESCC | 2.73e-09 | 2.35e-01 | 0.099 |
| 51463 | GPR89B | P62T-E | Human | Esophagus | ESCC | 4.34e-34 | 6.31e-01 | 0.1302 |
| 51463 | GPR89B | P65T-E | Human | Esophagus | ESCC | 1.04e-13 | 3.22e-01 | 0.0978 |
| 51463 | GPR89B | P74T-E | Human | Esophagus | ESCC | 4.07e-23 | 7.20e-01 | 0.1479 |
| 51463 | GPR89B | P75T-E | Human | Esophagus | ESCC | 1.81e-32 | 6.23e-01 | 0.1125 |
| 51463 | GPR89B | P76T-E | Human | Esophagus | ESCC | 6.01e-17 | 3.61e-01 | 0.1207 |
| 51463 | GPR89B | P79T-E | Human | Esophagus | ESCC | 8.53e-19 | 4.80e-01 | 0.1154 |
| 51463 | GPR89B | P80T-E | Human | Esophagus | ESCC | 3.40e-26 | 7.79e-01 | 0.155 |
| 51463 | GPR89B | P82T-E | Human | Esophagus | ESCC | 9.85e-06 | 3.69e-01 | 0.1072 |
| 51463 | GPR89B | P83T-E | Human | Esophagus | ESCC | 4.00e-19 | 5.68e-01 | 0.1738 |
| 51463 | GPR89B | P84T-E | Human | Esophagus | ESCC | 4.24e-06 | 3.39e-01 | 0.0933 |
| 51463 | GPR89B | P89T-E | Human | Esophagus | ESCC | 1.98e-08 | 5.70e-01 | 0.1752 |
| 51463 | GPR89B | P94T-E | Human | Esophagus | ESCC | 3.04e-02 | 3.13e-01 | 0.0879 |
| 51463 | GPR89B | P107T-E | Human | Esophagus | ESCC | 2.20e-18 | 4.49e-01 | 0.171 |
| 51463 | GPR89B | P126T-E | Human | Esophagus | ESCC | 3.80e-03 | 4.45e-01 | 0.1125 |
| 51463 | GPR89B | P127T-E | Human | Esophagus | ESCC | 1.71e-09 | 2.30e-01 | 0.0826 |
| 51463 | GPR89B | P128T-E | Human | Esophagus | ESCC | 1.85e-25 | 8.44e-01 | 0.1241 |
| 51463 | GPR89B | P130T-E | Human | Esophagus | ESCC | 2.35e-20 | 4.41e-01 | 0.1676 |
| 51463 | GPR89B | RNA-P17T-P17T-2 | Human | Lung | IAC | 4.73e-02 | 3.85e-01 | 0.3371 |
| Page: 1 2 3 4 |
| Tissue | Expression Dynamics | Abbreviation |
| Esophagus | 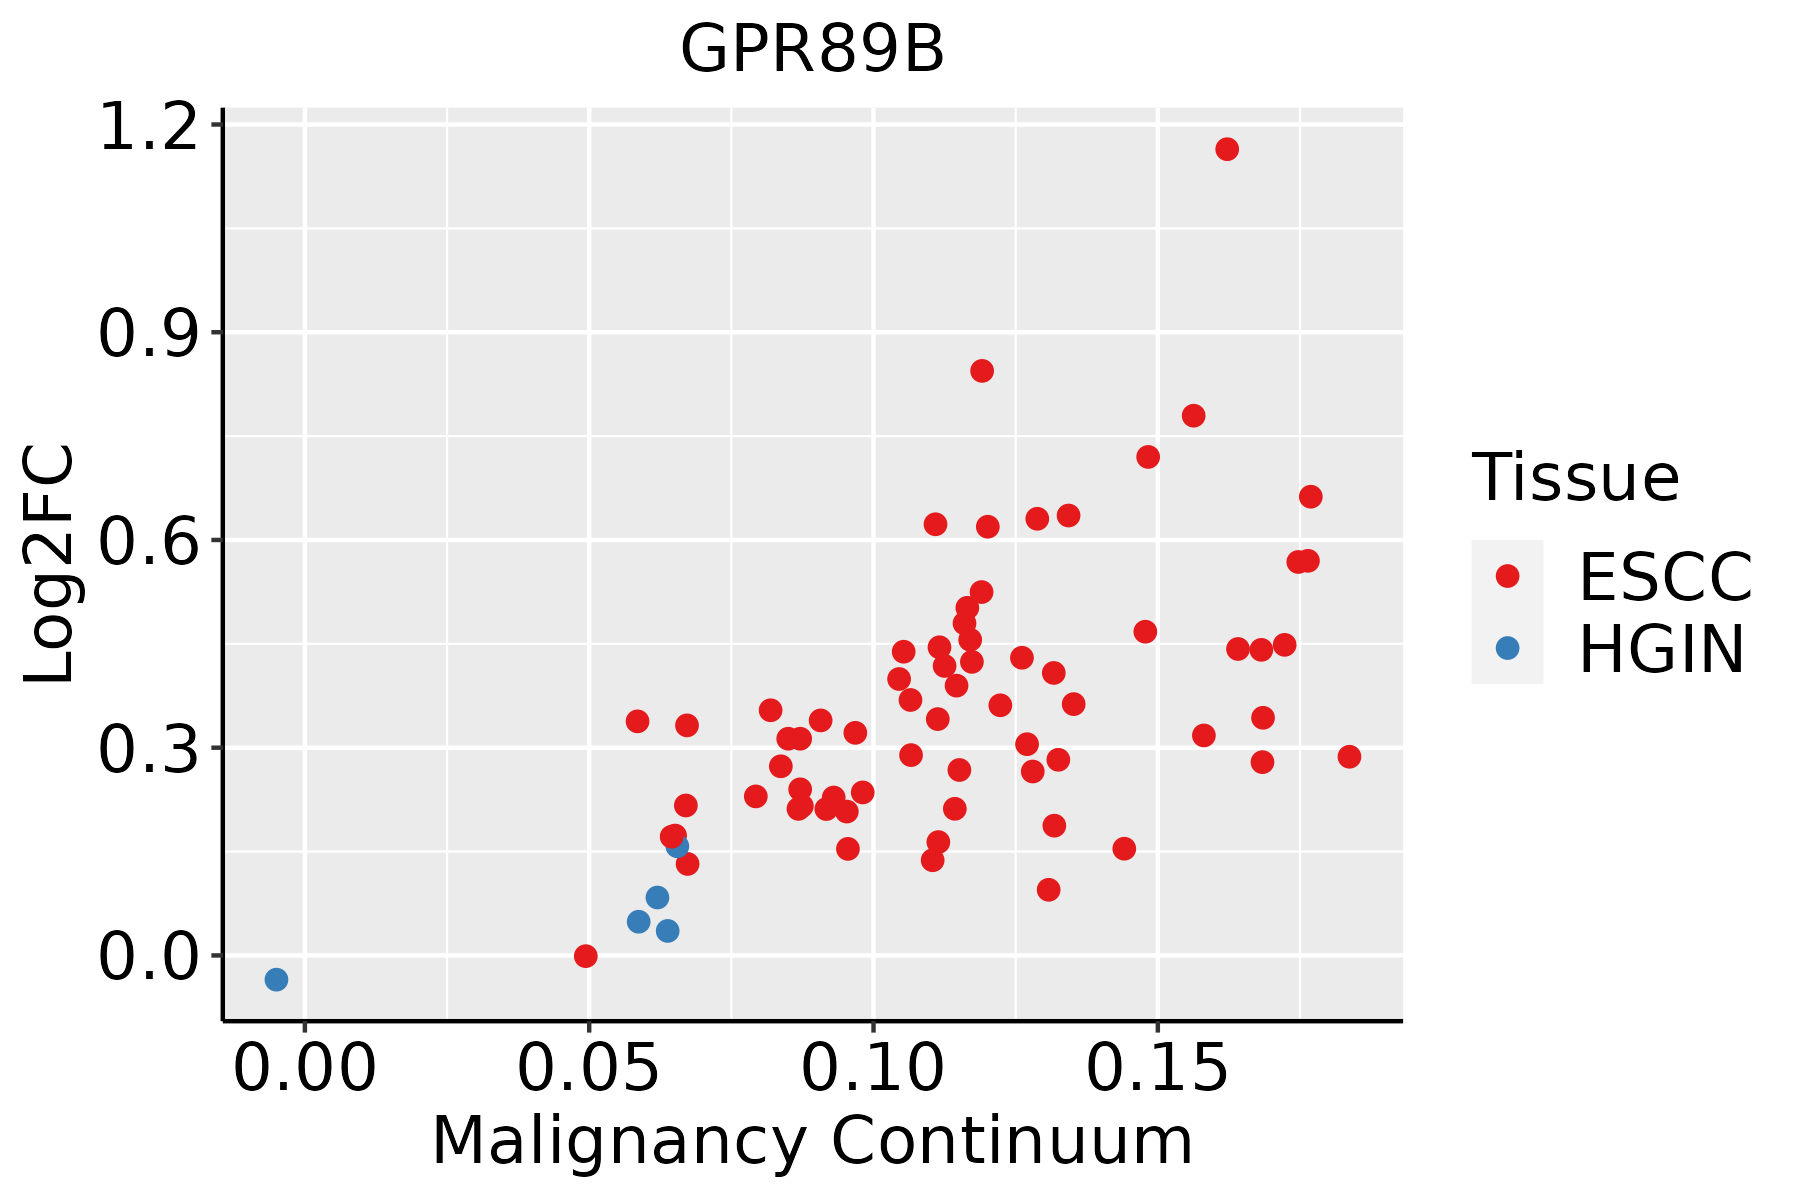 | ESCC: Esophageal squamous cell carcinoma |
| HGIN: High-grade intraepithelial neoplasias | ||
| LGIN: Low-grade intraepithelial neoplasias | ||
| Lung | 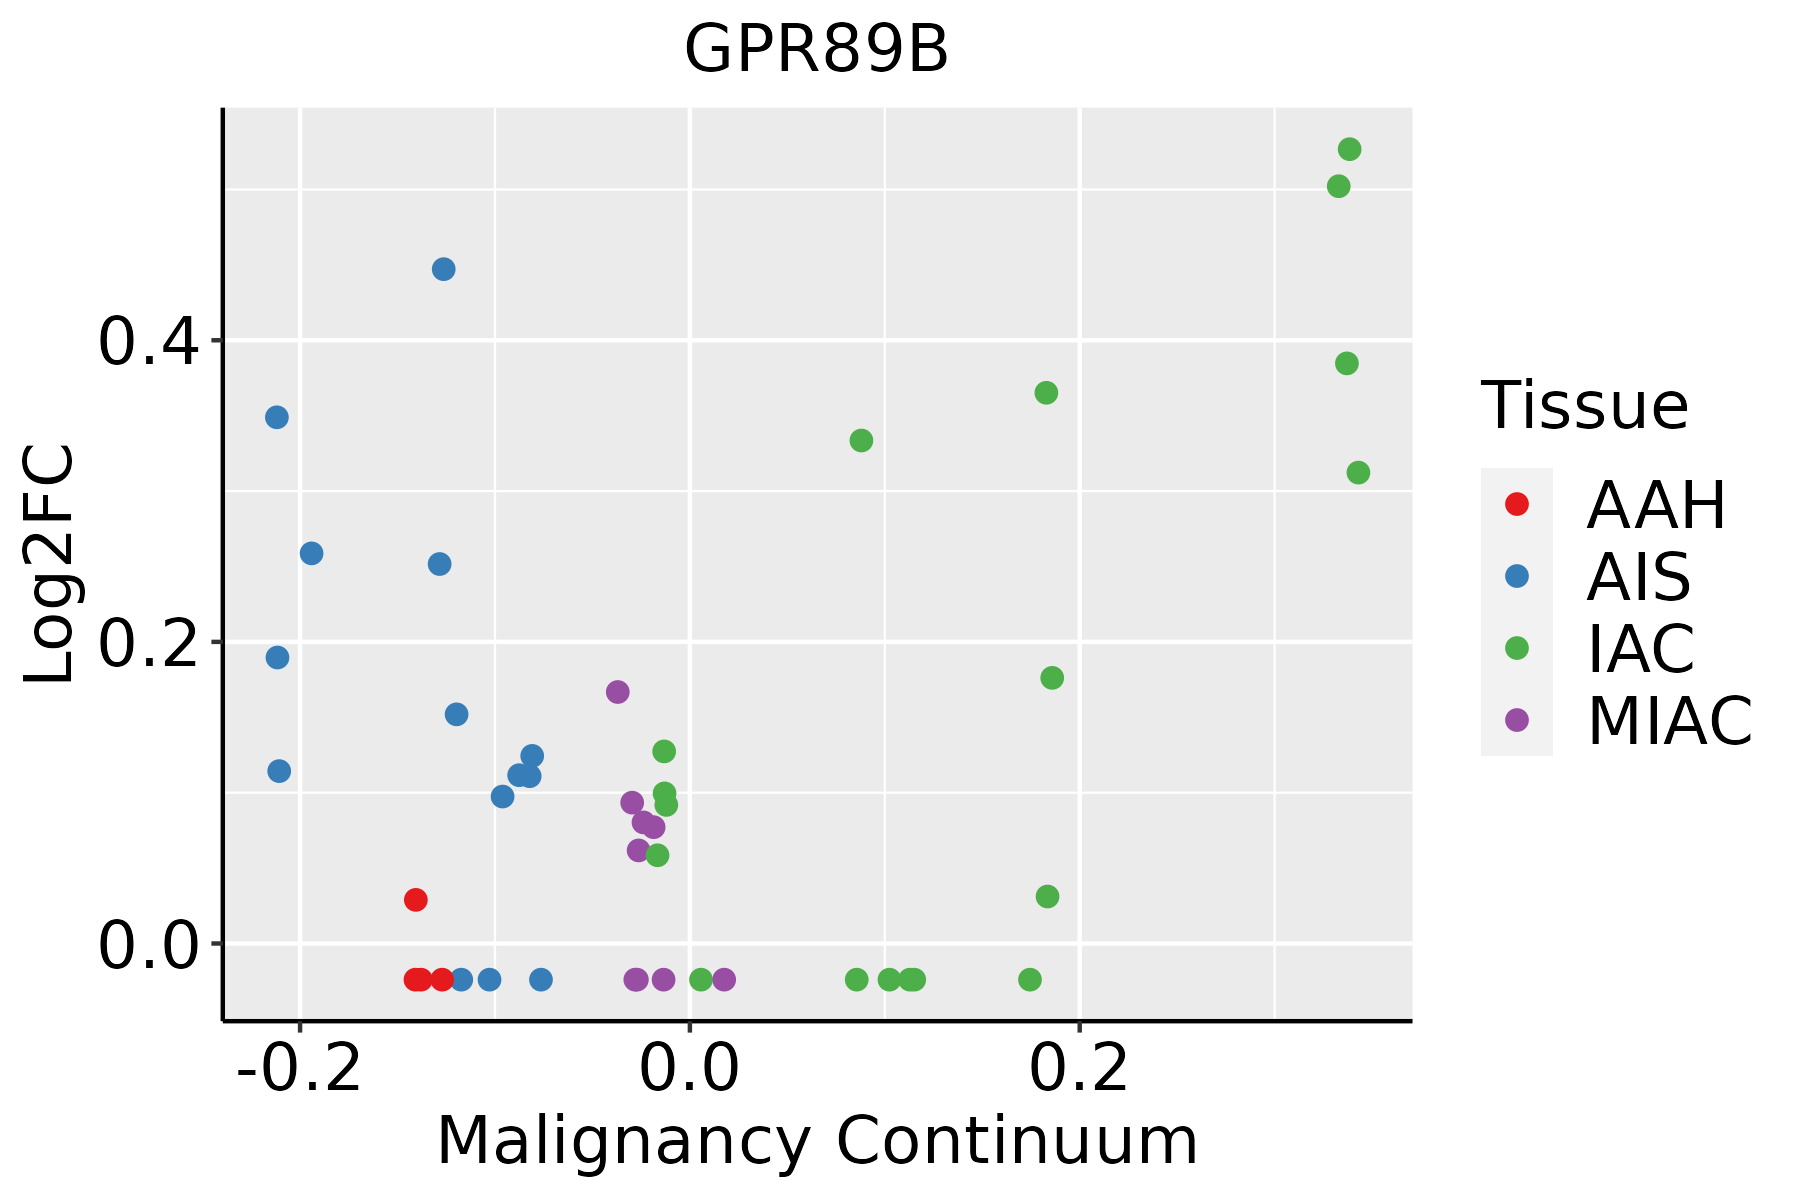 | AAH: Atypical adenomatous hyperplasia |
| AIS: Adenocarcinoma in situ | ||
| IAC: Invasive lung adenocarcinoma | ||
| MIA: Minimally invasive adenocarcinoma |
| ∗log2FC in expression of this searched gene in stem-like cells from each diseased tissue sample relative to stem-like cells in normal samples in each tissue plotted against the malignancy continuum. Samples are colored based on if they are from different disease stage. |
Top |
Malignant transformation related pathway analysis |
| Find out the enriched GO biological processes and KEGG pathways involved in transition from healthy to precancer to cancer |
| Tissue | Disease Stage | Enriched GO biological Processes |
| Colorectum | AD |  |
| Colorectum | SER |  |
| Colorectum | MSS |  |
| Colorectum | MSI-H |  |
| Colorectum | FAP |  |
| ∗Top 15 enriched GO BP terms are showed in the bar plot of each disease state in each tissue. Each row represents a significant GO biological process which is colored according to the -log10(p.adjust). |
| Page: 1 2 3 4 5 6 7 8 9 |
| GO ID | Tissue | Disease Stage | Description | Gene Ratio | Bg Ratio | pvalue | p.adjust | Count |
| GO:004211018 | Esophagus | ESCC | T cell activation | 256/8552 | 487/18723 | 1.18e-03 | 5.87e-03 | 256 |
| GO:19031317 | Esophagus | ESCC | mononuclear cell differentiation | 226/8552 | 426/18723 | 1.20e-03 | 5.88e-03 | 226 |
| GO:00514521 | Esophagus | ESCC | intracellular pH reduction | 29/8552 | 42/18723 | 1.87e-03 | 8.46e-03 | 29 |
| GO:00458511 | Esophagus | ESCC | pH reduction | 31/8552 | 46/18723 | 2.42e-03 | 1.06e-02 | 31 |
| GO:00302176 | Esophagus | ESCC | T cell differentiation | 137/8552 | 257/18723 | 8.09e-03 | 2.87e-02 | 137 |
| GO:00300984 | Esophagus | ESCC | lymphocyte differentiation | 192/8552 | 374/18723 | 1.52e-02 | 4.93e-02 | 192 |
| GO:00421106 | Lung | IAC | T cell activation | 77/2061 | 487/18723 | 6.82e-04 | 9.20e-03 | 77 |
| GO:19031311 | Lung | IAC | mononuclear cell differentiation | 66/2061 | 426/18723 | 2.63e-03 | 2.44e-02 | 66 |
| Page: 1 |
| Pathway ID | Tissue | Disease Stage | Description | Gene Ratio | Bg Ratio | pvalue | p.adjust | qvalue | Count |
| Page: 1 |
Top |
Cell-cell communication analysis |
| Identification of potential cell-cell interactions between two cell types and their ligand-receptor pairs for different disease states |
| Ligand | Receptor | LRpair | Pathway | Tissue | Disease Stage |
| Page: 1 |
Top |
Single-cell gene regulatory network inference analysis |
| Find out the significant the regulons (TFs) and the target genes of each regulon across cell types for different disease states |
| TF | Cell Type | Tissue | Disease Stage | Target Gene | RSS | Regulon Activity |
| ∗The dot plots of a searched regulon are shown for all cell subpopulations in each disease state of each tissue based on the regulon specific score inferred using pySCENIC and by calculating the average expression. |
| Page: 1 |
Top |
Somatic mutation of malignant transformation related genes |
| Annotation of somatic variants for genes involved in malignant transformation |
| Hugo Symbol | Variant Class | Variant Classification | dbSNP RS | HGVSc | HGVSp | HGVSp Short | SWISSPROT | BIOTYPE | SIFT | PolyPhen | Tumor Sample Barcode | Tissue | Histology | Sex | Age | Stage | Therapy Types | Drugs | Outcome |
| GPR89B | SNV | Missense_Mutation | novel | c.1007N>G | p.Val336Gly | p.V336G | P0CG08 | protein_coding | deleterious(0) | probably_damaging(0.977) | TCGA-A2-A0T2-01 | Breast | breast invasive carcinoma | Female | >=65 | III/IV | Chemotherapy | xeloda | PD |
| GPR89B | SNV | Missense_Mutation | novel | c.1007N>G | p.Val336Gly | p.V336G | P0CG08 | protein_coding | deleterious(0) | probably_damaging(0.977) | TCGA-A2-A1G0-01 | Breast | breast invasive carcinoma | Female | <65 | I/II | Chemotherapy | taxotere | SD |
| GPR89B | SNV | Missense_Mutation | novel | c.1009N>G | p.Lys337Glu | p.K337E | P0CG08 | protein_coding | tolerated(0.72) | benign(0.233) | TCGA-A2-A1G0-01 | Breast | breast invasive carcinoma | Female | <65 | I/II | Chemotherapy | taxotere | SD |
| GPR89B | SNV | Missense_Mutation | novel | c.1007T>G | p.Val336Gly | p.V336G | P0CG08 | protein_coding | deleterious(0) | probably_damaging(0.977) | TCGA-A2-A25A-01 | Breast | breast invasive carcinoma | Female | <65 | I/II | Unspecific | Cytoxan | SD |
| GPR89B | SNV | Missense_Mutation | novel | c.1009A>G | p.Lys337Glu | p.K337E | P0CG08 | protein_coding | tolerated(0.72) | benign(0.233) | TCGA-A2-A25A-01 | Breast | breast invasive carcinoma | Female | <65 | I/II | Unspecific | Cytoxan | SD |
| GPR89B | SNV | Missense_Mutation | novel | c.1007T>G | p.Val336Gly | p.V336G | P0CG08 | protein_coding | deleterious(0) | probably_damaging(0.977) | TCGA-A2-A25F-01 | Breast | breast invasive carcinoma | Female | >=65 | I/II | Chemotherapy | taxotere | SD |
| GPR89B | SNV | Missense_Mutation | novel | c.1009A>G | p.Lys337Glu | p.K337E | P0CG08 | protein_coding | tolerated(0.72) | benign(0.233) | TCGA-A2-A25F-01 | Breast | breast invasive carcinoma | Female | >=65 | I/II | Chemotherapy | taxotere | SD |
| GPR89B | SNV | Missense_Mutation | novel | c.935N>A | p.Arg312Gln | p.R312Q | P0CG08 | protein_coding | deleterious(0.02) | probably_damaging(0.998) | TCGA-A8-A09W-01 | Breast | breast invasive carcinoma | Female | >=65 | III/IV | Unknown | Unknown | SD |
| GPR89B | SNV | Missense_Mutation | novel | c.485N>T | p.Ser162Phe | p.S162F | P0CG08 | protein_coding | deleterious(0) | probably_damaging(0.998) | TCGA-A8-A0A4-01 | Breast | breast invasive carcinoma | Female | >=65 | I/II | Hormone Therapy | tamoxiphen | CR |
| GPR89B | SNV | Missense_Mutation | novel | c.1007T>G | p.Val336Gly | p.V336G | P0CG08 | protein_coding | deleterious(0) | probably_damaging(0.977) | TCGA-AO-A1KP-01 | Breast | breast invasive carcinoma | Female | >=65 | I/II | Chemotherapy | fluorouracil | SD |
| Page: 1 2 3 4 5 6 7 |
Top |
Related drugs of malignant transformation related genes |
| Identification of chemicals and drugs interact with genes involved in malignant transfromation |
| (DGIdb 4.0) |
| Entrez ID | Symbol | Category | Interaction Types | Drug Claim Name | Drug Name | PMIDs |
| Page: 1 |

Copyright 2023-Present -The University of Texas Health Science Center at Houston |