
|
|||||
|
 | |
| |
| |
| |
| |
| |
|
Gene: GPA33 |
Gene summary for GPA33 |
| Gene information | Species | Human | Gene symbol | GPA33 | Gene ID | 10223 |
| Gene name | glycoprotein A33 | |
| Gene Alias | A33 | |
| Cytomap | 1q24.1 | |
| Gene Type | protein-coding | GO ID | GO:0005575 | UniProtAcc | Q99795 |
Top |
Malignant transformation analysis |
| Identification of the aberrant gene expression in precancerous and cancerous lesions by comparing the gene expression of stem-like cells in diseased tissues with normal stem cells |
| Entrez ID | Symbol | Replicates | Species | Organ | Tissue | Adj P-value | Log2FC | Malignancy |
| 10223 | GPA33 | A015-C-002 | Human | Colorectum | FAP | 1.01e-07 | -3.37e-01 | -0.0763 |
| 10223 | GPA33 | A001-C-007 | Human | Colorectum | CRC | 4.57e-04 | -4.19e-01 | 0.1899 |
| 10223 | GPA33 | A001-C-203 | Human | Colorectum | FAP | 2.14e-04 | -2.25e-01 | -0.0481 |
| 10223 | GPA33 | A002-C-116 | Human | Colorectum | FAP | 4.18e-19 | -3.61e-01 | -0.0452 |
| 10223 | GPA33 | A014-C-008 | Human | Colorectum | FAP | 2.30e-10 | -4.59e-01 | -0.191 |
| 10223 | GPA33 | A018-E-020 | Human | Colorectum | FAP | 1.56e-14 | -4.09e-01 | -0.2034 |
| 10223 | GPA33 | F034 | Human | Colorectum | FAP | 3.02e-14 | -4.03e-01 | -0.0665 |
| 10223 | GPA33 | F072B | Human | Colorectum | FAP | 2.08e-07 | -3.20e-01 | 0.257 |
| 10223 | GPA33 | CRC-1-8810 | Human | Colorectum | CRC | 2.57e-06 | -3.55e-01 | 0.6257 |
| 10223 | GPA33 | CRC-3-11773 | Human | Colorectum | CRC | 1.12e-18 | -4.65e-01 | 0.2564 |
| 10223 | GPA33 | Pat01-B | Human | Stomach | GC | 5.35e-47 | 8.23e-01 | 0.5754 |
| 10223 | GPA33 | Pat02-B | Human | Stomach | GC | 1.91e-10 | 2.85e-01 | 0.0368 |
| 10223 | GPA33 | Pat03-B | Human | Stomach | GC | 9.96e-32 | 6.74e-01 | 0.3693 |
| 10223 | GPA33 | Pat13-B | Human | Stomach | GC | 6.98e-06 | 2.12e-01 | 0.0555 |
| 10223 | GPA33 | Pat16-B | Human | Stomach | GC | 2.02e-07 | 2.39e-01 | 0.1918 |
| 10223 | GPA33 | Pat17-B | Human | Stomach | GC | 5.43e-16 | 4.57e-01 | 0.3109 |
| 10223 | GPA33 | Pat19-B | Human | Stomach | GC | 7.51e-13 | 3.88e-01 | 0.0826 |
| 10223 | GPA33 | WIM_2 | Human | Stomach | WIM | 8.92e-03 | 2.74e-01 | 0.1159 |
| 10223 | GPA33 | SIM_1 | Human | Stomach | SIM | 8.23e-12 | 4.29e-01 | 0.3573 |
| 10223 | GPA33 | SIM_2 | Human | Stomach | SIM | 4.35e-07 | 3.08e-01 | 0.3139 |
| Page: 1 2 3 4 |
| Tissue | Expression Dynamics | Abbreviation |
| Colorectum (GSE201348) |  | FAP: Familial adenomatous polyposis |
| CRC: Colorectal cancer | ||
| Colorectum (HTA11) |  | AD: Adenomas |
| SER: Sessile serrated lesions | ||
| MSI-H: Microsatellite-high colorectal cancer | ||
| MSS: Microsatellite stable colorectal cancer | ||
| GC | 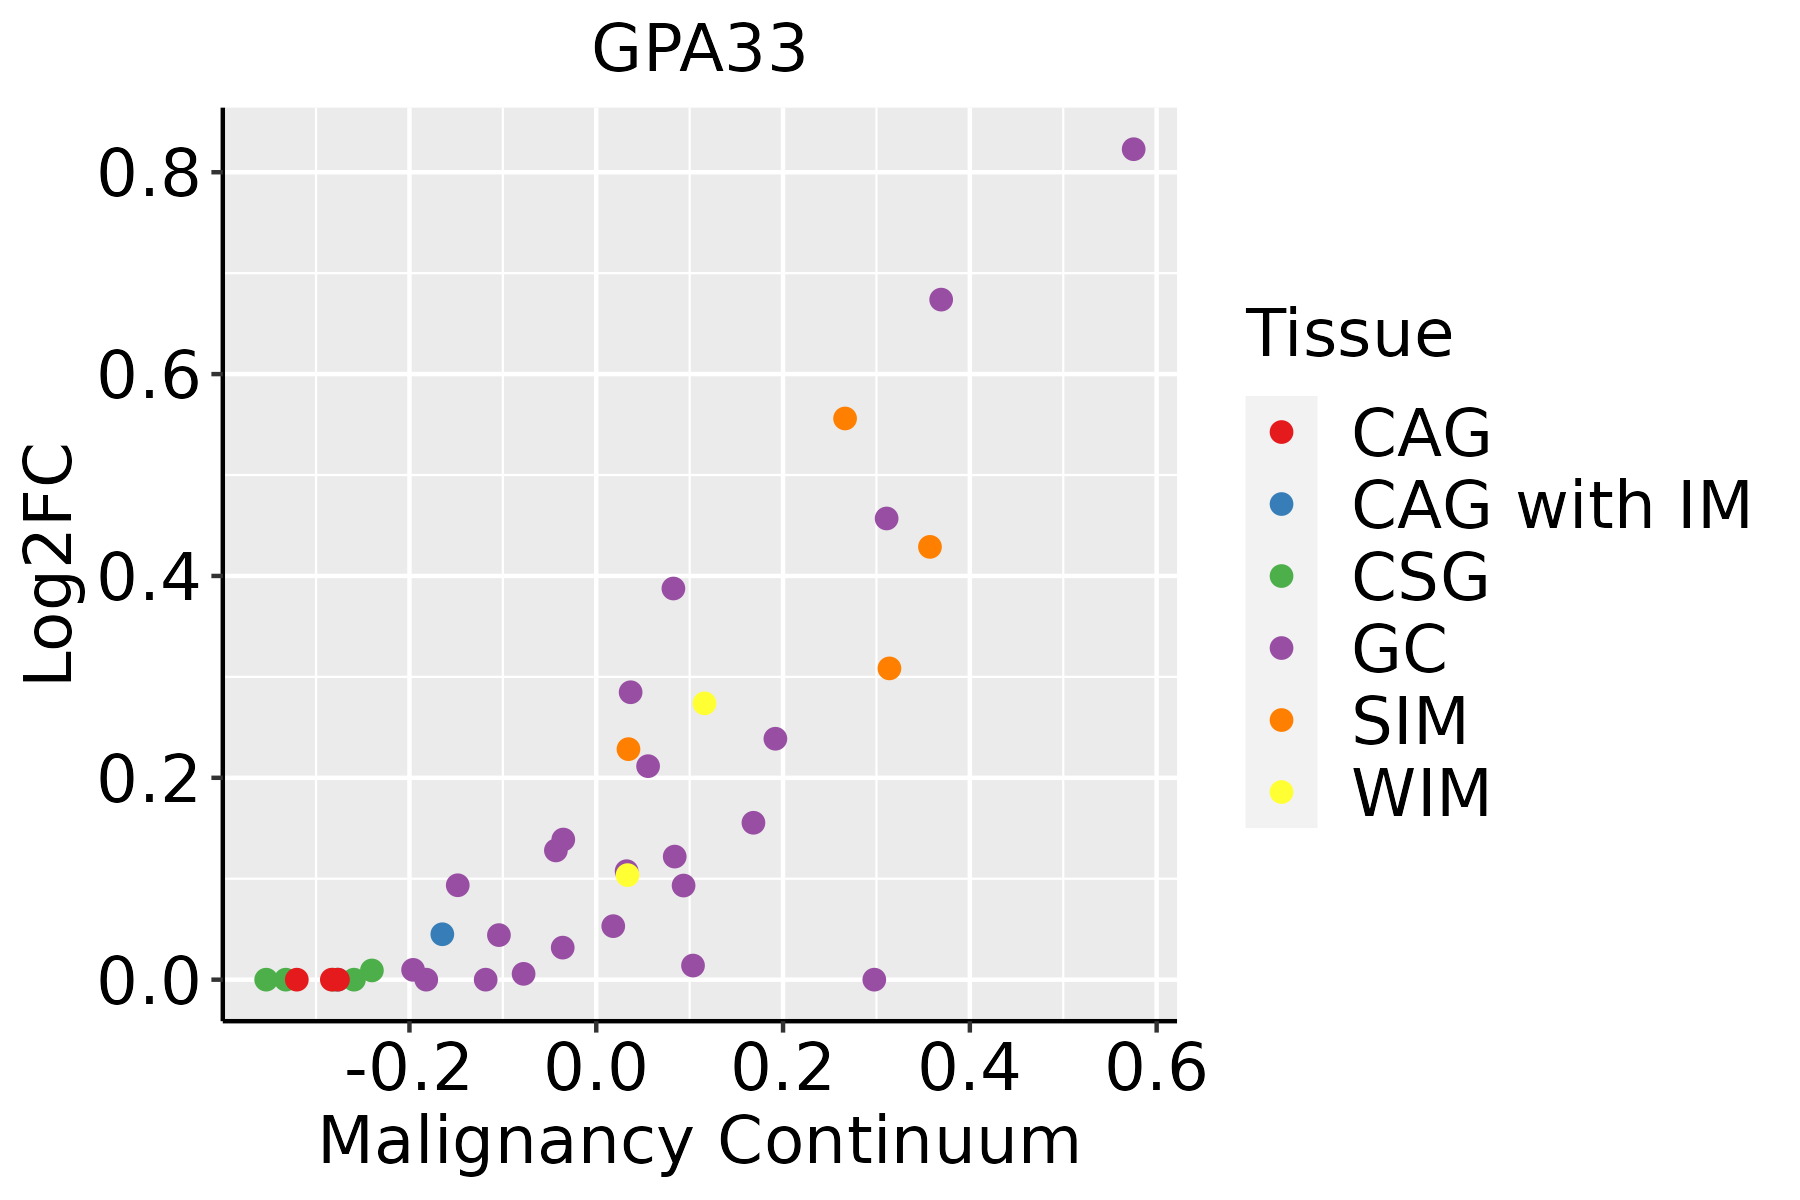 | CAG: Chronic atrophic gastritis |
| CAG with IM: Chronic atrophic gastritis with intestinal metaplasia | ||
| CSG: Chronic superficial gastritis | ||
| GC: Gastric cancer | ||
| SIM: Severe intestinal metaplasia | ||
| WIM: Wild intestinal metaplasia |
| ∗log2FC in expression of this searched gene in stem-like cells from each diseased tissue sample relative to stem-like cells in normal samples in each tissue plotted against the malignancy continuum. Samples are colored based on if they are from different disease stage. |
Top |
Malignant transformation related pathway analysis |
| Find out the enriched GO biological processes and KEGG pathways involved in transition from healthy to precancer to cancer |
| Tissue | Disease Stage | Enriched GO biological Processes |
| Colorectum | AD |  |
| Colorectum | SER |  |
| Colorectum | MSS |  |
| Colorectum | MSI-H |  |
| Colorectum | FAP |  |
| ∗Top 15 enriched GO BP terms are showed in the bar plot of each disease state in each tissue. Each row represents a significant GO biological process which is colored according to the -log10(p.adjust). |
| Page: 1 2 3 4 5 6 7 8 9 |
| GO ID | Tissue | Disease Stage | Description | Gene Ratio | Bg Ratio | pvalue | p.adjust | Count |
| Page: 1 |
| Pathway ID | Tissue | Disease Stage | Description | Gene Ratio | Bg Ratio | pvalue | p.adjust | qvalue | Count |
| Page: 1 |
Top |
Cell-cell communication analysis |
| Identification of potential cell-cell interactions between two cell types and their ligand-receptor pairs for different disease states |
| Ligand | Receptor | LRpair | Pathway | Tissue | Disease Stage |
| Page: 1 |
Top |
Single-cell gene regulatory network inference analysis |
| Find out the significant the regulons (TFs) and the target genes of each regulon across cell types for different disease states |
| TF | Cell Type | Tissue | Disease Stage | Target Gene | RSS | Regulon Activity |
| ∗The dot plots of a searched regulon are shown for all cell subpopulations in each disease state of each tissue based on the regulon specific score inferred using pySCENIC and by calculating the average expression. |
| Page: 1 |
Top |
Somatic mutation of malignant transformation related genes |
| Annotation of somatic variants for genes involved in malignant transformation |
| Hugo Symbol | Variant Class | Variant Classification | dbSNP RS | HGVSc | HGVSp | HGVSp Short | SWISSPROT | BIOTYPE | SIFT | PolyPhen | Tumor Sample Barcode | Tissue | Histology | Sex | Age | Stage | Therapy Types | Drugs | Outcome |
| GPA33 | SNV | Missense_Mutation | rs370661795 | c.793N>A | p.Asp265Asn | p.D265N | Q99795 | protein_coding | tolerated(0.15) | benign(0.007) | TCGA-A2-A0YL-01 | Breast | breast invasive carcinoma | Female | <65 | III/IV | Chemotherapy | cytoxan | SD |
| GPA33 | SNV | Missense_Mutation | c.663N>G | p.Phe221Leu | p.F221L | Q99795 | protein_coding | tolerated(0.09) | benign(0.005) | TCGA-A8-A06Q-01 | Breast | breast invasive carcinoma | Female | <65 | III/IV | Unknown | Unknown | SD | |
| GPA33 | deletion | Frame_Shift_Del | novel | c.559delC | p.Leu187TrpfsTer12 | p.L187Wfs*12 | Q99795 | protein_coding | TCGA-D8-A27V-01 | Breast | breast invasive carcinoma | Female | <65 | I/II | Hormone Therapy | tamoxiphen | SD | ||
| GPA33 | SNV | Missense_Mutation | novel | c.699N>A | p.Met233Ile | p.M233I | Q99795 | protein_coding | deleterious(0.01) | probably_damaging(0.954) | TCGA-EA-A43B-01 | Cervix | cervical & endocervical cancer | Female | <65 | I/II | Chemotherapy | cisplatin | CR |
| GPA33 | SNV | Missense_Mutation | novel | c.500G>A | p.Gly167Asp | p.G167D | Q99795 | protein_coding | deleterious(0) | probably_damaging(1) | TCGA-A6-5665-01 | Colorectum | colon adenocarcinoma | Female | >=65 | I/II | Unknown | Unknown | PD |
| GPA33 | SNV | Missense_Mutation | c.781N>C | p.Cys261Arg | p.C261R | Q99795 | protein_coding | deleterious(0) | benign(0.387) | TCGA-CK-6746-01 | Colorectum | colon adenocarcinoma | Female | >=65 | I/II | Unknown | Unknown | SD | |
| GPA33 | SNV | Missense_Mutation | c.767N>C | p.Ile256Thr | p.I256T | Q99795 | protein_coding | deleterious(0.04) | benign(0.037) | TCGA-A5-A0GA-01 | Endometrium | uterine corpus endometrioid carcinoma | Female | >=65 | III/IV | Chemotherapy | taxol | PD | |
| GPA33 | SNV | Missense_Mutation | novel | c.634A>G | p.Thr212Ala | p.T212A | Q99795 | protein_coding | deleterious(0.05) | benign(0.187) | TCGA-A5-A1OF-01 | Endometrium | uterine corpus endometrioid carcinoma | Female | <65 | I/II | Unknown | Unknown | SD |
| GPA33 | SNV | Missense_Mutation | rs540996886 | c.674N>T | p.Thr225Met | p.T225M | Q99795 | protein_coding | deleterious(0) | probably_damaging(0.996) | TCGA-A5-A2K3-01 | Endometrium | uterine corpus endometrioid carcinoma | Female | >=65 | I/II | Chemotherapy | carboplatin | SD |
| GPA33 | SNV | Missense_Mutation | novel | c.213N>G | p.Ile71Met | p.I71M | Q99795 | protein_coding | deleterious(0.02) | possibly_damaging(0.715) | TCGA-AJ-A3QS-01 | Endometrium | uterine corpus endometrioid carcinoma | Female | <65 | III/IV | Chemotherapy | cisplatin | CR |
| Page: 1 2 3 4 5 |
Top |
Related drugs of malignant transformation related genes |
| Identification of chemicals and drugs interact with genes involved in malignant transfromation |
| (DGIdb 4.0) |
| Entrez ID | Symbol | Category | Interaction Types | Drug Claim Name | Drug Name | PMIDs |
| 10223 | GPA33 | DRUGGABLE GENOME | MGD007 | MGD-007 | ||
| 10223 | GPA33 | DRUGGABLE GENOME | KRN-330 | KRN-330 | ||
| 10223 | GPA33 | DRUGGABLE GENOME | HuA33 | HUA33 | ||
| 10223 | GPA33 | DRUGGABLE GENOME | Radiolabelled-huA33 | |||
| 10223 | GPA33 | DRUGGABLE GENOME | KRN-330 | KRN-330 |
| Page: 1 |

Copyright 2023-Present -The University of Texas Health Science Center at Houston |