Schematic overview of the cellular and molecular mechanisms involved in the cancer progression, including the proposed cellular and molecular mechanisms in cancer cells trajectory. AT1: alveolar type 1 cells; AT2: alveolar type 2 cells; AAH: atypical adenomatous hyperplasia; AIS: adenocarcinoma in situ; MIA: minimally invasive adenocarcinoma; IA: invasive adenocarcinoma; EMT: epithelial-mesenchymal transition

Home

Download

Statistics

Help

Contact

Center for Computational Systems Medicine
leaf

Gene summary

leaf

Malignant transformation analysis

leaf

Malignant transformation related pathway analysis

leaf

Cell-cell communication analysis

leaf

Single-cell gene regulatory network inference analysis

leaf

Somatic mutation of malignant transformation related genes

leaf

Related drugs of malignant transformation related genes

Gene: GMPPA

Gene summary for GMPPA

check button Gene summary.

Gene informationSpeciesHuman
Gene symbol

GMPPA

Gene ID

29926

Gene nameGDP-mannose pyrophosphorylase A
Gene AliasAAMR
Cytomap2q35
Gene Typeprotein-coding
GO ID

GO:0008150

UniProtAcc

A0A024R482


Top

Malignant transformation analysis

check button Identification of the aberrant gene expression in precancerous and cancerous lesions by comparing the gene expression of stem-like cells in diseased tissues with normal stem cells
check button Malignant transformation involving gene list.
Entrez IDSymbolReplicatesSpeciesOrganTissueAdj P-valueLog2FCMalignancy
29926GMPPAP32T-EHumanEsophagusESCC1.16e-437.37e-010.1666
29926GMPPAP36T-EHumanEsophagusESCC4.59e-112.37e-010.1187
29926GMPPAP37T-EHumanEsophagusESCC4.00e-213.74e-010.1371
29926GMPPAP38T-EHumanEsophagusESCC4.20e-041.59e-010.127
29926GMPPAP39T-EHumanEsophagusESCC4.80e-061.03e-010.0894
29926GMPPAP40T-EHumanEsophagusESCC7.57e-081.95e-010.109
29926GMPPAP42T-EHumanEsophagusESCC9.28e-133.18e-010.1175
29926GMPPAP44T-EHumanEsophagusESCC8.37e-133.34e-010.1096
29926GMPPAP47T-EHumanEsophagusESCC7.81e-102.15e-010.1067
29926GMPPAP48T-EHumanEsophagusESCC1.70e-071.05e-010.0959
29926GMPPAP49T-EHumanEsophagusESCC5.33e-149.92e-010.1768
29926GMPPAP52T-EHumanEsophagusESCC4.92e-214.92e-010.1555
29926GMPPAP54T-EHumanEsophagusESCC1.25e-102.59e-010.0975
29926GMPPAP56T-EHumanEsophagusESCC8.14e-087.84e-010.1613
29926GMPPAP57T-EHumanEsophagusESCC1.97e-142.78e-010.0926
29926GMPPAP61T-EHumanEsophagusESCC2.44e-204.29e-010.099
29926GMPPAP62T-EHumanEsophagusESCC5.90e-436.29e-010.1302
29926GMPPAP65T-EHumanEsophagusESCC8.48e-214.21e-010.0978
29926GMPPAP74T-EHumanEsophagusESCC1.62e-286.61e-010.1479
29926GMPPAP75T-EHumanEsophagusESCC1.97e-275.02e-010.1125
Page: 1 2 3 4 5 6 7 

check button Transcriptomic changes along malignancy continuum.
TissueExpression DynamicsAbbreviation
Colorectum (GSE201348)The image shows the transcriptomic changes along malignancy continuum.log2FC in expression of this searched gene in stem-like cells from each diseased tissue sample relative to stem-like cells in normal samples in each tissue plotted against the malignancy continuum. Samples are colored based on if they are from different disease stage.
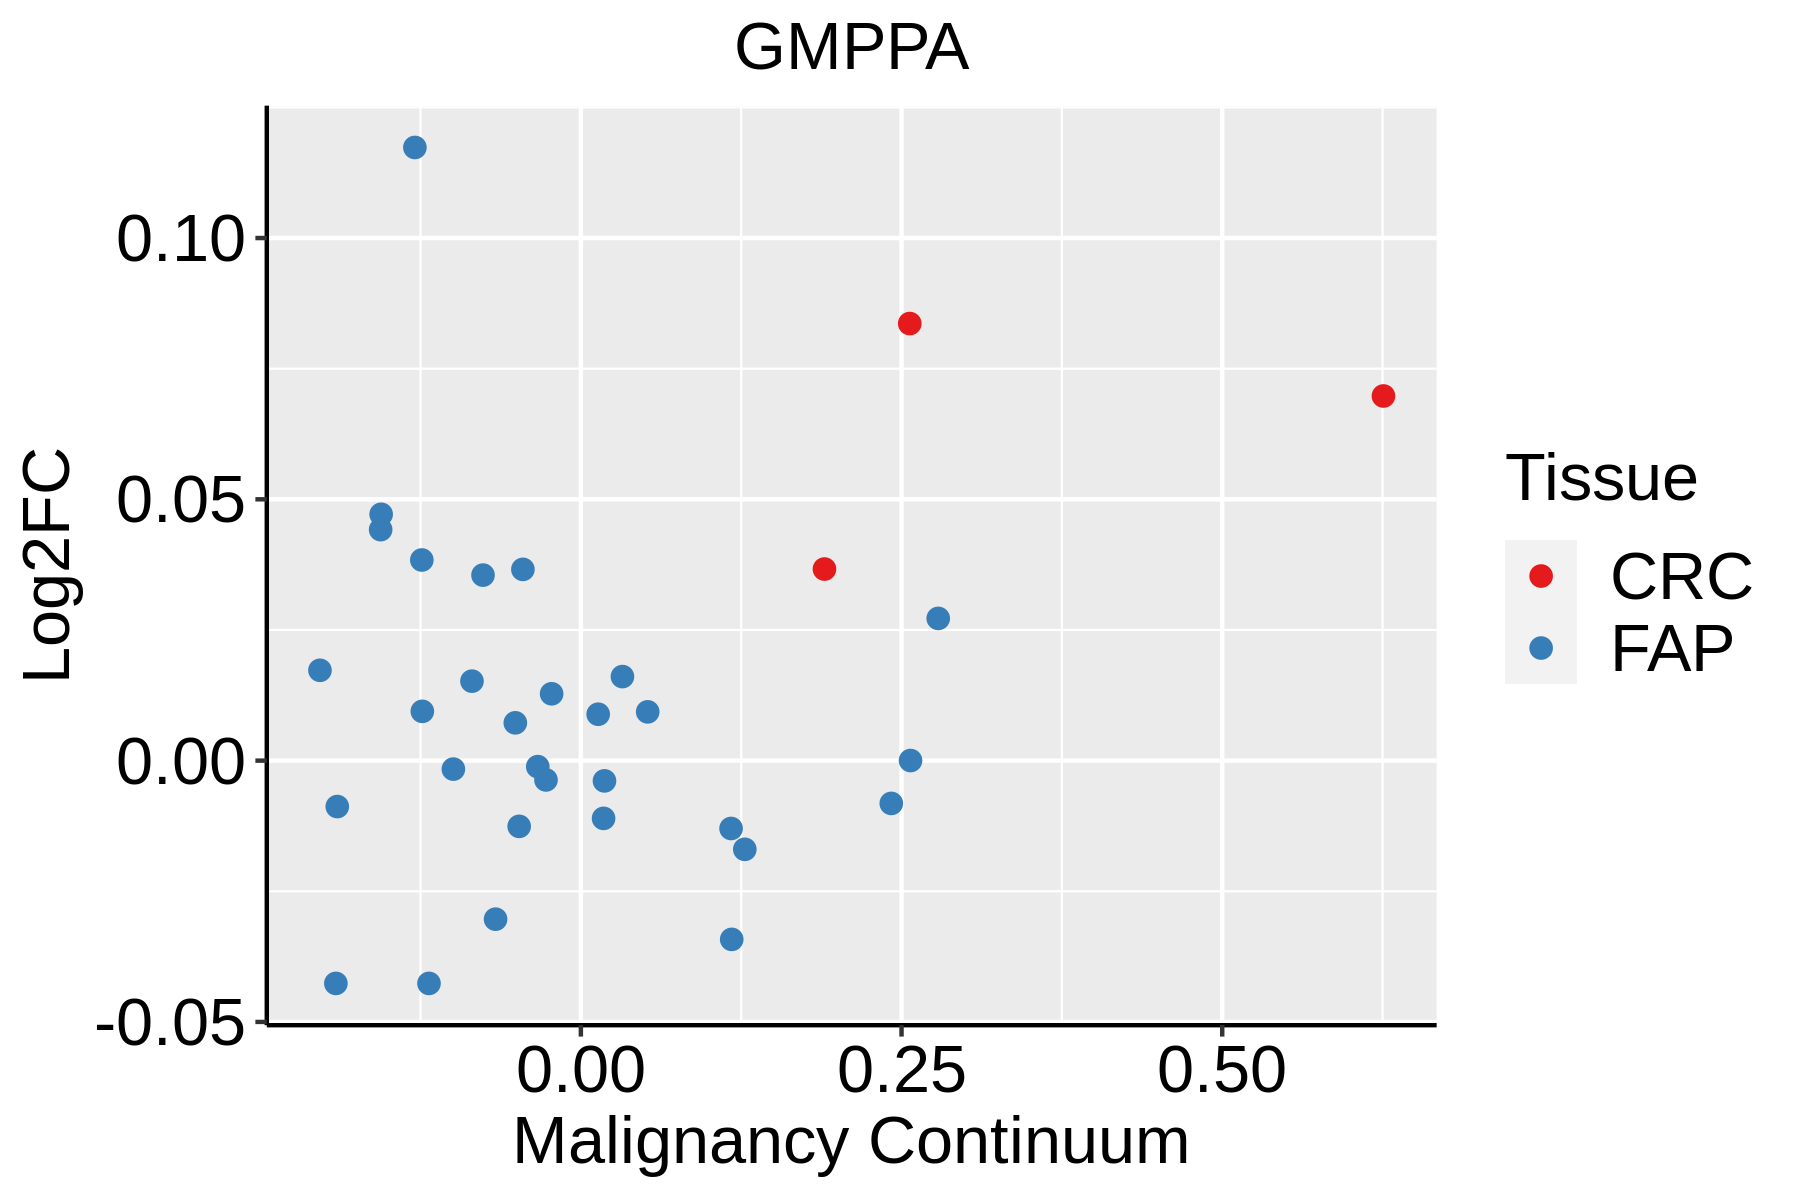
FAP: Familial adenomatous polyposis
CRC: Colorectal cancer
Colorectum (HTA11)The image shows the transcriptomic changes along malignancy continuum.log2FC in expression of this searched gene in stem-like cells from each diseased tissue sample relative to stem-like cells in normal samples in each tissue plotted against the malignancy continuum. Samples are colored based on if they are from different disease stage.AD: Adenomas
SER: Sessile serrated lesions
MSI-H: Microsatellite-high colorectal cancer
MSS: Microsatellite stable colorectal cancer
EsophagusThe image shows the transcriptomic changes along malignancy continuum.log2FC in expression of this searched gene in stem-like cells from each diseased tissue sample relative to stem-like cells in normal samples in each tissue plotted against the malignancy continuum. Samples are colored based on if they are from different disease stage.
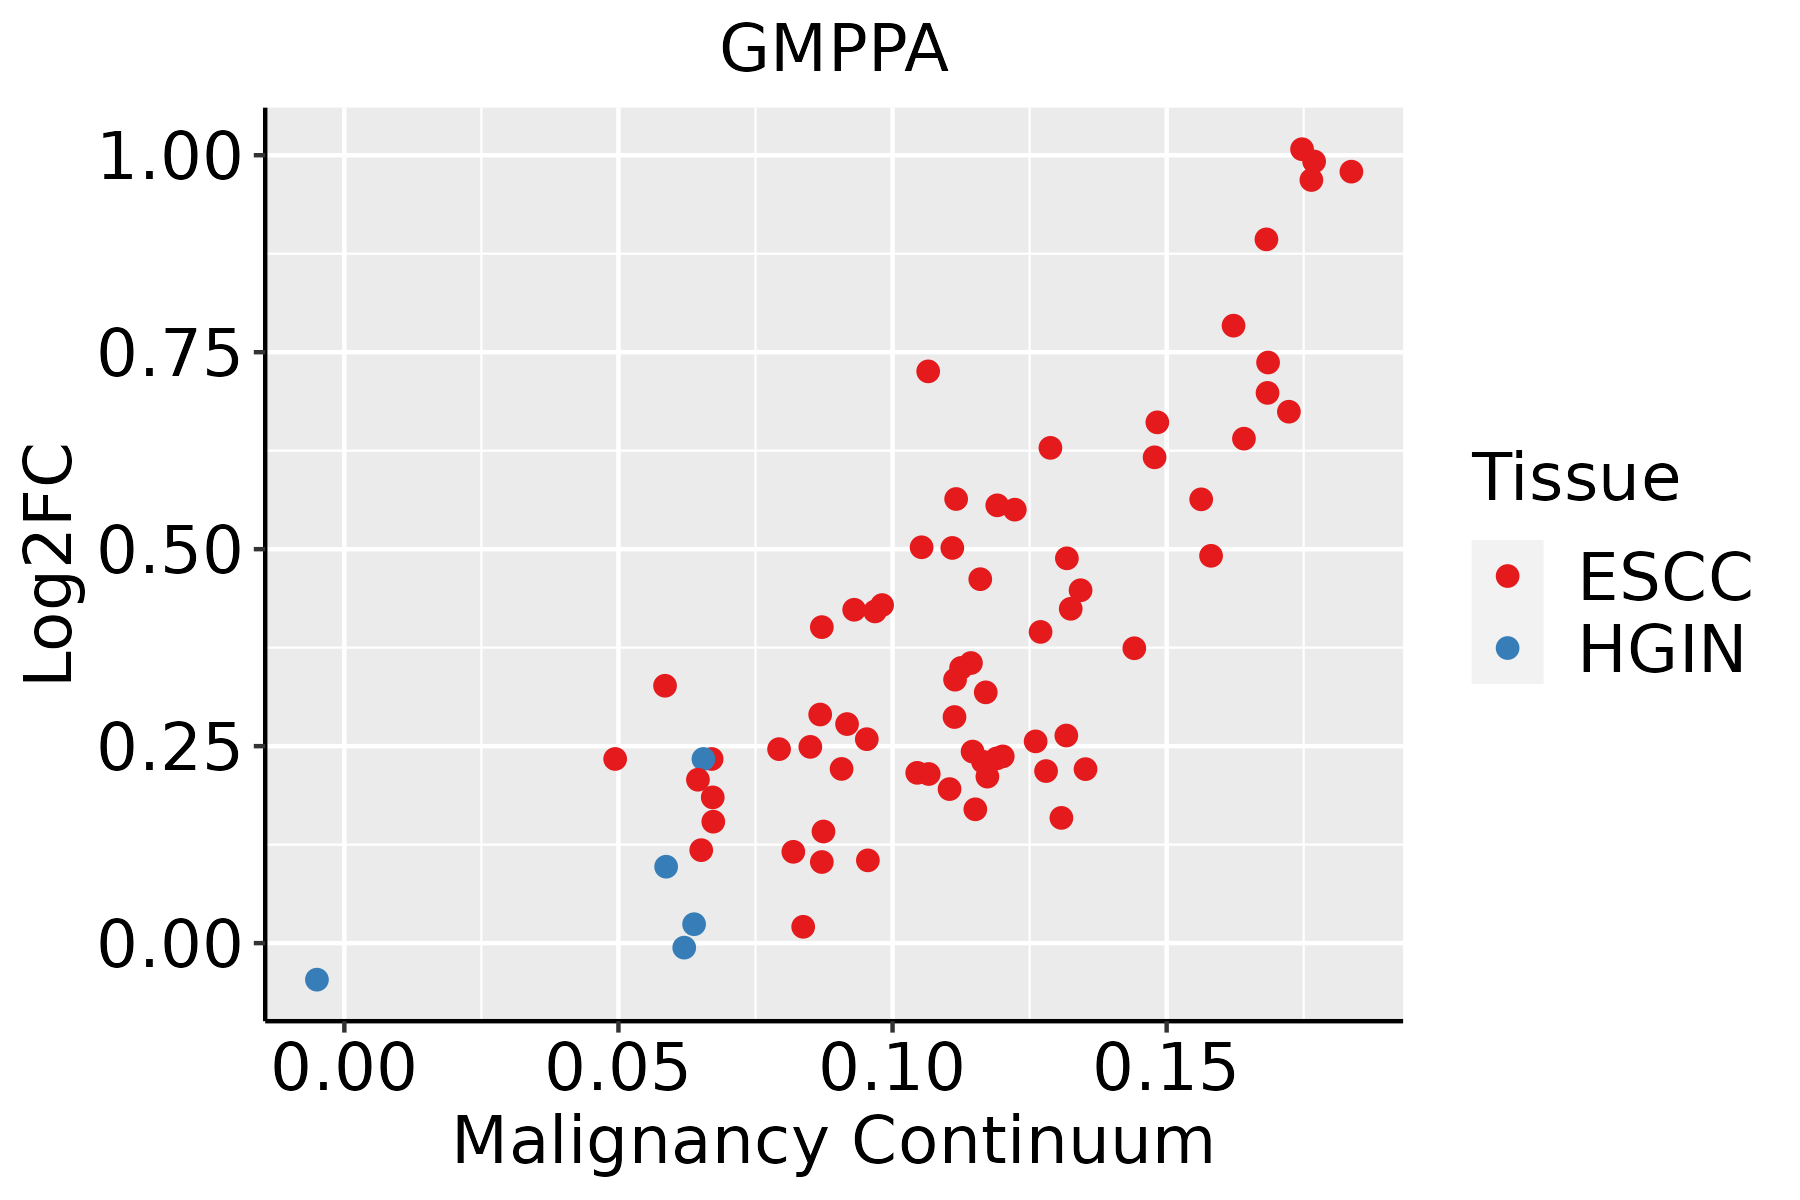
ESCC: Esophageal squamous cell carcinoma
HGIN: High-grade intraepithelial neoplasias
LGIN: Low-grade intraepithelial neoplasias
LiverThe image shows the transcriptomic changes along malignancy continuum.log2FC in expression of this searched gene in stem-like cells from each diseased tissue sample relative to stem-like cells in normal samples in each tissue plotted against the malignancy continuum. Samples are colored based on if they are from different disease stage.HCC: Hepatocellular carcinoma
NAFLD: Non-alcoholic fatty liver disease
Oral CavityThe image shows the transcriptomic changes along malignancy continuum.log2FC in expression of this searched gene in stem-like cells from each diseased tissue sample relative to stem-like cells in normal samples in each tissue plotted against the malignancy continuum. Samples are colored based on if they are from different disease stage.
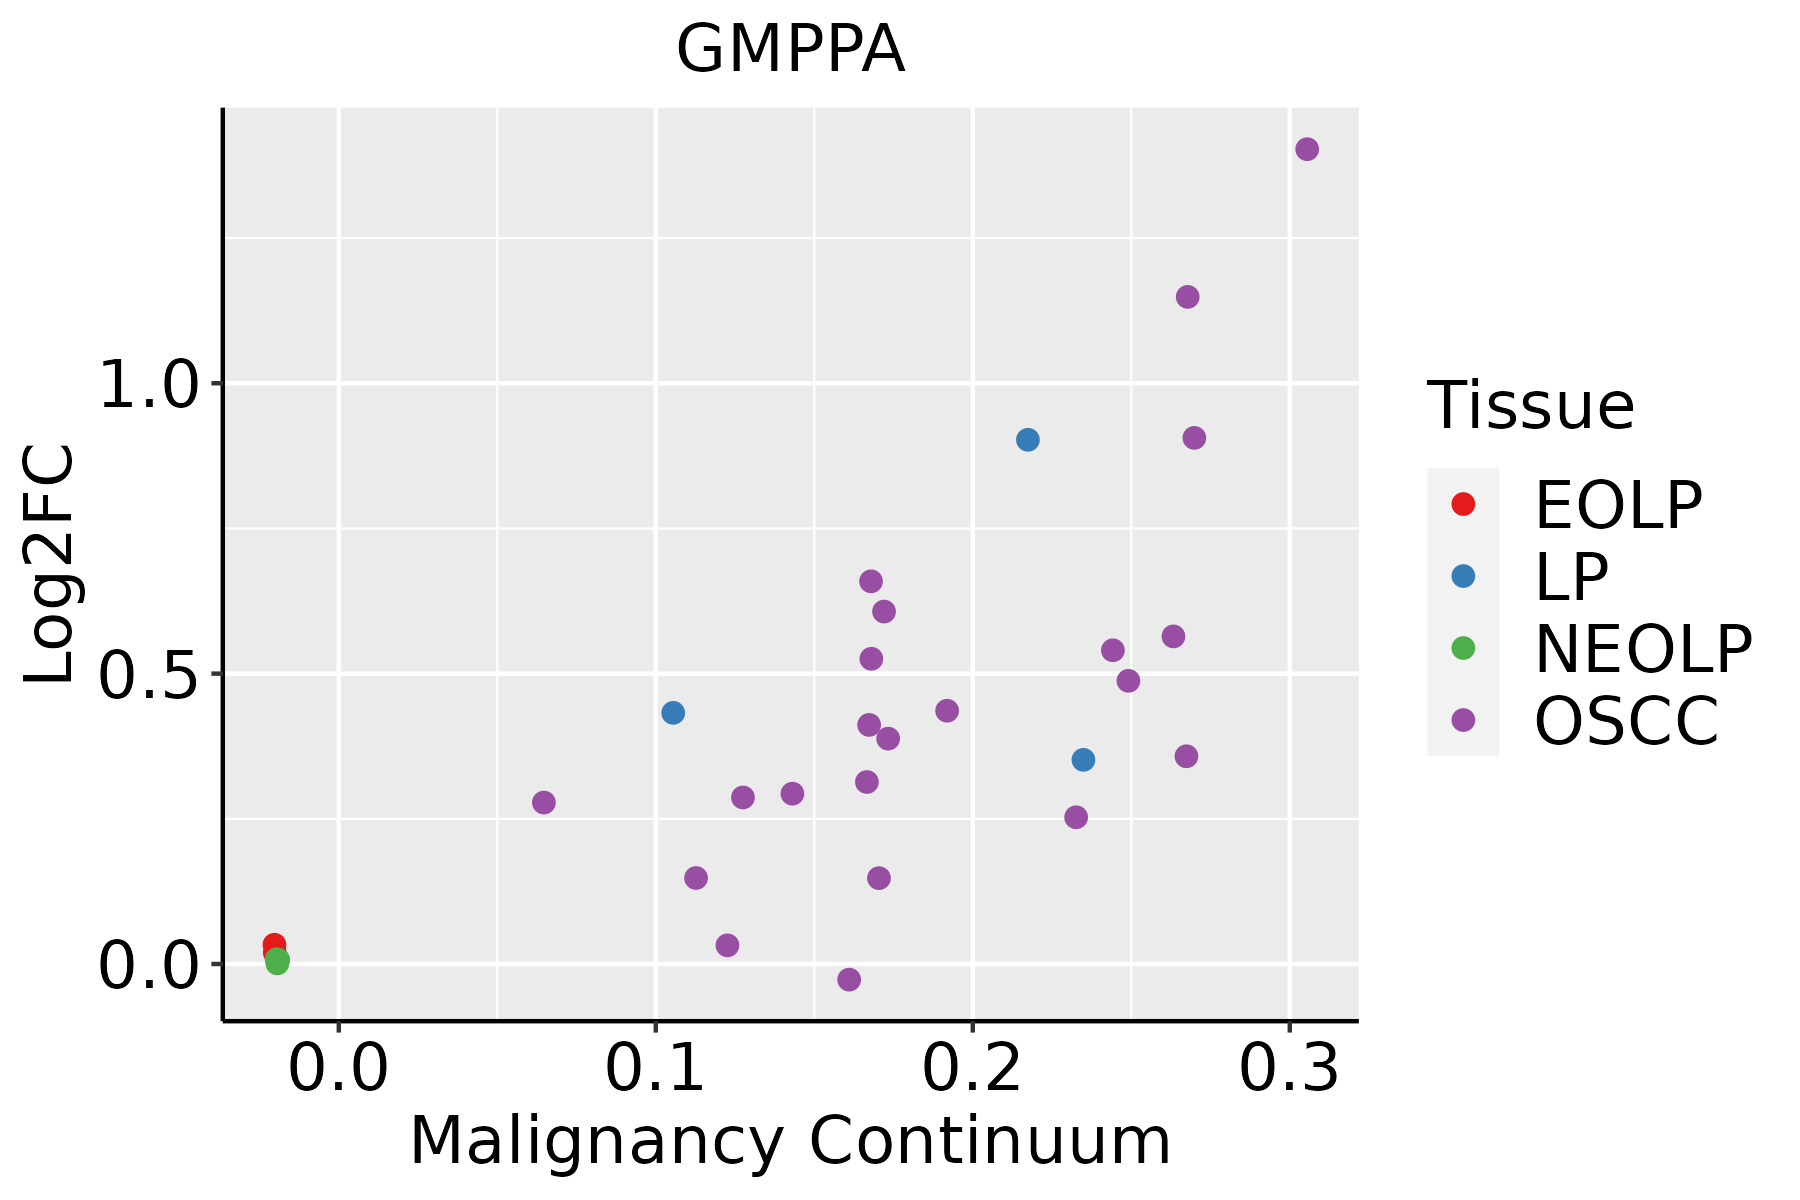
EOLP: Erosive Oral lichen planus
LP: leukoplakia
NEOLP: Non-erosive oral lichen planus
OSCC: Oral squamous cell carcinoma
SkinThe image shows the transcriptomic changes along malignancy continuum.log2FC in expression of this searched gene in stem-like cells from each diseased tissue sample relative to stem-like cells in normal samples in each tissue plotted against the malignancy continuum. Samples are colored based on if they are from different disease stage.
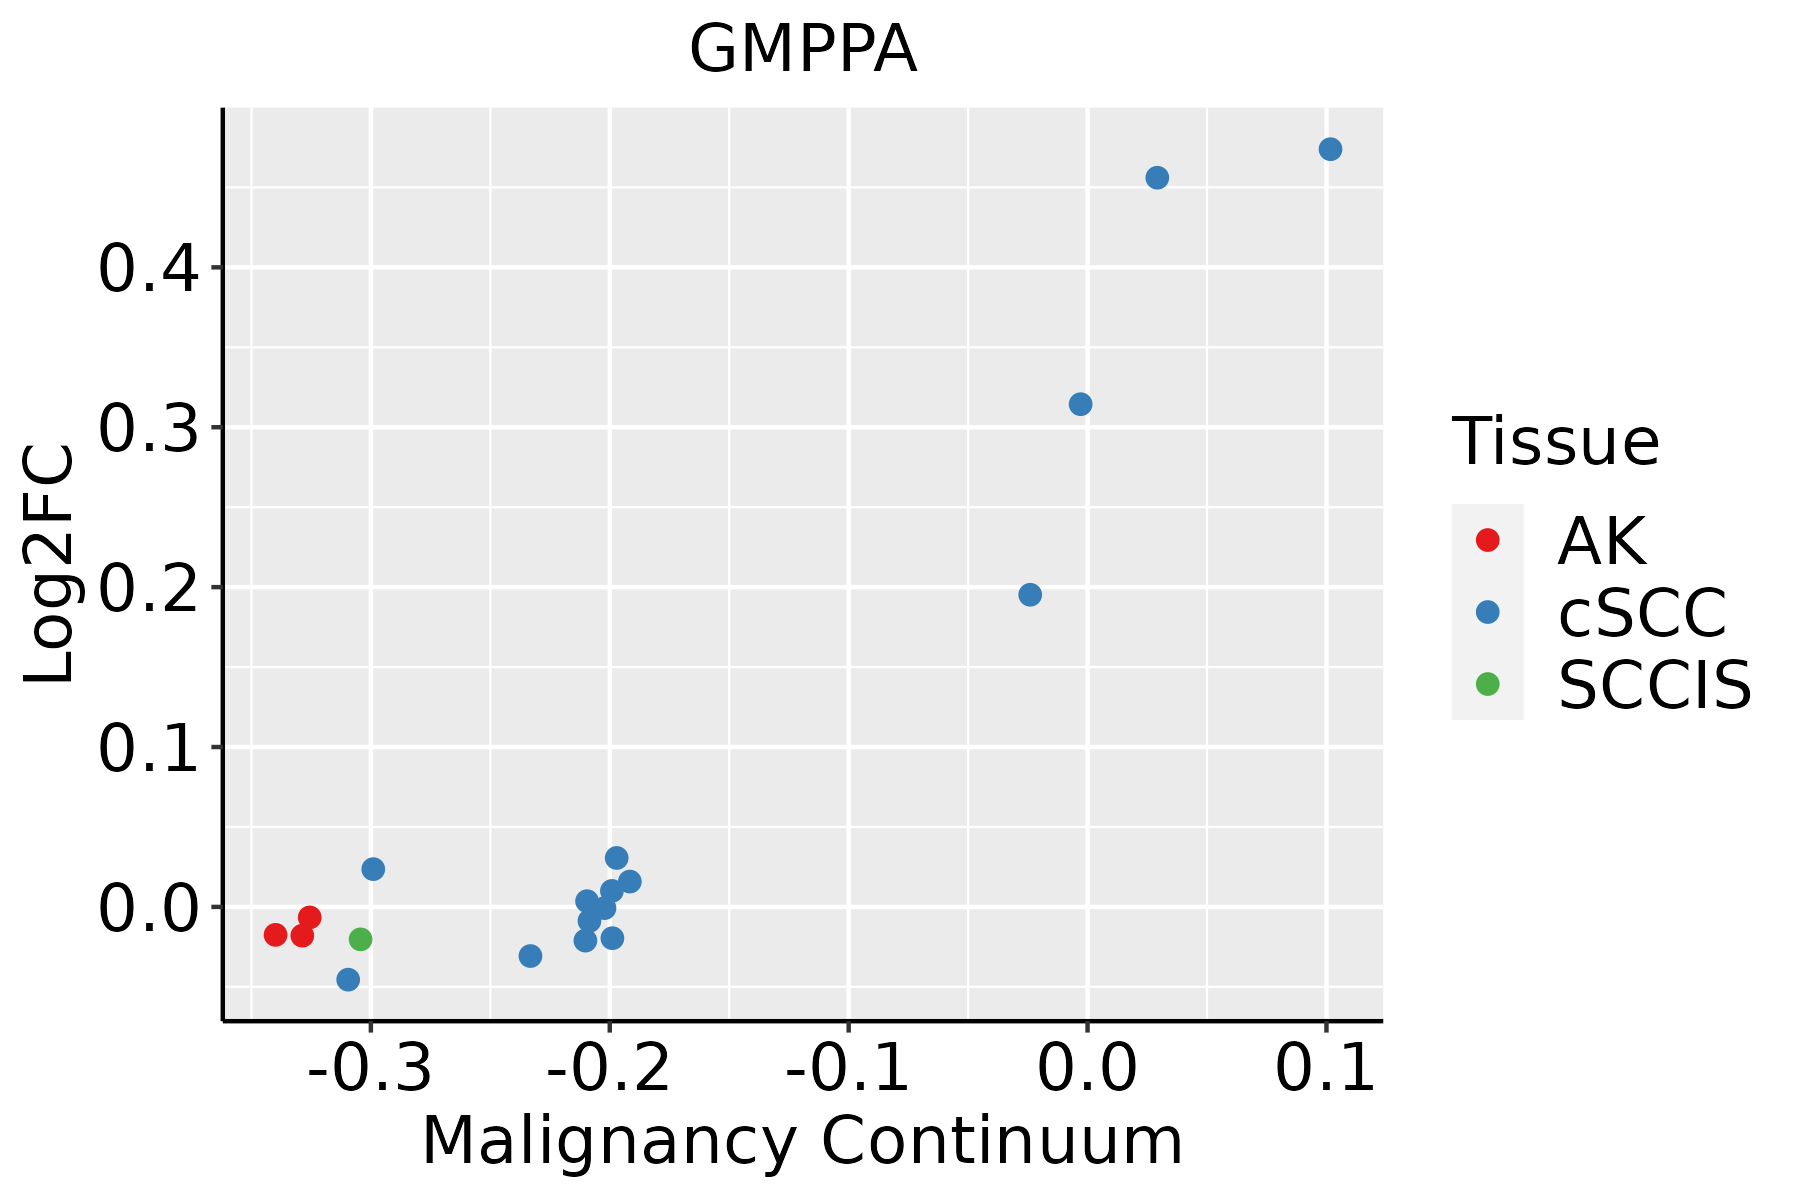
AK: Actinic keratosis
cSCC: Cutaneous squamous cell carcinoma
SCCIS:squamous cell carcinoma in situ
ThyroidThe image shows the transcriptomic changes along malignancy continuum.log2FC in expression of this searched gene in stem-like cells from each diseased tissue sample relative to stem-like cells in normal samples in each tissue plotted against the malignancy continuum. Samples are colored based on if they are from different disease stage.ATC: Anaplastic thyroid cancer
HT: Hashimoto's thyroiditis
PTC: Papillary thyroid cancer
∗log2FC in expression of this searched gene in stem-like cells from each diseased tissue sample relative to stem-like cells in normal samples in each tissue plotted against the malignancy continuum. Samples are colored based on if they are from different disease stage.

Top

Malignant transformation related pathway analysis

check buttonFind out the enriched GO biological processes and KEGG pathways involved in transition from healthy to precancer to cancer
check button Figure of enriched GO biological processes.
TissueDisease StageEnriched GO biological Processes
ColorectumADGO analysis - Figure of enriched GO biological processes: Top 15 enriched GO BP terms are showed in the bar plot of each disease state in each tissue. Each row represents a significant GO biological process which is colored according to the -log10(p.adjust).
ColorectumSERGO analysis - Figure of enriched GO biological processes: Top 15 enriched GO BP terms are showed in the bar plot of each disease state in each tissue. Each row represents a significant GO biological process which is colored according to the -log10(p.adjust).
ColorectumMSSGO analysis - Figure of enriched GO biological processes: Top 15 enriched GO BP terms are showed in the bar plot of each disease state in each tissue. Each row represents a significant GO biological process which is colored according to the -log10(p.adjust).
ColorectumMSI-HGO analysis - Figure of enriched GO biological processes: Top 15 enriched GO BP terms are showed in the bar plot of each disease state in each tissue. Each row represents a significant GO biological process which is colored according to the -log10(p.adjust).
ColorectumFAPGO analysis - Figure of enriched GO biological processes: Top 15 enriched GO BP terms are showed in the bar plot of each disease state in each tissue. Each row represents a significant GO biological process which is colored according to the -log10(p.adjust).
∗Top 15 enriched GO BP terms are showed in the bar plot of each disease state in each tissue. Each row represents a significant GO biological process which is colored according to the -log10(p.adjust).
Page: 1 2 3 4 5 6 7 8 9 

check button Enriched GO biological processes.
GO IDTissueDisease StageDescriptionGene RatioBg Ratiopvaluep.adjustCount
Page: 1 

check button Enriched KEGG pathways.
Pathway IDTissueDisease StageDescriptionGene RatioBg Ratiopvaluep.adjustqvalueCount
hsa00051ColorectumADFructose and mannose metabolism17/209234/84651.25e-038.02e-035.12e-0317
hsa000511ColorectumADFructose and mannose metabolism17/209234/84651.25e-038.02e-035.12e-0317
hsa012405EsophagusESCCBiosynthesis of cofactors97/4205153/84653.88e-041.35e-036.94e-0497
hsa012505EsophagusESCCBiosynthesis of nucleotide sugars28/420537/84651.10e-033.42e-031.75e-0328
hsa005202EsophagusESCCAmino sugar and nucleotide sugar metabolism35/420549/84651.60e-034.88e-032.50e-0335
hsa000512EsophagusESCCFructose and mannose metabolism24/420534/84651.09e-022.51e-021.29e-0224
hsa0124012EsophagusESCCBiosynthesis of cofactors97/4205153/84653.88e-041.35e-036.94e-0497
hsa0125012EsophagusESCCBiosynthesis of nucleotide sugars28/420537/84651.10e-033.42e-031.75e-0328
hsa0052011EsophagusESCCAmino sugar and nucleotide sugar metabolism35/420549/84651.60e-034.88e-032.50e-0335
hsa0005111EsophagusESCCFructose and mannose metabolism24/420534/84651.09e-022.51e-021.29e-0224
hsa012402LiverHCCBiosynthesis of cofactors103/4020153/84654.67e-075.05e-062.81e-06103
hsa012403LiverHCCBiosynthesis of cofactors103/4020153/84654.67e-075.05e-062.81e-06103
hsa00520Oral cavityOSCCAmino sugar and nucleotide sugar metabolism34/370449/84652.48e-048.08e-044.11e-0434
hsa012404Oral cavityOSCCBiosynthesis of cofactors88/3704153/84653.84e-041.20e-036.12e-0488
hsa012504Oral cavityOSCCBiosynthesis of nucleotide sugars25/370437/84652.93e-037.49e-033.81e-0325
hsa005201Oral cavityOSCCAmino sugar and nucleotide sugar metabolism34/370449/84652.48e-048.08e-044.11e-0434
hsa0124011Oral cavityOSCCBiosynthesis of cofactors88/3704153/84653.84e-041.20e-036.12e-0488
hsa0125011Oral cavityOSCCBiosynthesis of nucleotide sugars25/370437/84652.93e-037.49e-033.81e-0325
hsa0124021Oral cavityLPBiosynthesis of cofactors57/2418153/84651.17e-023.91e-022.52e-0257
hsa0124031Oral cavityLPBiosynthesis of cofactors57/2418153/84651.17e-023.91e-022.52e-0257
Page: 1 

Top

Cell-cell communication analysis

check buttonIdentification of potential cell-cell interactions between two cell types and their ligand-receptor pairs for different disease states
LigandReceptorLRpairPathwayTissueDisease Stage
Page: 1 

Top

Single-cell gene regulatory network inference analysis

check buttonFind out the significant the regulons (TFs) and the target genes of each regulon across cell types for different disease states
TFCell TypeTissueDisease StageTarget GeneRSSRegulon Activity
∗The dot plots of a searched regulon are shown for all cell subpopulations in each disease state of each tissue based on the regulon specific score inferred using pySCENIC and by calculating the average expression.
Page: 1 

Top

Somatic mutation of malignant transformation related genes

check buttonAnnotation of somatic variants for genes involved in malignant transformation
Hugo SymbolVariant ClassVariant ClassificationdbSNP RSHGVScHGVSpHGVSp ShortSWISSPROTBIOTYPESIFTPolyPhenTumor Sample BarcodeTissueHistologySexAgeStageTherapy TypesDrugsOutcome
GMPPASNVMissense_Mutationnovelc.101T>Gp.Val34Glyp.V34GQ96IJ6protein_codingtolerated(0.33)possibly_damaging(0.698)TCGA-A8-A06R-01Breastbreast invasive carcinomaFemale>=65I/IIChemotherapy5-fluorouracilCR
GMPPASNVMissense_Mutationc.296N>Ap.Arg99Glnp.R99QQ96IJ6protein_codingdeleterious(0)probably_damaging(0.997)TCGA-AN-A046-01Breastbreast invasive carcinomaFemale>=65I/IIUnknownUnknownSD
GMPPASNVMissense_Mutationrs147832114c.583N>Tp.Arg195Trpp.R195WQ96IJ6protein_codingdeleterious(0.01)possibly_damaging(0.773)TCGA-AN-A046-01Breastbreast invasive carcinomaFemale>=65I/IIUnknownUnknownSD
GMPPASNVMissense_Mutationrs200425681c.821C>Gp.Ala274Glyp.A274GQ96IJ6protein_codingtolerated(0.05)possibly_damaging(0.589)TCGA-AN-A0AT-01Breastbreast invasive carcinomaFemale<65I/IIUnknownUnknownSD
GMPPASNVMissense_Mutationnovelc.101N>Gp.Val34Glyp.V34GQ96IJ6protein_codingtolerated(0.33)possibly_damaging(0.698)TCGA-AQ-A1H3-01Breastbreast invasive carcinomaFemale<65III/IVChemotherapyadriamycinSD
GMPPASNVMissense_Mutationnovelc.101N>Gp.Val34Glyp.V34GQ96IJ6protein_codingtolerated(0.33)possibly_damaging(0.698)TCGA-BH-A0HO-01Breastbreast invasive carcinomaFemale<65I/IIChemotherapycyclophosphamideSD
GMPPASNVMissense_Mutationrs200425681c.821C>Gp.Ala274Glyp.A274GQ96IJ6protein_codingtolerated(0.05)possibly_damaging(0.589)TCGA-C8-A273-01Breastbreast invasive carcinomaFemale<65I/IIHormone TherapytamoxiphenSD
GMPPASNVMissense_Mutationnovelc.101T>Gp.Val34Glyp.V34GQ96IJ6protein_codingtolerated(0.33)possibly_damaging(0.698)TCGA-EW-A1J3-01Breastbreast invasive carcinomaFemale<65I/IIChemotherapycarboplatinSD
GMPPASNVMissense_Mutationnovelc.101T>Gp.Val34Glyp.V34GQ96IJ6protein_codingtolerated(0.33)possibly_damaging(0.698)TCGA-EW-A1PH-01Breastbreast invasive carcinomaFemale<65I/IIChemotherapycyclophosphamideSD
GMPPAinsertionFrame_Shift_Insnovelc.562_563insACAGGCTTTCGTCATAp.Pro188HisfsTer7p.P188Hfs*7Q96IJ6protein_codingTCGA-A8-A07G-01Breastbreast invasive carcinomaFemale>=65I/IIChemotherapy5-fluorouracilCR
Page: 1 2 3 4 5 6 

Top

Related drugs of malignant transformation related genes

check buttonIdentification of chemicals and drugs interact with genes involved in malignant transfromation
(DGIdb 4.0)
Entrez IDSymbolCategoryInteraction TypesDrug Claim NameDrug NamePMIDs
Page: 1