
|
|||||
|
 | |
| |
| |
| |
| |
| |
|
Gene: GDI2 |
Gene summary for GDI2 |
| Gene information | Species | Human | Gene symbol | GDI2 | Gene ID | 2665 |
| Gene name | GDP dissociation inhibitor 2 | |
| Gene Alias | HEL-S-46e | |
| Cytomap | 10p15.1 | |
| Gene Type | protein-coding | GO ID | GO:0006810 | UniProtAcc | P50395 |
Top |
Malignant transformation analysis |
| Identification of the aberrant gene expression in precancerous and cancerous lesions by comparing the gene expression of stem-like cells in diseased tissues with normal stem cells |
| Entrez ID | Symbol | Replicates | Species | Organ | Tissue | Adj P-value | Log2FC | Malignancy |
| 2665 | GDI2 | EEC-subject3 | Human | Endometrium | EEC | 9.86e-31 | -4.55e-01 | -0.2525 |
| 2665 | GDI2 | EEC-subject4 | Human | Endometrium | EEC | 2.36e-06 | -3.19e-01 | -0.2571 |
| 2665 | GDI2 | EEC-subject5 | Human | Endometrium | EEC | 5.24e-08 | -3.48e-01 | -0.249 |
| 2665 | GDI2 | GSM5276934 | Human | Endometrium | EEC | 5.41e-03 | -2.50e-01 | -0.0913 |
| 2665 | GDI2 | GSM6177620_NYU_UCEC1_lib1_lib1 | Human | Endometrium | EEC | 5.09e-30 | -3.13e-01 | -0.1869 |
| 2665 | GDI2 | GSM6177620_NYU_UCEC1_lib2_lib2 | Human | Endometrium | EEC | 1.65e-32 | -1.82e-01 | -0.1875 |
| 2665 | GDI2 | GSM6177620_NYU_UCEC1_lib3_lib3 | Human | Endometrium | EEC | 6.33e-34 | -2.11e-01 | -0.1883 |
| 2665 | GDI2 | GSM6177621_NYU_UCEC2_lib1_lib1 | Human | Endometrium | EEC | 3.18e-30 | -8.58e-02 | -0.1934 |
| 2665 | GDI2 | GSM6177622_NYU_UCEC3_lib1_lib1 | Human | Endometrium | EEC | 2.37e-46 | -7.66e-02 | -0.1917 |
| 2665 | GDI2 | GSM6177622_NYU_UCEC3_lib2_lib2 | Human | Endometrium | EEC | 1.65e-55 | -1.66e-02 | -0.1916 |
| 2665 | GDI2 | GSM6177623_NYU_UCEC3_Vis | Human | Endometrium | EEC | 4.49e-06 | -1.58e-01 | -0.1269 |
| 2665 | GDI2 | LZE4T | Human | Esophagus | ESCC | 2.48e-14 | 8.77e-01 | 0.0811 |
| 2665 | GDI2 | LZE5T | Human | Esophagus | ESCC | 2.89e-03 | 8.43e-01 | 0.0514 |
| 2665 | GDI2 | LZE8T | Human | Esophagus | ESCC | 4.33e-09 | 4.15e-01 | 0.067 |
| 2665 | GDI2 | LZE20T | Human | Esophagus | ESCC | 1.43e-05 | 3.85e-02 | 0.0662 |
| 2665 | GDI2 | LZE22T | Human | Esophagus | ESCC | 1.57e-03 | 8.94e-01 | 0.068 |
| 2665 | GDI2 | LZE24T | Human | Esophagus | ESCC | 7.68e-27 | 1.39e+00 | 0.0596 |
| 2665 | GDI2 | LZE6T | Human | Esophagus | ESCC | 6.68e-05 | 5.33e-01 | 0.0845 |
| 2665 | GDI2 | P1T-E | Human | Esophagus | ESCC | 9.30e-04 | 5.18e-01 | 0.0875 |
| 2665 | GDI2 | P2T-E | Human | Esophagus | ESCC | 5.15e-44 | 9.06e-01 | 0.1177 |
| Page: 1 2 3 4 5 6 7 8 9 10 |
| Tissue | Expression Dynamics | Abbreviation |
| Colorectum (GSE201348) |  | FAP: Familial adenomatous polyposis |
| CRC: Colorectal cancer | ||
| Colorectum (HTA11) |  | AD: Adenomas |
| SER: Sessile serrated lesions | ||
| MSI-H: Microsatellite-high colorectal cancer | ||
| MSS: Microsatellite stable colorectal cancer | ||
| Endometrium |  | AEH: Atypical endometrial hyperplasia |
| EEC: Endometrioid Cancer | ||
| Esophagus |  | ESCC: Esophageal squamous cell carcinoma |
| HGIN: High-grade intraepithelial neoplasias | ||
| LGIN: Low-grade intraepithelial neoplasias | ||
| Liver | 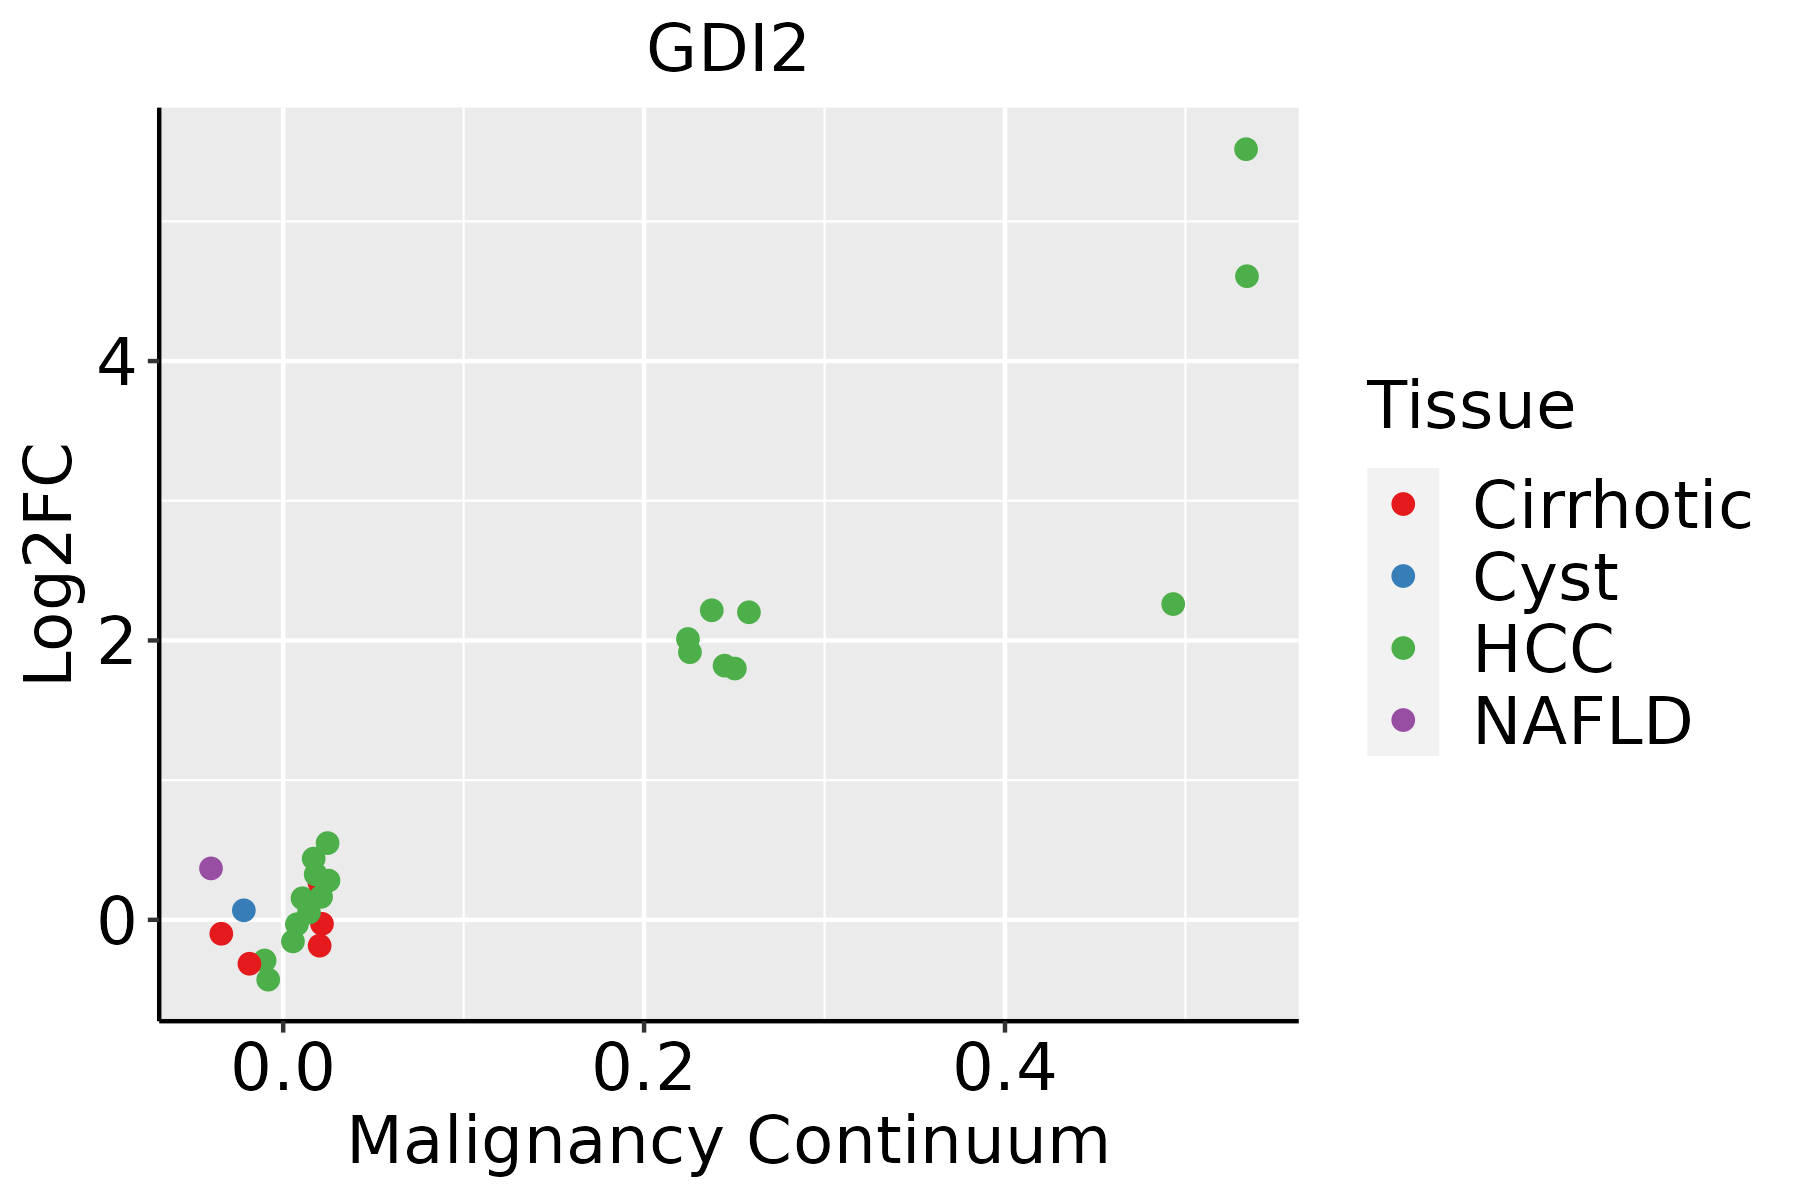 | HCC: Hepatocellular carcinoma |
| NAFLD: Non-alcoholic fatty liver disease | ||
| Oral Cavity | 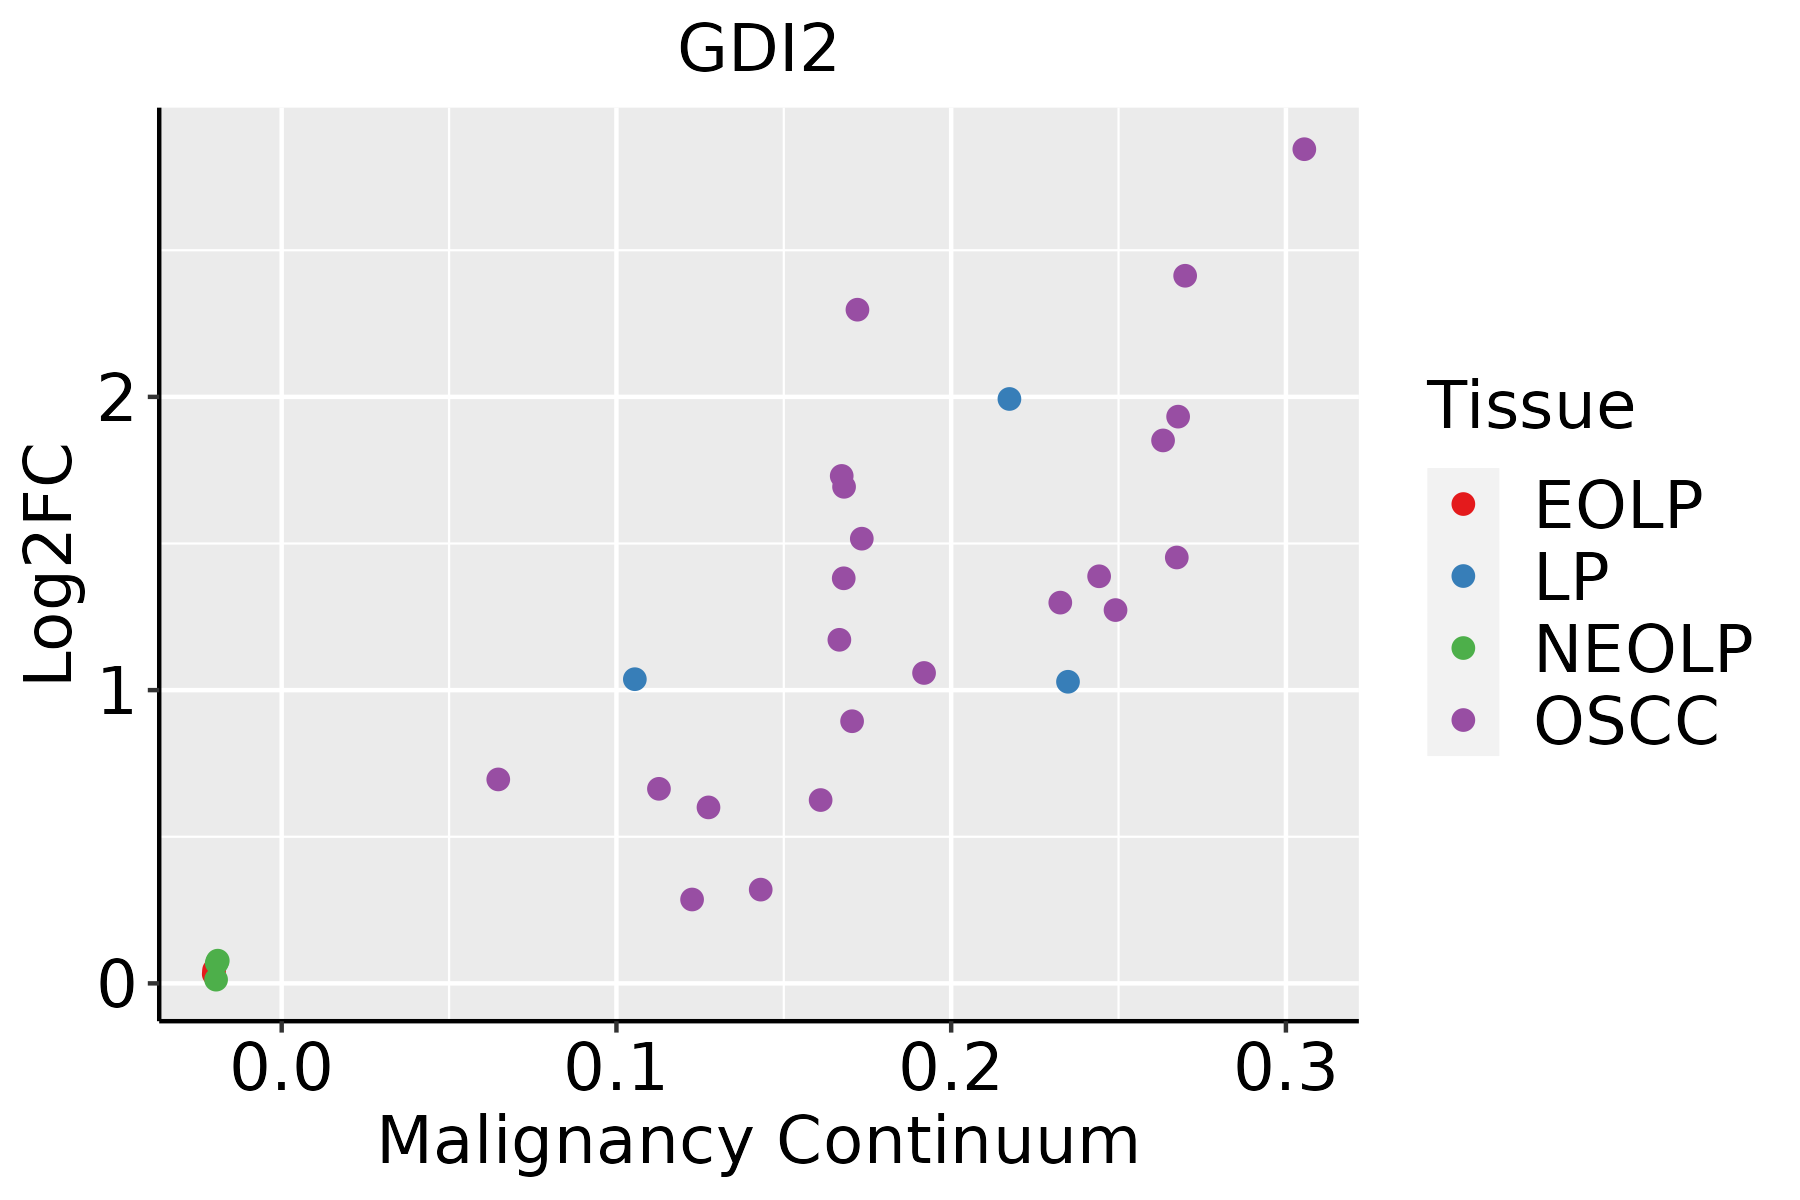 | EOLP: Erosive Oral lichen planus |
| LP: leukoplakia | ||
| NEOLP: Non-erosive oral lichen planus | ||
| OSCC: Oral squamous cell carcinoma | ||
| Prostate | 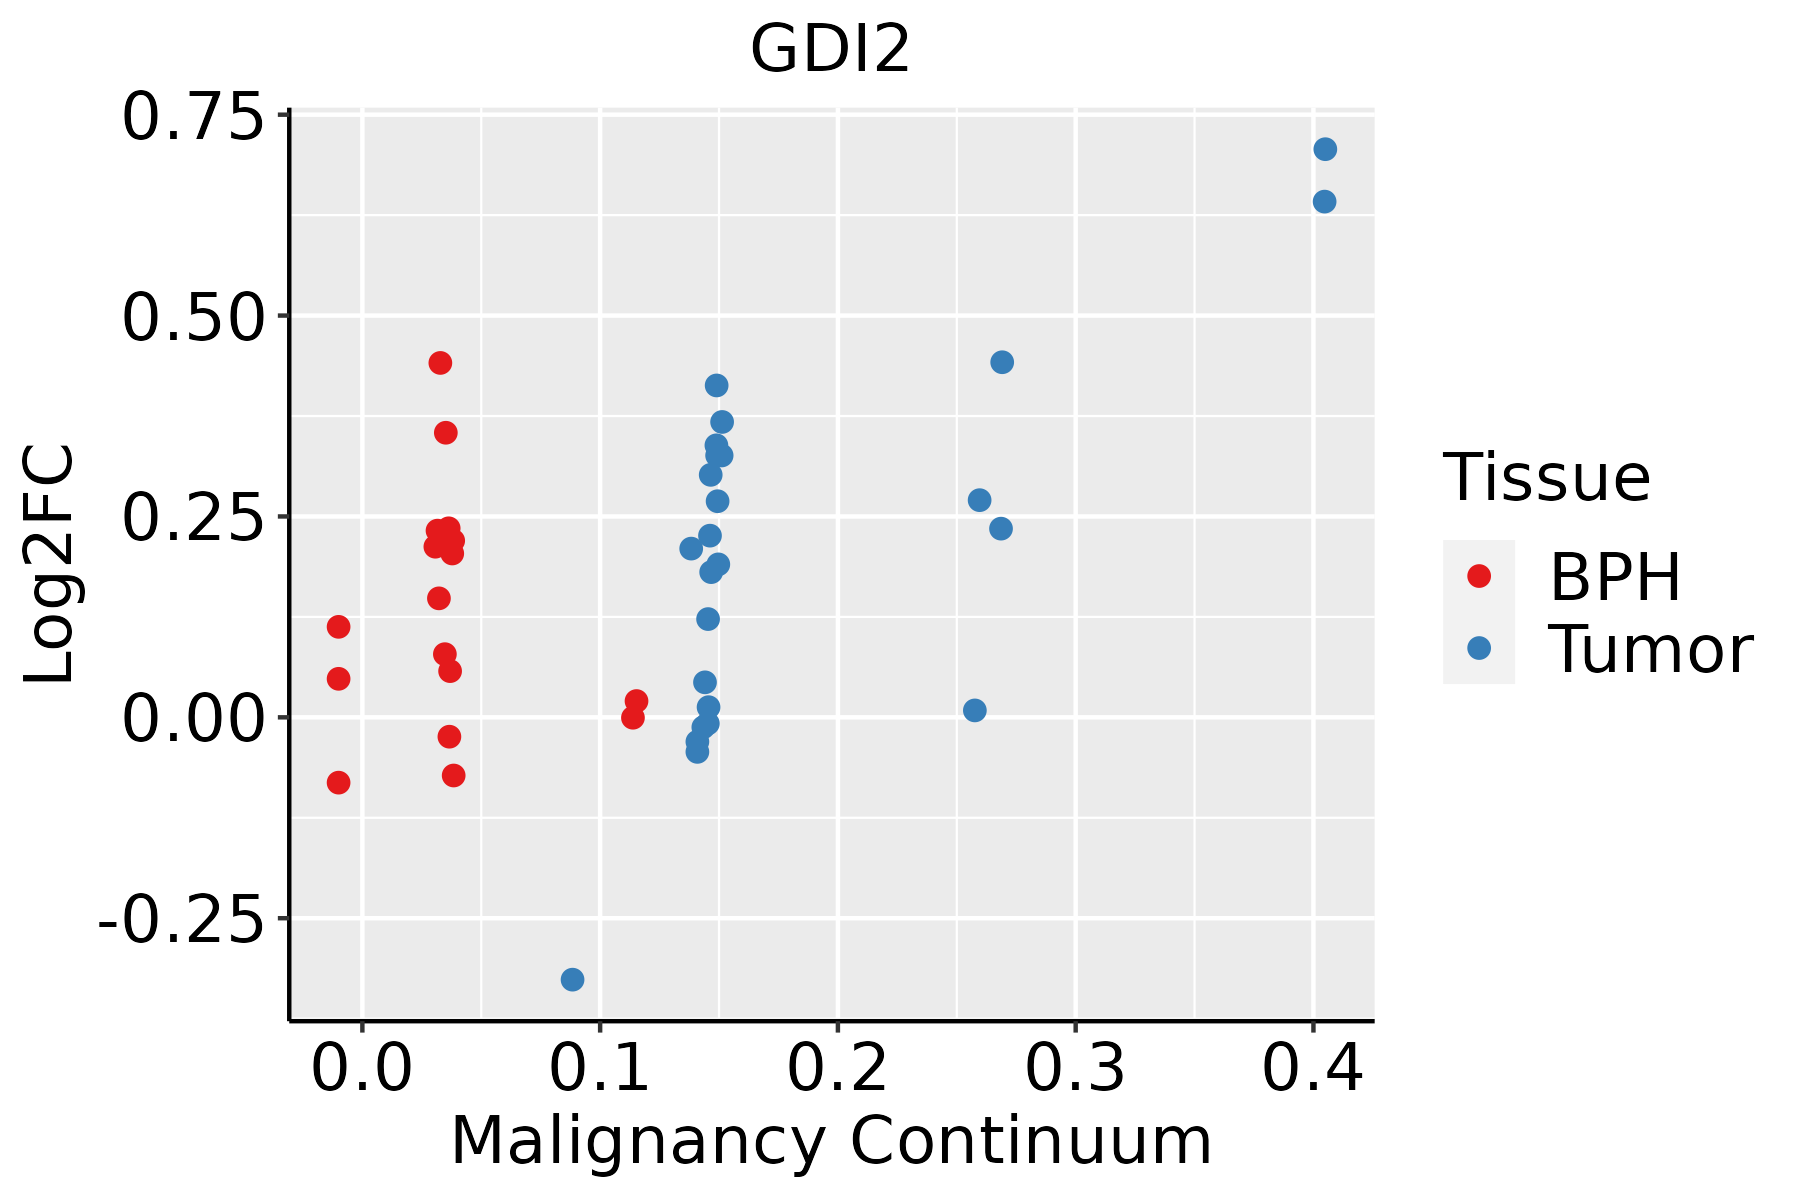 | BPH: Benign Prostatic Hyperplasia |
| Skin | 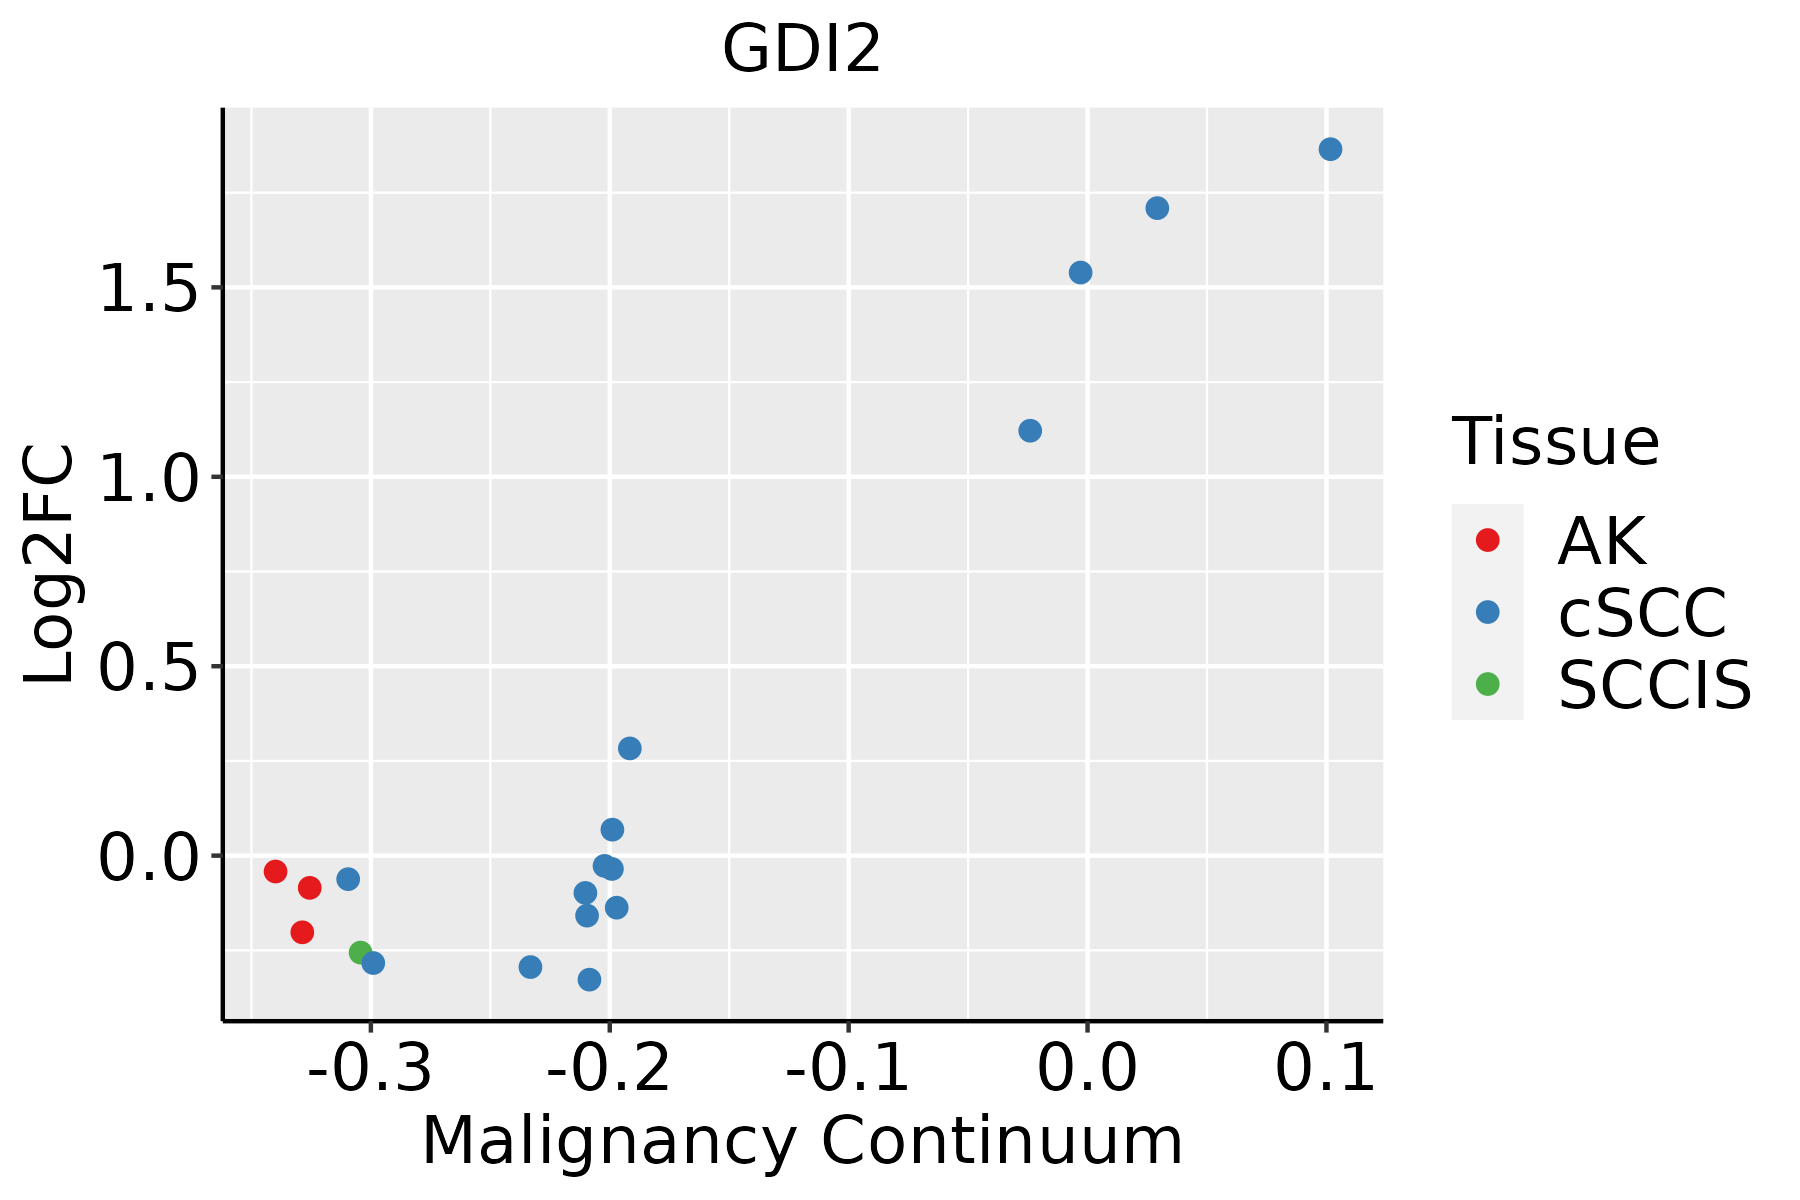 | AK: Actinic keratosis |
| cSCC: Cutaneous squamous cell carcinoma | ||
| SCCIS:squamous cell carcinoma in situ | ||
| Thyroid | 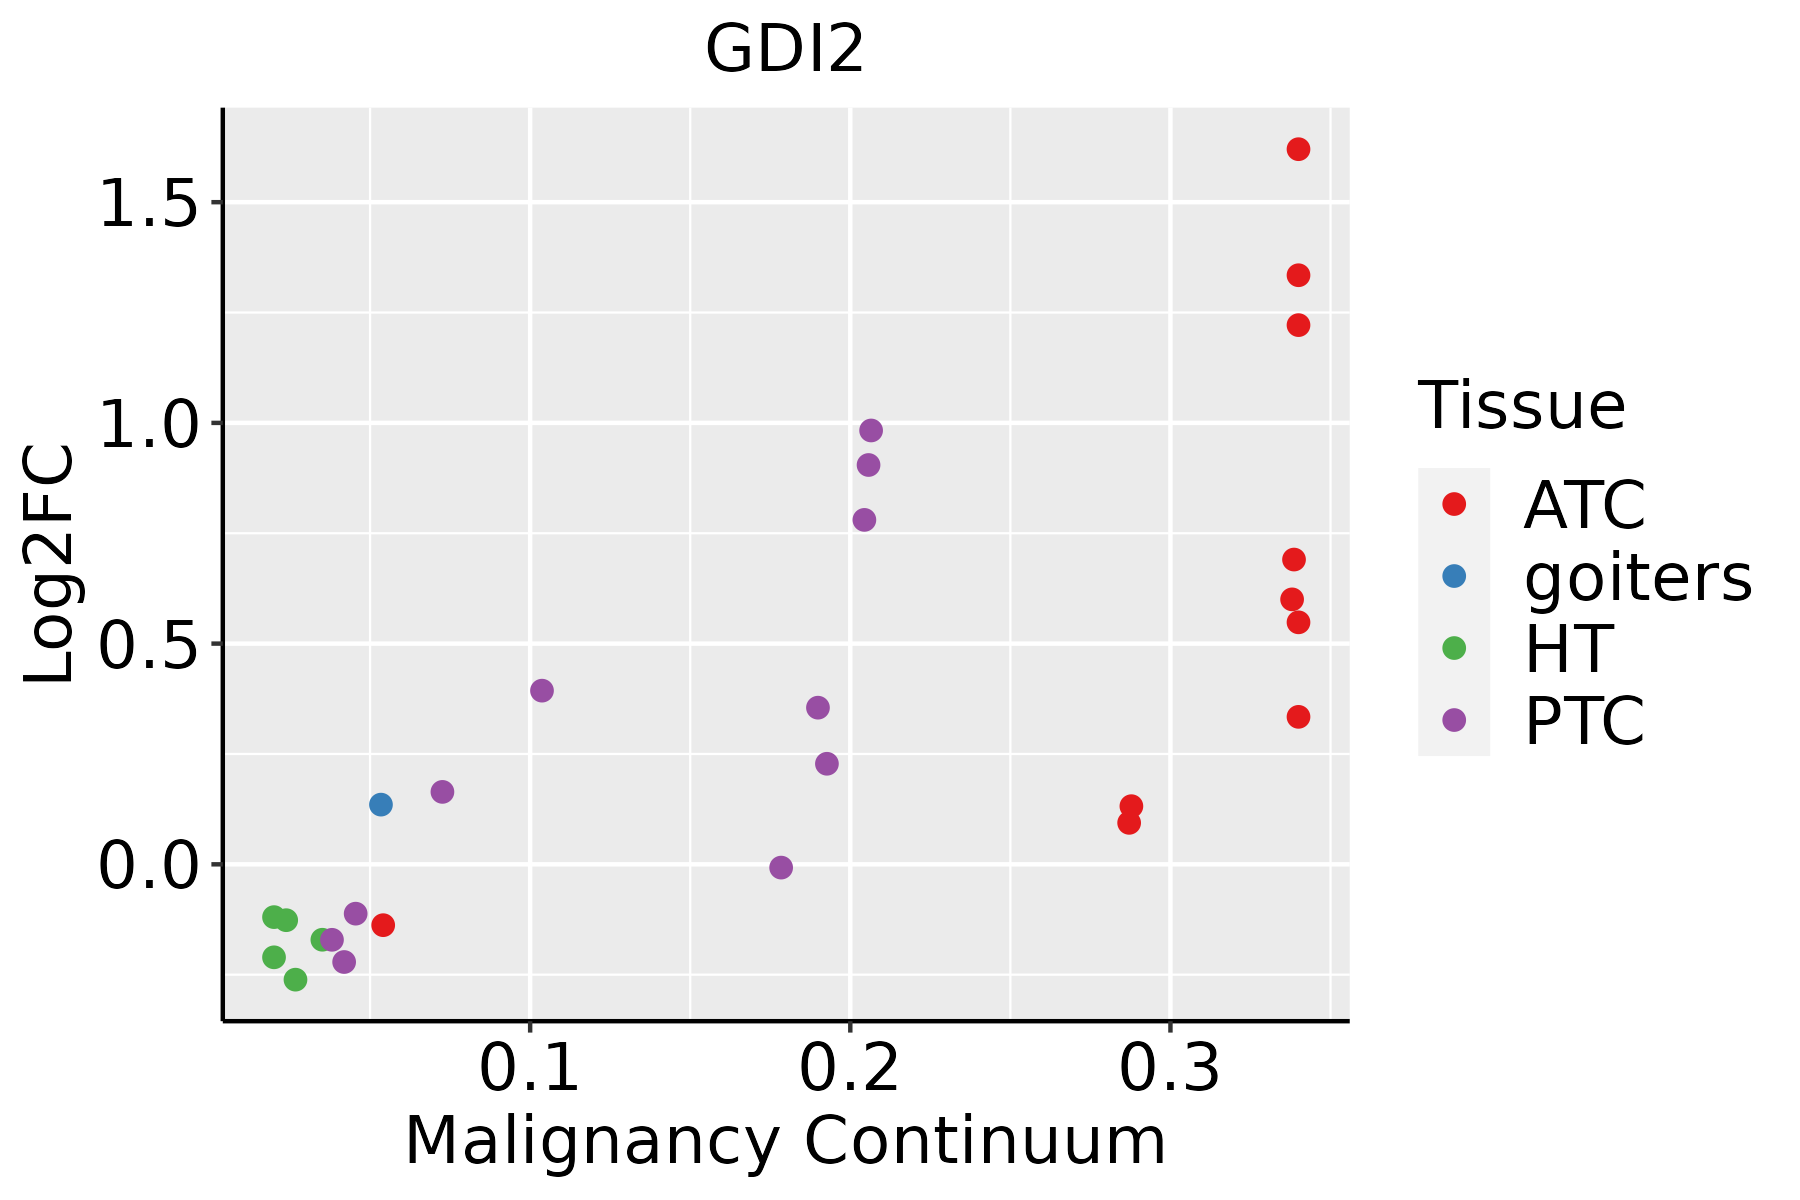 | ATC: Anaplastic thyroid cancer |
| HT: Hashimoto's thyroiditis | ||
| PTC: Papillary thyroid cancer |
| ∗log2FC in expression of this searched gene in stem-like cells from each diseased tissue sample relative to stem-like cells in normal samples in each tissue plotted against the malignancy continuum. Samples are colored based on if they are from different disease stage. |
Top |
Malignant transformation related pathway analysis |
| Find out the enriched GO biological processes and KEGG pathways involved in transition from healthy to precancer to cancer |
| Tissue | Disease Stage | Enriched GO biological Processes |
| Colorectum | AD |  |
| Colorectum | SER |  |
| Colorectum | MSS |  |
| Colorectum | MSI-H |  |
| Colorectum | FAP |  |
| ∗Top 15 enriched GO BP terms are showed in the bar plot of each disease state in each tissue. Each row represents a significant GO biological process which is colored according to the -log10(p.adjust). |
| Page: 1 2 3 4 5 6 7 8 9 |
| GO ID | Tissue | Disease Stage | Description | Gene Ratio | Bg Ratio | pvalue | p.adjust | Count |
| Page: 1 |
| Pathway ID | Tissue | Disease Stage | Description | Gene Ratio | Bg Ratio | pvalue | p.adjust | qvalue | Count |
| Page: 1 |
Top |
Cell-cell communication analysis |
| Identification of potential cell-cell interactions between two cell types and their ligand-receptor pairs for different disease states |
| Ligand | Receptor | LRpair | Pathway | Tissue | Disease Stage |
| Page: 1 |
Top |
Single-cell gene regulatory network inference analysis |
| Find out the significant the regulons (TFs) and the target genes of each regulon across cell types for different disease states |
| TF | Cell Type | Tissue | Disease Stage | Target Gene | RSS | Regulon Activity |
| ∗The dot plots of a searched regulon are shown for all cell subpopulations in each disease state of each tissue based on the regulon specific score inferred using pySCENIC and by calculating the average expression. |
| Page: 1 |
Top |
Somatic mutation of malignant transformation related genes |
| Annotation of somatic variants for genes involved in malignant transformation |
| Hugo Symbol | Variant Class | Variant Classification | dbSNP RS | HGVSc | HGVSp | HGVSp Short | SWISSPROT | BIOTYPE | SIFT | PolyPhen | Tumor Sample Barcode | Tissue | Histology | Sex | Age | Stage | Therapy Types | Drugs | Outcome |
| GDI2 | SNV | Missense_Mutation | novel | c.293G>A | p.Arg98His | p.R98H | P50395 | protein_coding | deleterious(0.02) | benign(0.168) | TCGA-AC-A3TN-01 | Breast | breast invasive carcinoma | Female | >=65 | I/II | Hormone Therapy | arimidex | SD |
| GDI2 | SNV | Missense_Mutation | rs533312902 | c.868N>T | p.Arg290Trp | p.R290W | P50395 | protein_coding | deleterious(0) | probably_damaging(0.994) | TCGA-AN-A046-01 | Breast | breast invasive carcinoma | Female | >=65 | I/II | Unknown | Unknown | SD |
| GDI2 | deletion | Frame_Shift_Del | novel | c.135delT | p.Ile46Ter | p.I46* | P50395 | protein_coding | TCGA-D8-A27V-01 | Breast | breast invasive carcinoma | Female | <65 | I/II | Hormone Therapy | tamoxiphen | SD | ||
| GDI2 | SNV | Missense_Mutation | novel | c.427N>C | p.Phe143Leu | p.F143L | P50395 | protein_coding | tolerated(0.1) | benign(0.296) | TCGA-VS-A8EJ-01 | Cervix | cervical & endocervical cancer | Female | <65 | I/II | Chemotherapy | cisplatin | PD |
| GDI2 | SNV | Missense_Mutation | novel | c.1243N>A | p.Asp415Asn | p.D415N | P50395 | protein_coding | tolerated(0.29) | benign(0.001) | TCGA-ZJ-AAXA-01 | Cervix | cervical & endocervical cancer | Female | <65 | I/II | Unknown | Unknown | SD |
| GDI2 | deletion | Frame_Shift_Del | novel | c.52delN | p.Ile18SerfsTer5 | p.I18Sfs*5 | P50395 | protein_coding | TCGA-DS-A1OB-01 | Cervix | cervical & endocervical cancer | Female | <65 | I/II | Chemotherapy | carboplatin | PD | ||
| GDI2 | SNV | Missense_Mutation | c.31N>T | p.Gly11Cys | p.G11C | P50395 | protein_coding | deleterious(0.01) | probably_damaging(0.997) | TCGA-A6-2686-01 | Colorectum | colon adenocarcinoma | Female | >=65 | I/II | Unknown | Unknown | SD | |
| GDI2 | SNV | Missense_Mutation | c.890N>C | p.Val297Ala | p.V297A | P50395 | protein_coding | deleterious(0.02) | possibly_damaging(0.715) | TCGA-AA-3715-01 | Colorectum | colon adenocarcinoma | Male | >=65 | I/II | Unknown | Unknown | PD | |
| GDI2 | SNV | Missense_Mutation | c.107A>G | p.Asn36Ser | p.N36S | P50395 | protein_coding | deleterious(0.01) | possibly_damaging(0.538) | TCGA-AD-6964-01 | Colorectum | colon adenocarcinoma | Male | <65 | III/IV | Chemotherapy | folfox | PD | |
| GDI2 | SNV | Missense_Mutation | novel | c.865G>T | p.Asp289Tyr | p.D289Y | P50395 | protein_coding | deleterious(0) | possibly_damaging(0.855) | TCGA-AZ-4315-01 | Colorectum | colon adenocarcinoma | Male | <65 | I/II | Unknown | Unknown | SD |
| Page: 1 2 3 4 5 |
Top |
Related drugs of malignant transformation related genes |
| Identification of chemicals and drugs interact with genes involved in malignant transfromation |
| (DGIdb 4.0) |
| Entrez ID | Symbol | Category | Interaction Types | Drug Claim Name | Drug Name | PMIDs |
| Page: 1 |

Copyright 2023-Present -The University of Texas Health Science Center at Houston |