
|
|||||
|
 | |
| |
| |
| |
| |
| |
|
Gene: FYTTD1 |
Gene summary for FYTTD1 |
| Gene information | Species | Human | Gene symbol | FYTTD1 | Gene ID | 84248 |
| Gene name | forty-two-three domain containing 1 | |
| Gene Alias | UIF | |
| Cytomap | 3q29 | |
| Gene Type | protein-coding | GO ID | GO:0006403 | UniProtAcc | Q96QD9 |
Top |
Malignant transformation analysis |
| Identification of the aberrant gene expression in precancerous and cancerous lesions by comparing the gene expression of stem-like cells in diseased tissues with normal stem cells |
| Entrez ID | Symbol | Replicates | Species | Organ | Tissue | Adj P-value | Log2FC | Malignancy |
| 84248 | FYTTD1 | P44T-E | Human | Esophagus | ESCC | 7.12e-18 | 4.64e-01 | 0.1096 |
| 84248 | FYTTD1 | P47T-E | Human | Esophagus | ESCC | 2.74e-25 | 7.11e-01 | 0.1067 |
| 84248 | FYTTD1 | P48T-E | Human | Esophagus | ESCC | 4.51e-19 | 5.23e-01 | 0.0959 |
| 84248 | FYTTD1 | P49T-E | Human | Esophagus | ESCC | 4.95e-26 | 1.85e+00 | 0.1768 |
| 84248 | FYTTD1 | P52T-E | Human | Esophagus | ESCC | 5.28e-32 | 9.64e-01 | 0.1555 |
| 84248 | FYTTD1 | P54T-E | Human | Esophagus | ESCC | 4.25e-22 | 4.86e-01 | 0.0975 |
| 84248 | FYTTD1 | P56T-E | Human | Esophagus | ESCC | 5.90e-14 | 1.37e+00 | 0.1613 |
| 84248 | FYTTD1 | P57T-E | Human | Esophagus | ESCC | 7.13e-12 | 4.10e-01 | 0.0926 |
| 84248 | FYTTD1 | P61T-E | Human | Esophagus | ESCC | 4.10e-22 | 5.27e-01 | 0.099 |
| 84248 | FYTTD1 | P62T-E | Human | Esophagus | ESCC | 2.18e-81 | 1.29e+00 | 0.1302 |
| 84248 | FYTTD1 | P65T-E | Human | Esophagus | ESCC | 2.62e-25 | 3.96e-01 | 0.0978 |
| 84248 | FYTTD1 | P74T-E | Human | Esophagus | ESCC | 1.40e-55 | 1.44e+00 | 0.1479 |
| 84248 | FYTTD1 | P75T-E | Human | Esophagus | ESCC | 3.59e-29 | 8.00e-01 | 0.1125 |
| 84248 | FYTTD1 | P76T-E | Human | Esophagus | ESCC | 2.70e-23 | 6.04e-01 | 0.1207 |
| 84248 | FYTTD1 | P79T-E | Human | Esophagus | ESCC | 2.92e-46 | 8.85e-01 | 0.1154 |
| 84248 | FYTTD1 | P80T-E | Human | Esophagus | ESCC | 4.46e-60 | 2.04e+00 | 0.155 |
| 84248 | FYTTD1 | P82T-E | Human | Esophagus | ESCC | 7.57e-13 | 7.60e-01 | 0.1072 |
| 84248 | FYTTD1 | P83T-E | Human | Esophagus | ESCC | 1.34e-65 | 1.83e+00 | 0.1738 |
| 84248 | FYTTD1 | P84T-E | Human | Esophagus | ESCC | 7.23e-06 | 6.13e-01 | 0.0933 |
| 84248 | FYTTD1 | P89T-E | Human | Esophagus | ESCC | 1.08e-14 | 9.12e-01 | 0.1752 |
| Page: 1 2 3 4 5 6 |
| Tissue | Expression Dynamics | Abbreviation |
| Esophagus |  | ESCC: Esophageal squamous cell carcinoma |
| HGIN: High-grade intraepithelial neoplasias | ||
| LGIN: Low-grade intraepithelial neoplasias | ||
| Liver | 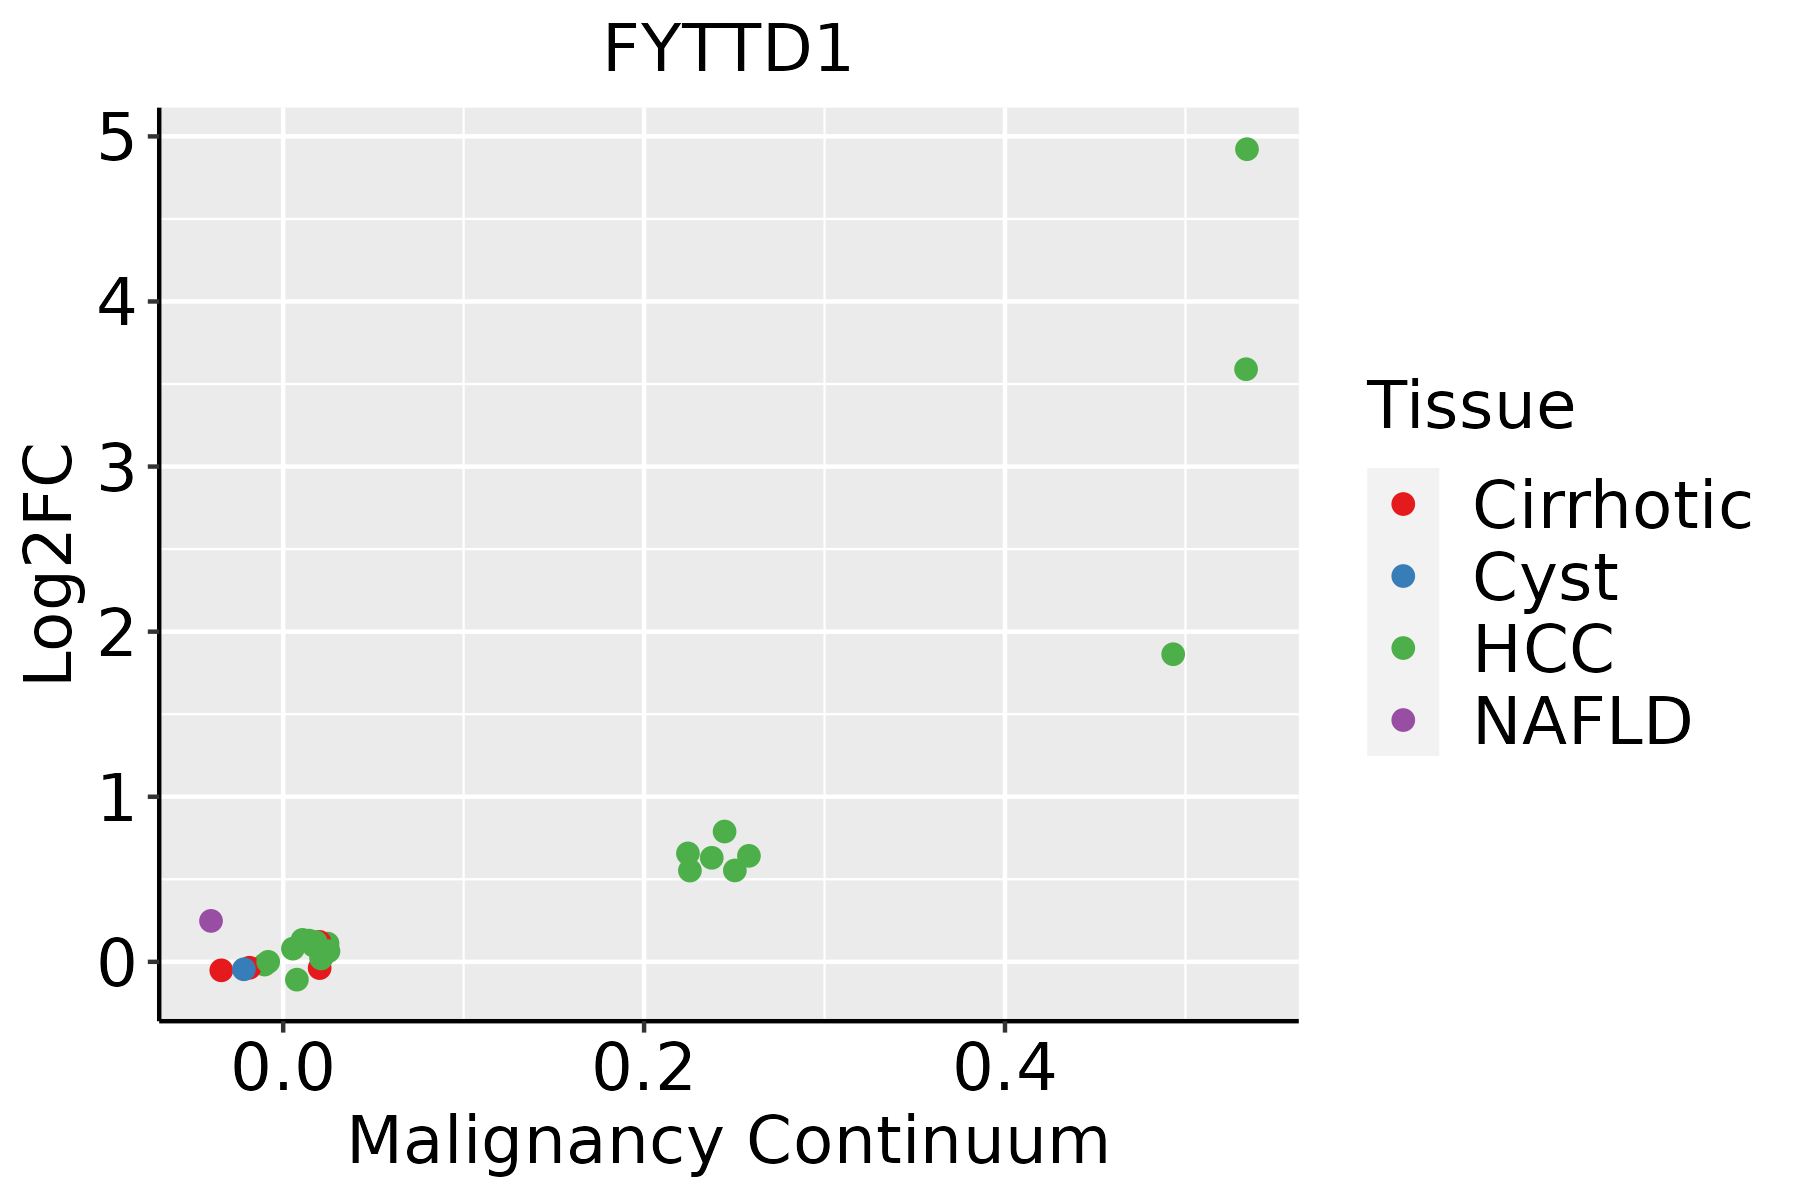 | HCC: Hepatocellular carcinoma |
| NAFLD: Non-alcoholic fatty liver disease | ||
| Oral Cavity |  | EOLP: Erosive Oral lichen planus |
| LP: leukoplakia | ||
| NEOLP: Non-erosive oral lichen planus | ||
| OSCC: Oral squamous cell carcinoma | ||
| Skin | 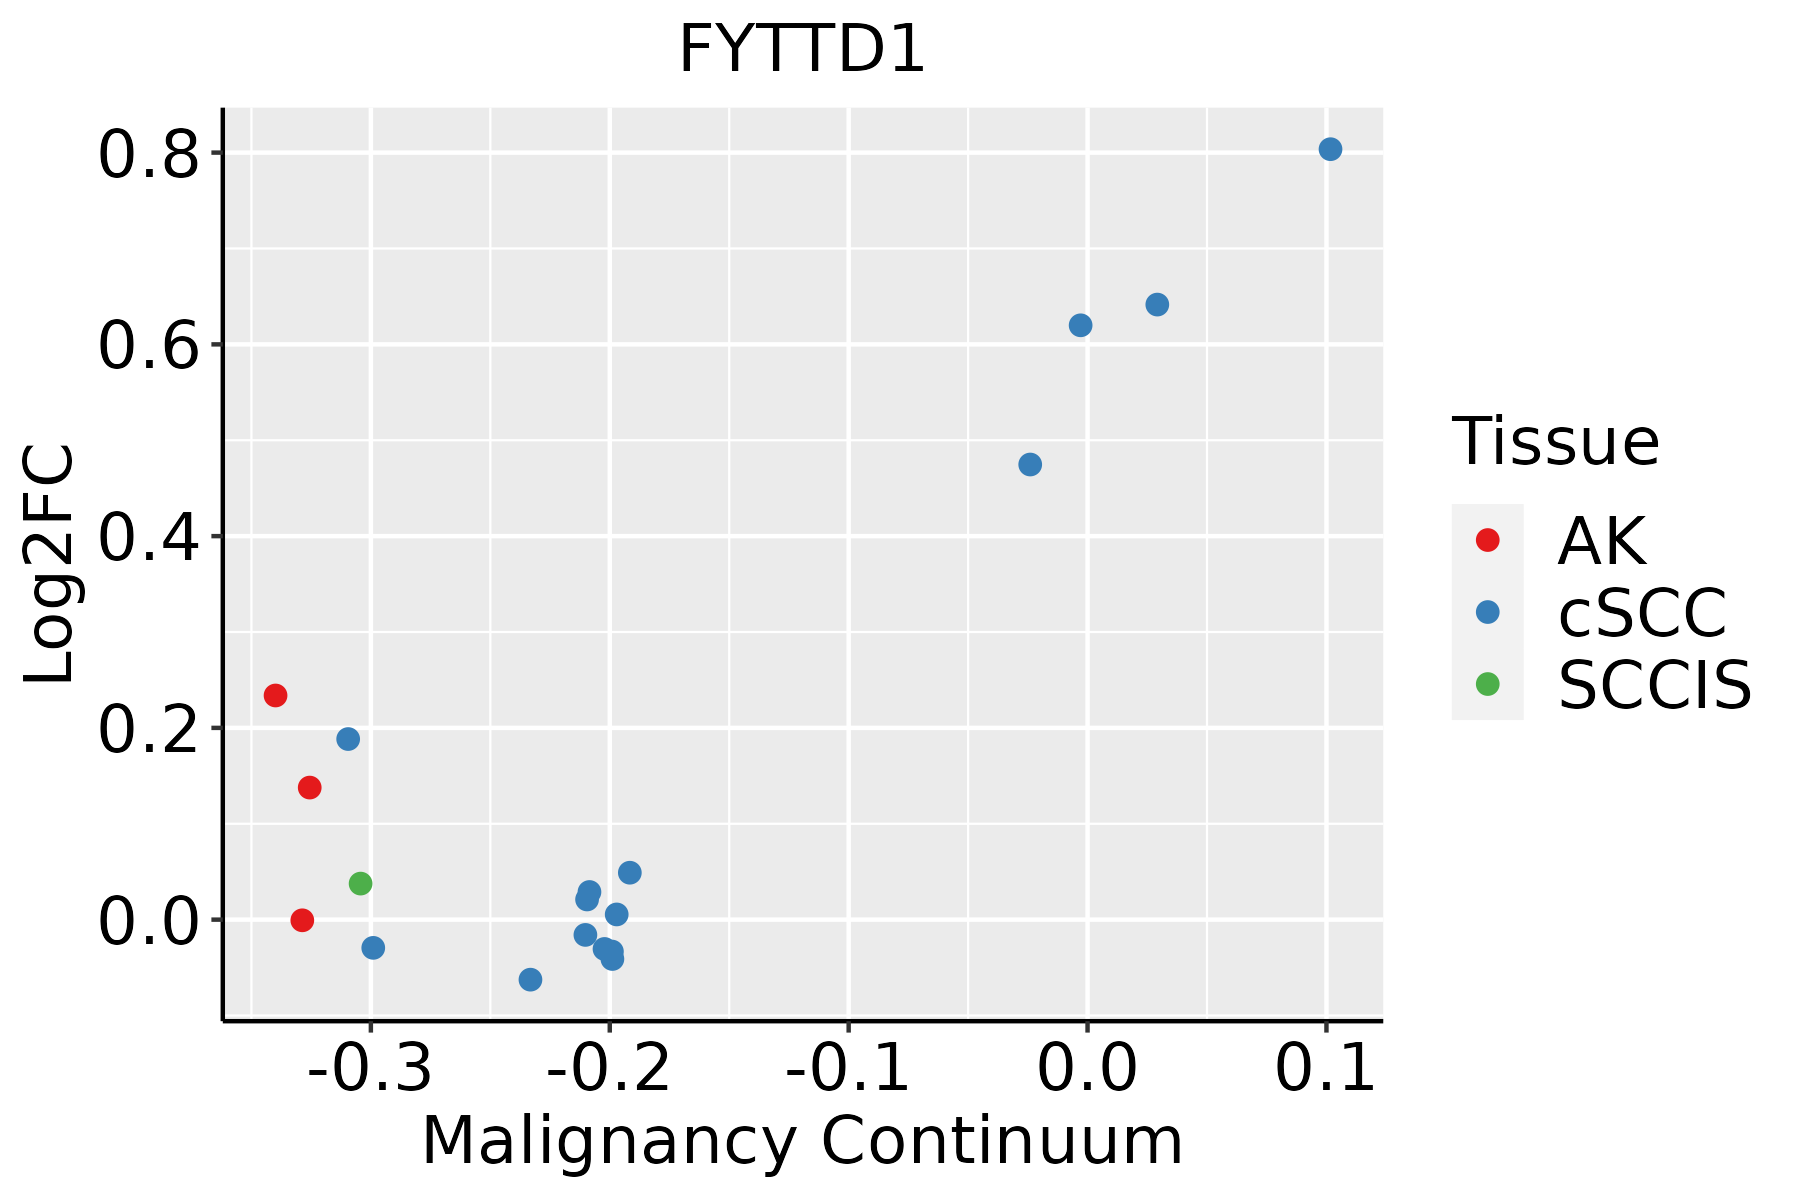 | AK: Actinic keratosis |
| cSCC: Cutaneous squamous cell carcinoma | ||
| SCCIS:squamous cell carcinoma in situ | ||
| Thyroid | 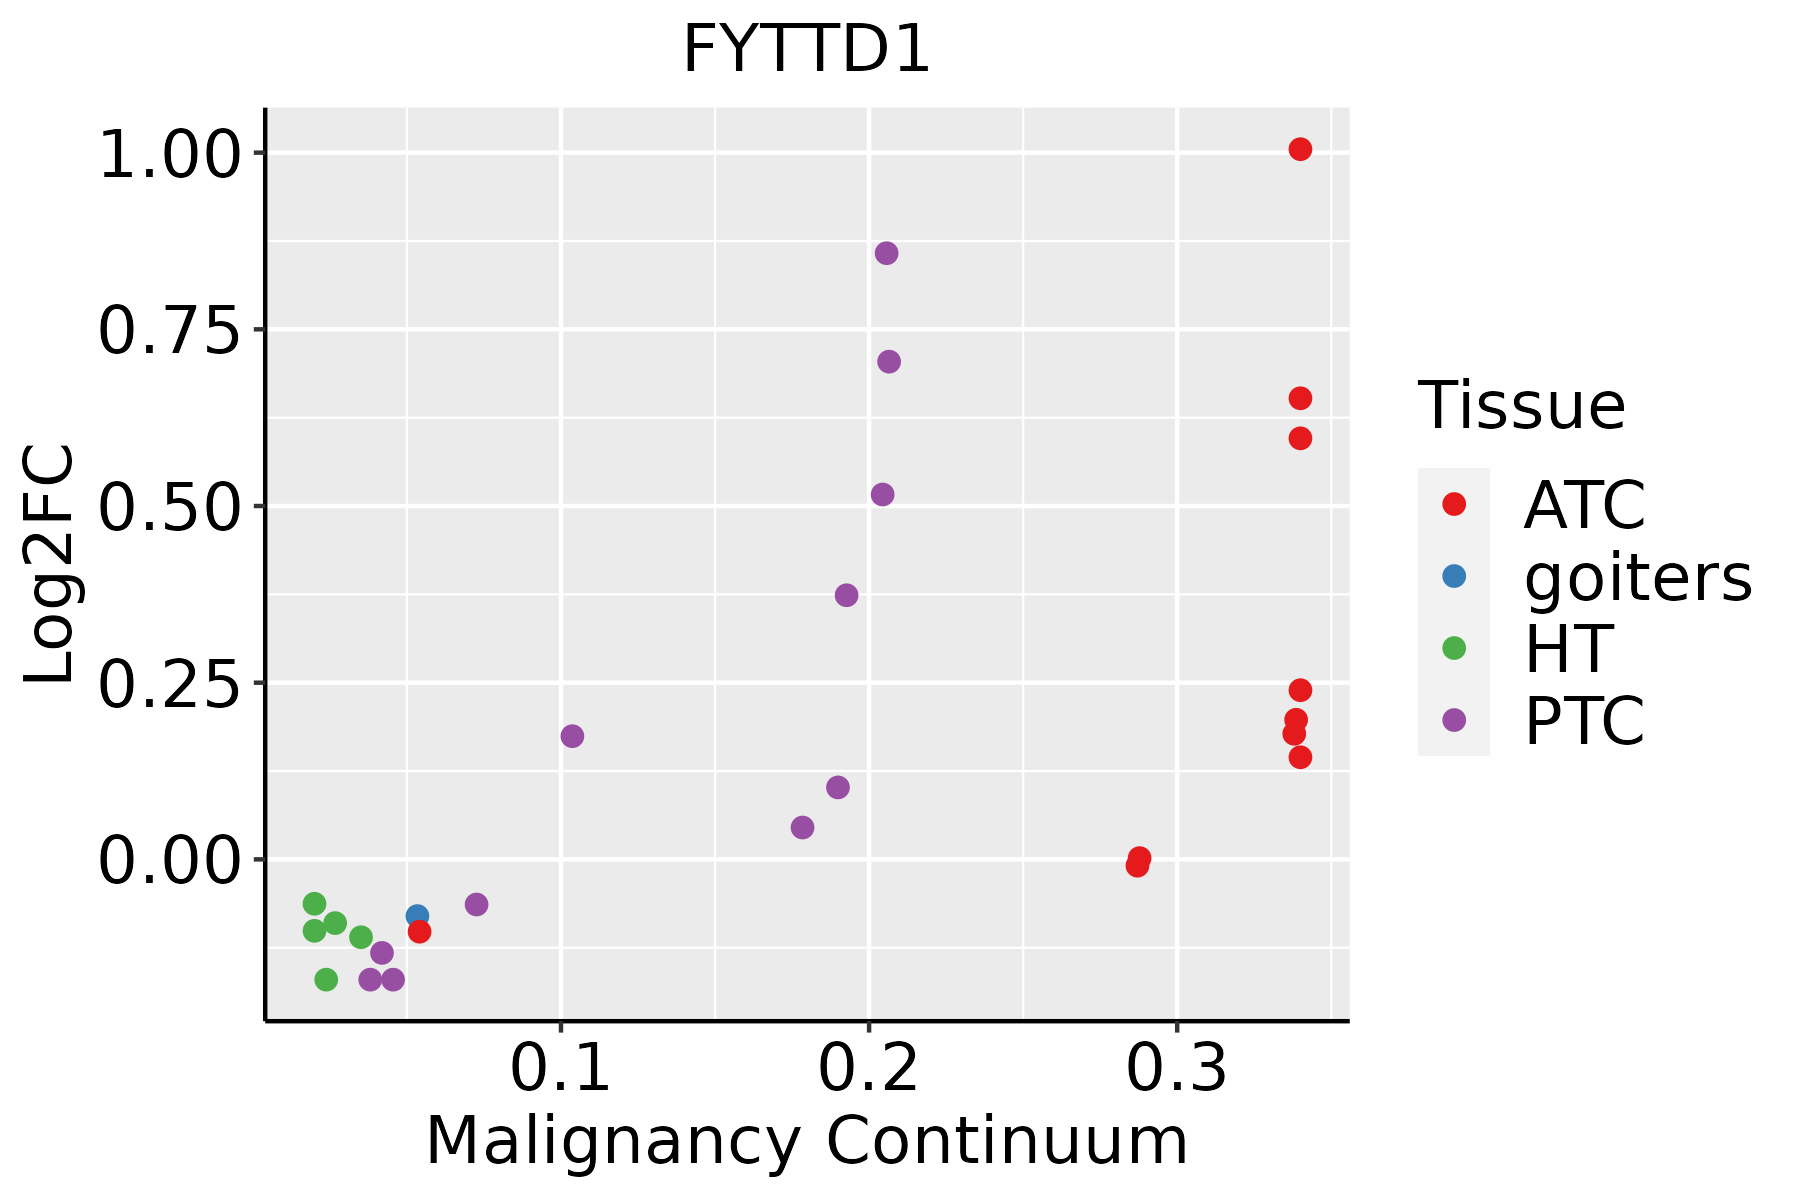 | ATC: Anaplastic thyroid cancer |
| HT: Hashimoto's thyroiditis | ||
| PTC: Papillary thyroid cancer |
| ∗log2FC in expression of this searched gene in stem-like cells from each diseased tissue sample relative to stem-like cells in normal samples in each tissue plotted against the malignancy continuum. Samples are colored based on if they are from different disease stage. |
Top |
Malignant transformation related pathway analysis |
| Find out the enriched GO biological processes and KEGG pathways involved in transition from healthy to precancer to cancer |
| Tissue | Disease Stage | Enriched GO biological Processes |
| Colorectum | AD |  |
| Colorectum | SER |  |
| Colorectum | MSS |  |
| Colorectum | MSI-H |  |
| Colorectum | FAP |  |
| ∗Top 15 enriched GO BP terms are showed in the bar plot of each disease state in each tissue. Each row represents a significant GO biological process which is colored according to the -log10(p.adjust). |
| Page: 1 2 3 4 5 6 7 8 9 |
| GO ID | Tissue | Disease Stage | Description | Gene Ratio | Bg Ratio | pvalue | p.adjust | Count |
| GO:0006913110 | Esophagus | ESCC | nucleocytoplasmic transport | 230/8552 | 301/18723 | 6.04e-28 | 2.02e-25 | 230 |
| GO:0051169110 | Esophagus | ESCC | nuclear transport | 230/8552 | 301/18723 | 6.04e-28 | 2.02e-25 | 230 |
| GO:0006403110 | Esophagus | ESCC | RNA localization | 166/8552 | 201/18723 | 1.95e-27 | 6.18e-25 | 166 |
| GO:005123617 | Esophagus | ESCC | establishment of RNA localization | 134/8552 | 166/18723 | 1.23e-20 | 1.81e-18 | 134 |
| GO:0051168110 | Esophagus | ESCC | nuclear export | 126/8552 | 154/18723 | 1.88e-20 | 2.65e-18 | 126 |
| GO:005102815 | Esophagus | ESCC | mRNA transport | 110/8552 | 130/18723 | 2.76e-20 | 3.80e-18 | 110 |
| GO:005065717 | Esophagus | ESCC | nucleic acid transport | 131/8552 | 163/18723 | 6.94e-20 | 8.46e-18 | 131 |
| GO:005065817 | Esophagus | ESCC | RNA transport | 131/8552 | 163/18723 | 6.94e-20 | 8.46e-18 | 131 |
| GO:001593117 | Esophagus | ESCC | nucleobase-containing compound transport | 162/8552 | 222/18723 | 9.87e-17 | 7.93e-15 | 162 |
| GO:007116612 | Esophagus | ESCC | ribonucleoprotein complex localization | 66/8552 | 77/18723 | 2.94e-13 | 1.38e-11 | 66 |
| GO:007142612 | Esophagus | ESCC | ribonucleoprotein complex export from nucleus | 65/8552 | 76/18723 | 5.56e-13 | 2.50e-11 | 65 |
| GO:000640512 | Esophagus | ESCC | RNA export from nucleus | 68/8552 | 84/18723 | 2.99e-11 | 1.01e-09 | 68 |
| GO:00064064 | Esophagus | ESCC | mRNA export from nucleus | 51/8552 | 59/18723 | 7.98e-11 | 2.47e-09 | 51 |
| GO:00714274 | Esophagus | ESCC | mRNA-containing ribonucleoprotein complex export from nucleus | 51/8552 | 59/18723 | 7.98e-11 | 2.47e-09 | 51 |
| GO:003150314 | Esophagus | ESCC | protein-containing complex localization | 139/8552 | 220/18723 | 1.14e-07 | 1.85e-06 | 139 |
| GO:000640312 | Liver | Cirrhotic | RNA localization | 94/4634 | 201/18723 | 8.57e-12 | 5.66e-10 | 94 |
| GO:000691312 | Liver | Cirrhotic | nucleocytoplasmic transport | 118/4634 | 301/18723 | 1.71e-08 | 6.27e-07 | 118 |
| GO:005116912 | Liver | Cirrhotic | nuclear transport | 118/4634 | 301/18723 | 1.71e-08 | 6.27e-07 | 118 |
| GO:005123611 | Liver | Cirrhotic | establishment of RNA localization | 71/4634 | 166/18723 | 2.56e-07 | 6.41e-06 | 71 |
| GO:005116812 | Liver | Cirrhotic | nuclear export | 67/4634 | 154/18723 | 2.57e-07 | 6.41e-06 | 67 |
| Page: 1 2 3 4 5 6 7 |
| Pathway ID | Tissue | Disease Stage | Description | Gene Ratio | Bg Ratio | pvalue | p.adjust | qvalue | Count |
| Page: 1 |
Top |
Cell-cell communication analysis |
| Identification of potential cell-cell interactions between two cell types and their ligand-receptor pairs for different disease states |
| Ligand | Receptor | LRpair | Pathway | Tissue | Disease Stage |
| Page: 1 |
Top |
Single-cell gene regulatory network inference analysis |
| Find out the significant the regulons (TFs) and the target genes of each regulon across cell types for different disease states |
| TF | Cell Type | Tissue | Disease Stage | Target Gene | RSS | Regulon Activity |
| ∗The dot plots of a searched regulon are shown for all cell subpopulations in each disease state of each tissue based on the regulon specific score inferred using pySCENIC and by calculating the average expression. |
| Page: 1 |
Top |
Somatic mutation of malignant transformation related genes |
| Annotation of somatic variants for genes involved in malignant transformation |
| Hugo Symbol | Variant Class | Variant Classification | dbSNP RS | HGVSc | HGVSp | HGVSp Short | SWISSPROT | BIOTYPE | SIFT | PolyPhen | Tumor Sample Barcode | Tissue | Histology | Sex | Age | Stage | Therapy Types | Drugs | Outcome |
| FYTTD1 | SNV | Missense_Mutation | c.125N>A | p.Arg42Gln | p.R42Q | Q96QD9 | protein_coding | deleterious(0.05) | benign(0.207) | TCGA-AA-3984-01 | Colorectum | colon adenocarcinoma | Female | <65 | I/II | Unknown | Unknown | SD | |
| FYTTD1 | SNV | Missense_Mutation | c.218N>A | p.Gly73Glu | p.G73E | Q96QD9 | protein_coding | deleterious(0.01) | probably_damaging(1) | TCGA-AA-A00N-01 | Colorectum | colon adenocarcinoma | Male | >=65 | I/II | Unknown | Unknown | PD | |
| FYTTD1 | SNV | Missense_Mutation | c.187N>A | p.Ala63Thr | p.A63T | Q96QD9 | protein_coding | tolerated(0.63) | benign(0.007) | TCGA-AZ-6598-01 | Colorectum | colon adenocarcinoma | Female | >=65 | I/II | Unknown | Unknown | SD | |
| FYTTD1 | SNV | Missense_Mutation | rs779562426 | c.746N>A | p.Arg249Gln | p.R249Q | Q96QD9 | protein_coding | tolerated(0.12) | probably_damaging(0.992) | TCGA-AJ-A5DW-01 | Endometrium | uterine corpus endometrioid carcinoma | Female | <65 | I/II | Unknown | Unknown | SD |
| FYTTD1 | SNV | Missense_Mutation | c.880N>T | p.Arg294Trp | p.R294W | Q96QD9 | protein_coding | deleterious(0) | probably_damaging(0.998) | TCGA-AP-A059-01 | Endometrium | uterine corpus endometrioid carcinoma | Female | >=65 | I/II | Unknown | Unknown | SD | |
| FYTTD1 | SNV | Missense_Mutation | c.228N>T | p.Gln76His | p.Q76H | Q96QD9 | protein_coding | deleterious(0.01) | possibly_damaging(0.9) | TCGA-AP-A0LM-01 | Endometrium | uterine corpus endometrioid carcinoma | Female | <65 | III/IV | Chemotherapy | cisplatin | SD | |
| FYTTD1 | SNV | Missense_Mutation | novel | c.586N>T | p.Gly196Cys | p.G196C | Q96QD9 | protein_coding | deleterious(0) | probably_damaging(1) | TCGA-AP-A1DV-01 | Endometrium | uterine corpus endometrioid carcinoma | Female | <65 | I/II | Unknown | Unknown | SD |
| FYTTD1 | SNV | Missense_Mutation | c.125G>A | p.Arg42Gln | p.R42Q | Q96QD9 | protein_coding | deleterious(0.05) | benign(0.207) | TCGA-AP-A1E0-01 | Endometrium | uterine corpus endometrioid carcinoma | Female | <65 | III/IV | Chemotherapy | paclitaxel | SD | |
| FYTTD1 | SNV | Missense_Mutation | c.285G>T | p.Lys95Asn | p.K95N | Q96QD9 | protein_coding | deleterious(0) | possibly_damaging(0.883) | TCGA-AX-A06F-01 | Endometrium | uterine corpus endometrioid carcinoma | Female | <65 | III/IV | Chemotherapy | carboplatin | SD | |
| FYTTD1 | SNV | Missense_Mutation | c.647N>T | p.Arg216Ile | p.R216I | Q96QD9 | protein_coding | deleterious(0) | probably_damaging(0.998) | TCGA-AX-A0J0-01 | Endometrium | uterine corpus endometrioid carcinoma | Female | <65 | I/II | Unknown | Unknown | SD |
| Page: 1 2 3 4 |
Top |
Related drugs of malignant transformation related genes |
| Identification of chemicals and drugs interact with genes involved in malignant transfromation |
| (DGIdb 4.0) |
| Entrez ID | Symbol | Category | Interaction Types | Drug Claim Name | Drug Name | PMIDs |
| Page: 1 |

Copyright 2023-Present -The University of Texas Health Science Center at Houston |