Schematic overview of the cellular and molecular mechanisms involved in the cancer progression, including the proposed cellular and molecular mechanisms in cancer cells trajectory. AT1: alveolar type 1 cells; AT2: alveolar type 2 cells; AAH: atypical adenomatous hyperplasia; AIS: adenocarcinoma in situ; MIA: minimally invasive adenocarcinoma; IA: invasive adenocarcinoma; EMT: epithelial-mesenchymal transition

Home

Download

Statistics

Help

Contact

Center for Computational Systems Medicine
leaf

Gene summary

leaf

Malignant transformation analysis

leaf

Malignant transformation related pathway analysis

leaf

Cell-cell communication analysis

leaf

Single-cell gene regulatory network inference analysis

leaf

Somatic mutation of malignant transformation related genes

leaf

Related drugs of malignant transformation related genes

Gene: FKBP9

Gene summary for FKBP9

check button Gene summary.

Gene informationSpeciesHuman
Gene symbol

FKBP9

Gene ID

11328

Gene nameFKBP prolyl isomerase 9
Gene AliasFKBP60
Cytomap7p14.3
Gene Typeprotein-coding
GO ID

GO:0000413

UniProtAcc

A7YQ73


Top

Malignant transformation analysis

check button Identification of the aberrant gene expression in precancerous and cancerous lesions by comparing the gene expression of stem-like cells in diseased tissues with normal stem cells
check button Malignant transformation involving gene list.
Entrez IDSymbolReplicatesSpeciesOrganTissueAdj P-valueLog2FCMalignancy
11328FKBP9P22T-EHumanEsophagusESCC1.03e-356.94e-010.1236
11328FKBP9P23T-EHumanEsophagusESCC9.42e-073.90e-010.108
11328FKBP9P24T-EHumanEsophagusESCC5.80e-142.86e-010.1287
11328FKBP9P26T-EHumanEsophagusESCC3.01e-326.80e-010.1276
11328FKBP9P27T-EHumanEsophagusESCC3.55e-409.53e-010.1055
11328FKBP9P28T-EHumanEsophagusESCC2.26e-388.88e-010.1149
11328FKBP9P30T-EHumanEsophagusESCC2.13e-238.65e-010.137
11328FKBP9P31T-EHumanEsophagusESCC1.10e-457.49e-010.1251
11328FKBP9P32T-EHumanEsophagusESCC2.92e-481.05e+000.1666
11328FKBP9P36T-EHumanEsophagusESCC1.34e-125.99e-010.1187
11328FKBP9P37T-EHumanEsophagusESCC3.01e-309.02e-010.1371
11328FKBP9P39T-EHumanEsophagusESCC6.87e-032.39e-010.0894
11328FKBP9P40T-EHumanEsophagusESCC8.19e-063.96e-010.109
11328FKBP9P42T-EHumanEsophagusESCC1.61e-217.34e-010.1175
11328FKBP9P44T-EHumanEsophagusESCC3.49e-155.59e-010.1096
11328FKBP9P47T-EHumanEsophagusESCC1.05e-185.47e-010.1067
11328FKBP9P48T-EHumanEsophagusESCC7.81e-203.28e-010.0959
11328FKBP9P49T-EHumanEsophagusESCC3.29e-061.08e+000.1768
11328FKBP9P52T-EHumanEsophagusESCC7.58e-266.80e-010.1555
11328FKBP9P54T-EHumanEsophagusESCC4.06e-192.36e-010.0975
Page: 1 2 3 4 5 6 7 

check button Transcriptomic changes along malignancy continuum.
TissueExpression DynamicsAbbreviation
Colorectum (GSE201348)The image shows the transcriptomic changes along malignancy continuum.log2FC in expression of this searched gene in stem-like cells from each diseased tissue sample relative to stem-like cells in normal samples in each tissue plotted against the malignancy continuum. Samples are colored based on if they are from different disease stage.FAP: Familial adenomatous polyposis
CRC: Colorectal cancer
Colorectum (HTA11)The image shows the transcriptomic changes along malignancy continuum.log2FC in expression of this searched gene in stem-like cells from each diseased tissue sample relative to stem-like cells in normal samples in each tissue plotted against the malignancy continuum. Samples are colored based on if they are from different disease stage.AD: Adenomas
SER: Sessile serrated lesions
MSI-H: Microsatellite-high colorectal cancer
MSS: Microsatellite stable colorectal cancer
EsophagusThe image shows the transcriptomic changes along malignancy continuum.log2FC in expression of this searched gene in stem-like cells from each diseased tissue sample relative to stem-like cells in normal samples in each tissue plotted against the malignancy continuum. Samples are colored based on if they are from different disease stage.ESCC: Esophageal squamous cell carcinoma
HGIN: High-grade intraepithelial neoplasias
LGIN: Low-grade intraepithelial neoplasias
LiverThe image shows the transcriptomic changes along malignancy continuum.log2FC in expression of this searched gene in stem-like cells from each diseased tissue sample relative to stem-like cells in normal samples in each tissue plotted against the malignancy continuum. Samples are colored based on if they are from different disease stage.
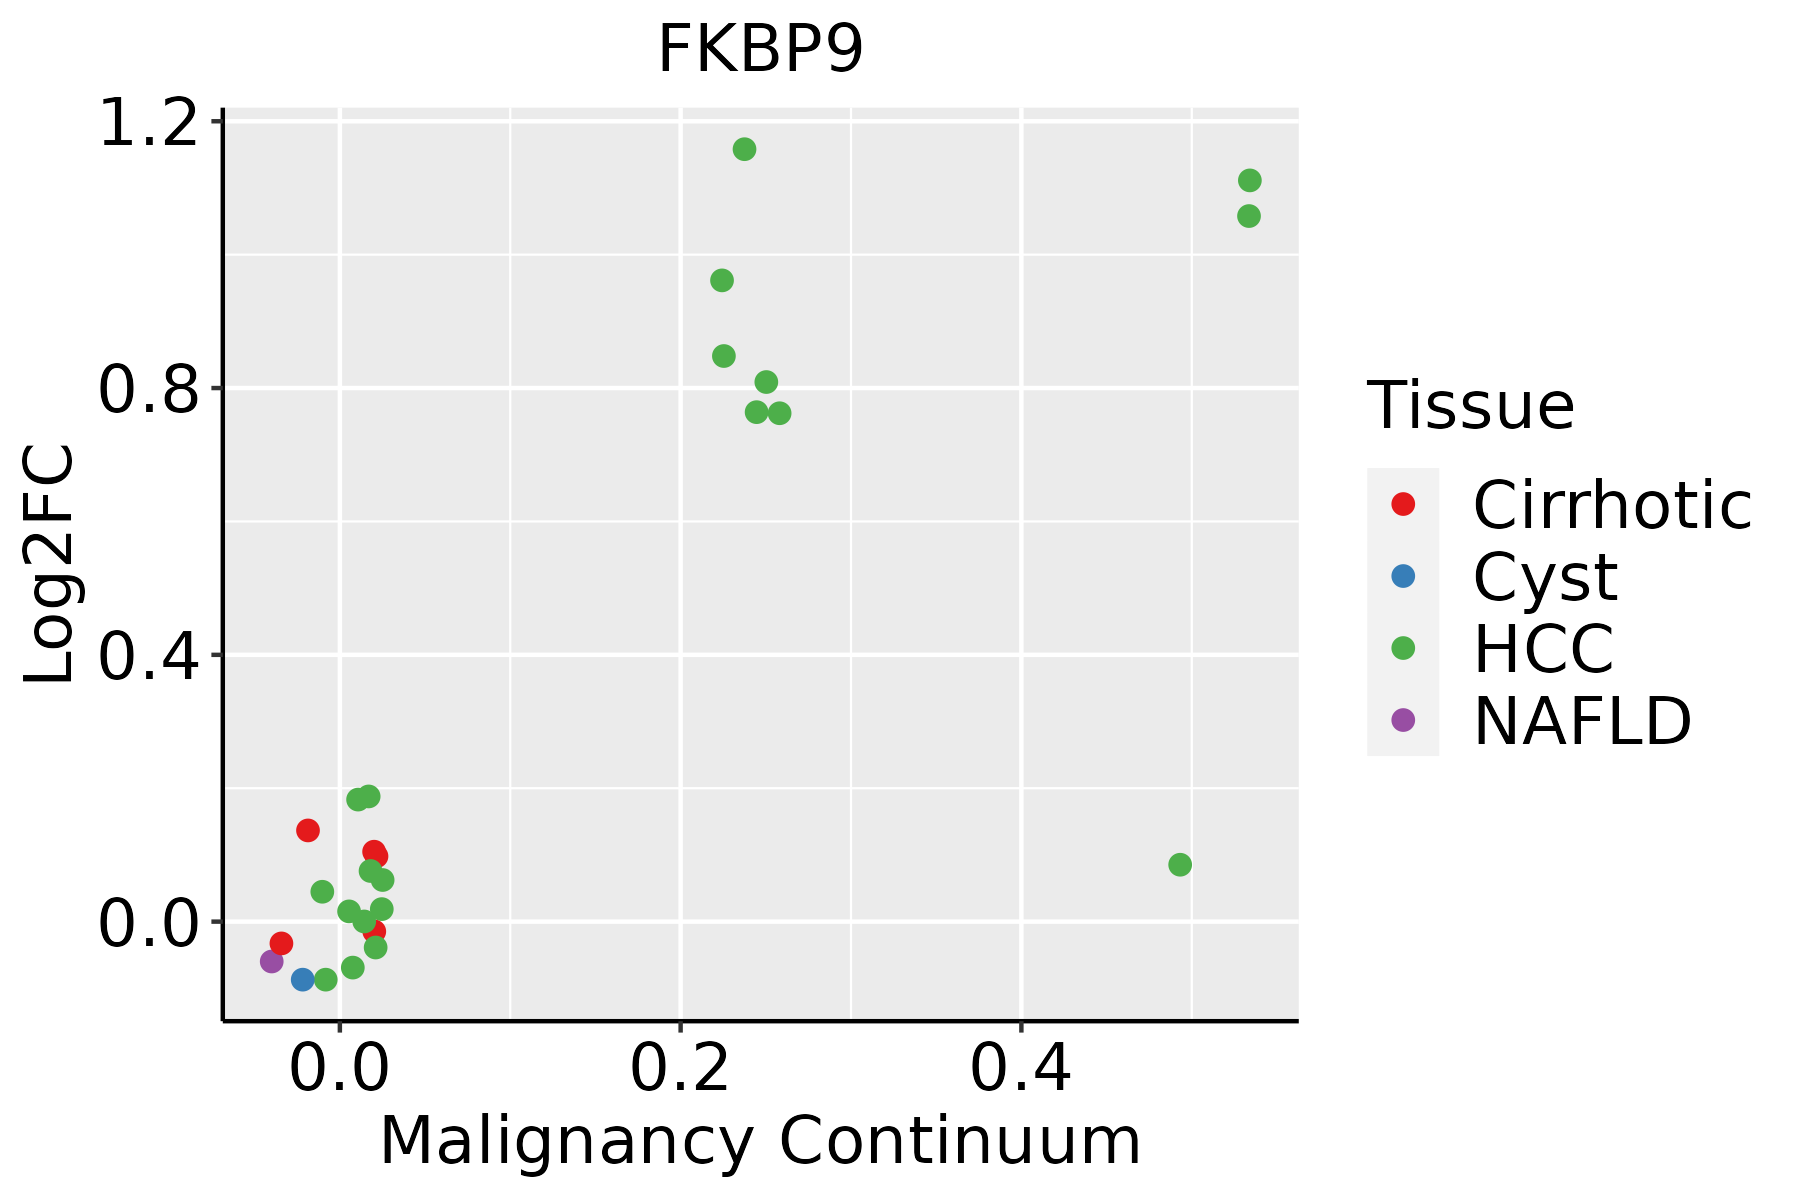
HCC: Hepatocellular carcinoma
NAFLD: Non-alcoholic fatty liver disease
Oral CavityThe image shows the transcriptomic changes along malignancy continuum.log2FC in expression of this searched gene in stem-like cells from each diseased tissue sample relative to stem-like cells in normal samples in each tissue plotted against the malignancy continuum. Samples are colored based on if they are from different disease stage.
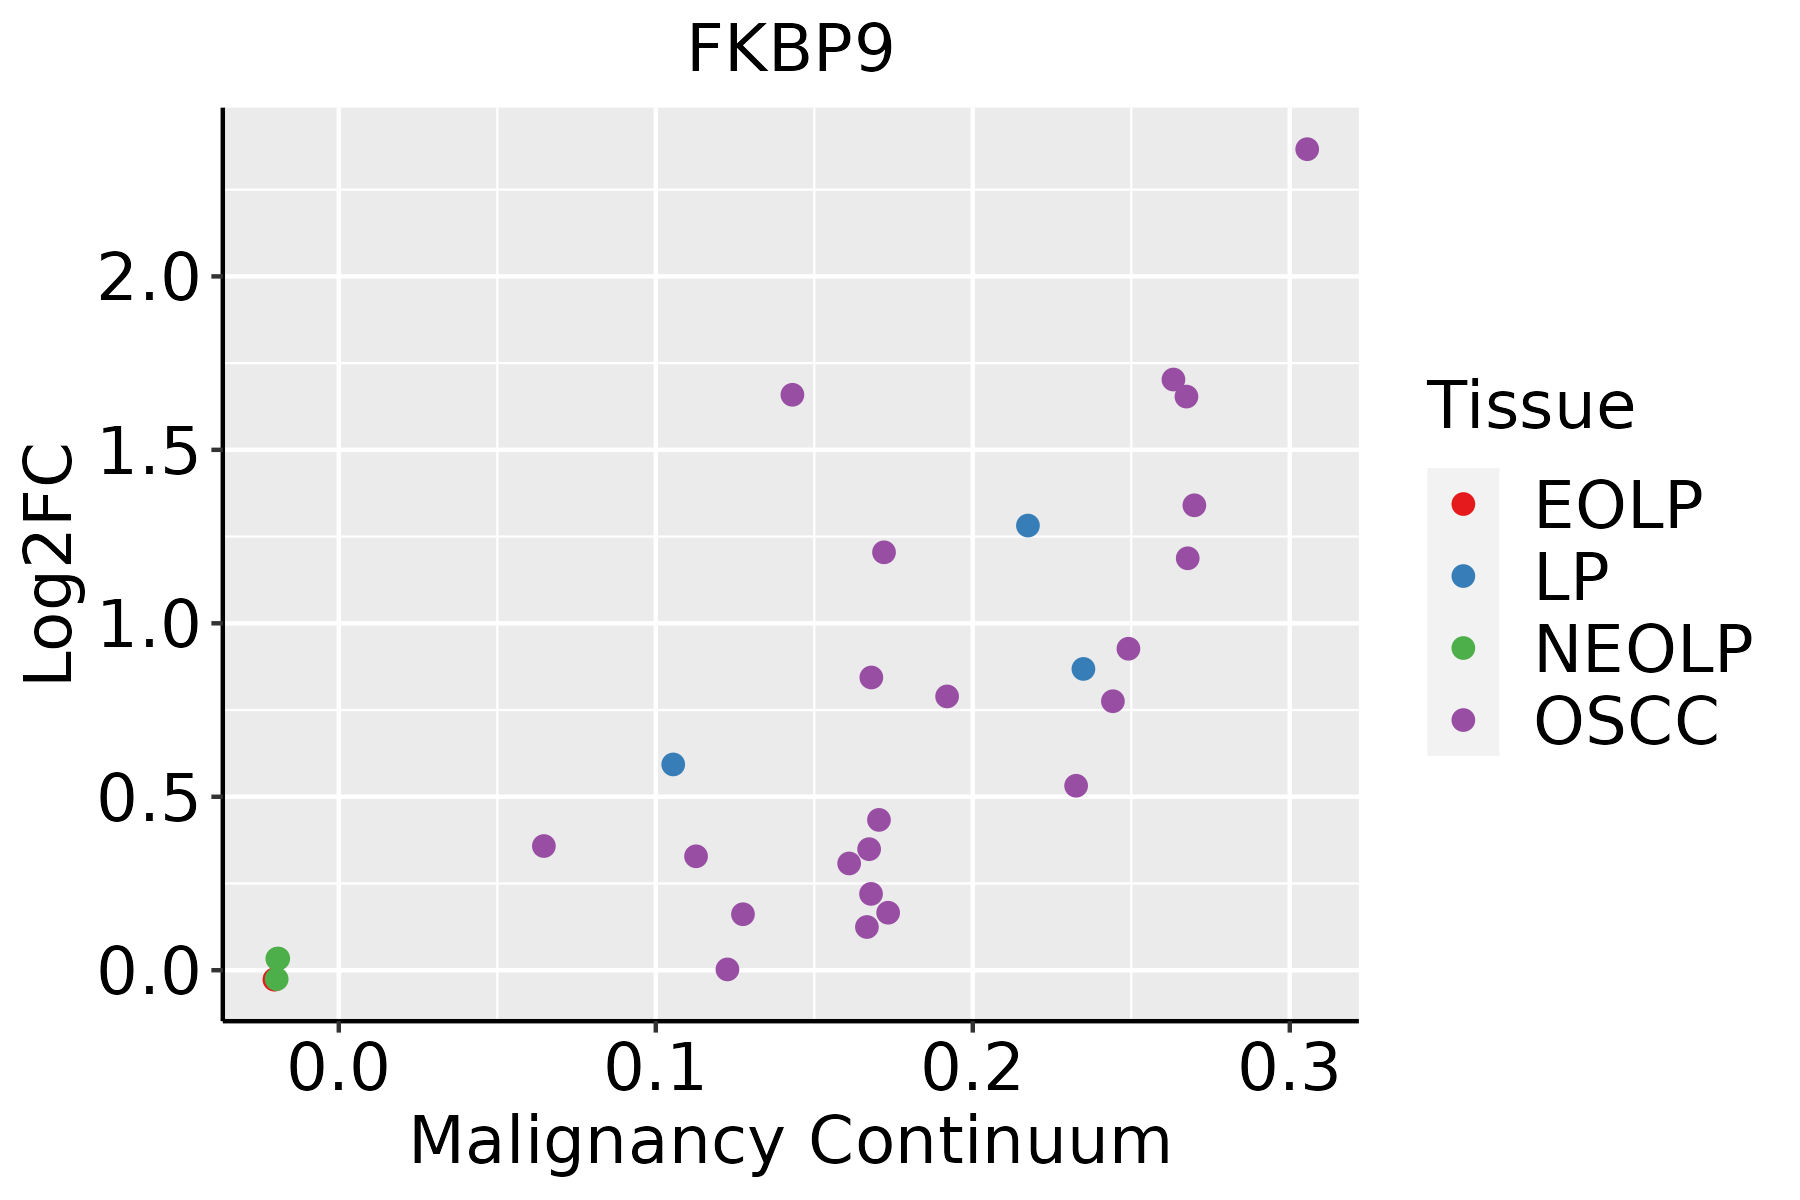
EOLP: Erosive Oral lichen planus
LP: leukoplakia
NEOLP: Non-erosive oral lichen planus
OSCC: Oral squamous cell carcinoma
ThyroidThe image shows the transcriptomic changes along malignancy continuum.log2FC in expression of this searched gene in stem-like cells from each diseased tissue sample relative to stem-like cells in normal samples in each tissue plotted against the malignancy continuum. Samples are colored based on if they are from different disease stage.
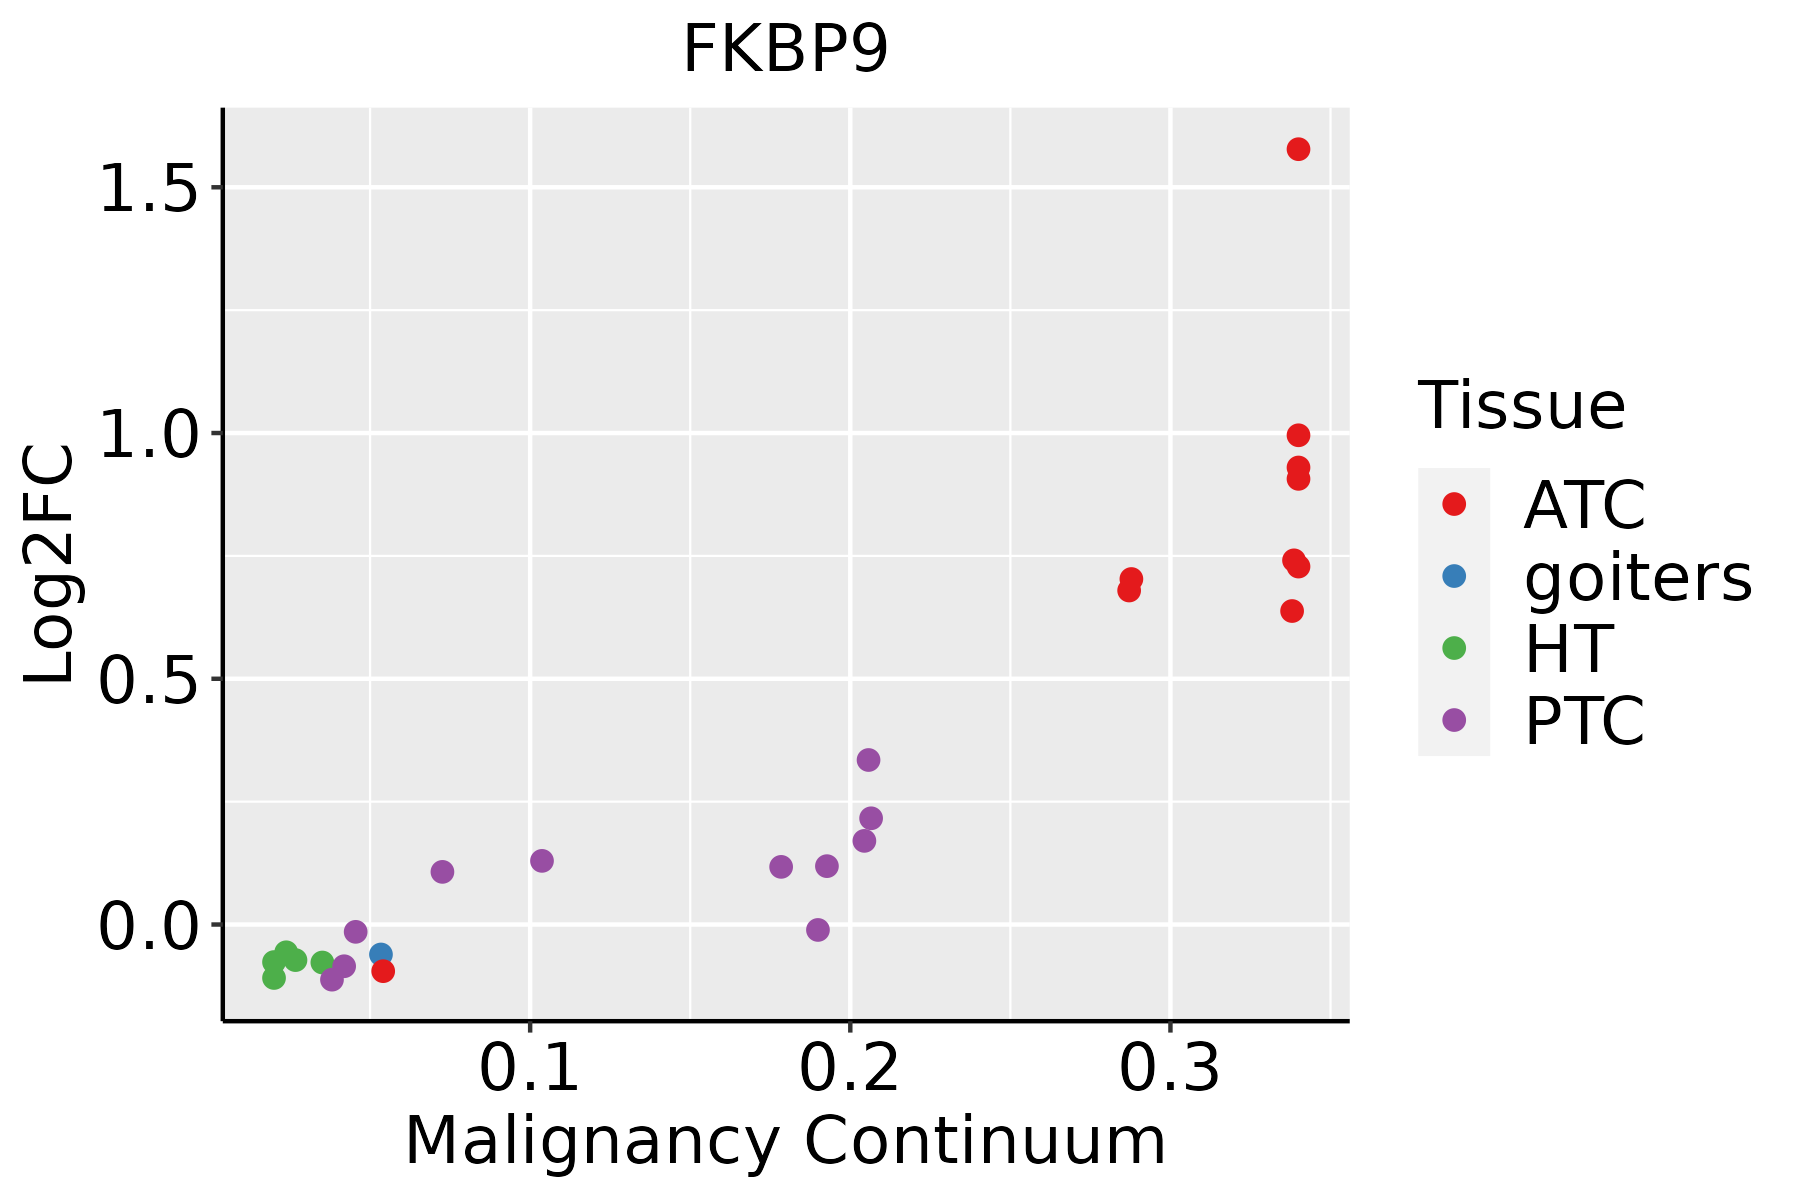
ATC: Anaplastic thyroid cancer
HT: Hashimoto's thyroiditis
PTC: Papillary thyroid cancer
∗log2FC in expression of this searched gene in stem-like cells from each diseased tissue sample relative to stem-like cells in normal samples in each tissue plotted against the malignancy continuum. Samples are colored based on if they are from different disease stage.

Top

Malignant transformation related pathway analysis

check buttonFind out the enriched GO biological processes and KEGG pathways involved in transition from healthy to precancer to cancer
check button Figure of enriched GO biological processes.
TissueDisease StageEnriched GO biological Processes
ColorectumADGO analysis - Figure of enriched GO biological processes: Top 15 enriched GO BP terms are showed in the bar plot of each disease state in each tissue. Each row represents a significant GO biological process which is colored according to the -log10(p.adjust).
ColorectumSERGO analysis - Figure of enriched GO biological processes: Top 15 enriched GO BP terms are showed in the bar plot of each disease state in each tissue. Each row represents a significant GO biological process which is colored according to the -log10(p.adjust).
ColorectumMSSGO analysis - Figure of enriched GO biological processes: Top 15 enriched GO BP terms are showed in the bar plot of each disease state in each tissue. Each row represents a significant GO biological process which is colored according to the -log10(p.adjust).
ColorectumMSI-HGO analysis - Figure of enriched GO biological processes: Top 15 enriched GO BP terms are showed in the bar plot of each disease state in each tissue. Each row represents a significant GO biological process which is colored according to the -log10(p.adjust).
ColorectumFAPGO analysis - Figure of enriched GO biological processes: Top 15 enriched GO BP terms are showed in the bar plot of each disease state in each tissue. Each row represents a significant GO biological process which is colored according to the -log10(p.adjust).
∗Top 15 enriched GO BP terms are showed in the bar plot of each disease state in each tissue. Each row represents a significant GO biological process which is colored according to the -log10(p.adjust).
Page: 1 2 3 4 5 6 7 8 9 

check button Enriched GO biological processes.
GO IDTissueDisease StageDescriptionGene RatioBg Ratiopvaluep.adjustCount
GO:0006457ColorectumADprotein folding73/3918212/187233.24e-069.10e-0573
GO:00064571ColorectumSERprotein folding54/2897212/187231.04e-042.18e-0354
GO:00064572ColorectumMSSprotein folding71/3467212/187231.25e-075.91e-0671
GO:00064574ColorectumFAPprotein folding44/2622212/187234.36e-032.98e-0244
GO:0006457110EsophagusESCCprotein folding163/8552212/187231.13e-201.74e-18163
GO:001820816EsophagusESCCpeptidyl-proline modification46/855258/187231.59e-072.51e-0646
GO:000041313EsophagusESCCprotein peptidyl-prolyl isomerization32/855242/187235.52e-054.27e-0432
GO:00064577LiverCirrhoticprotein folding114/4634212/187239.23e-202.31e-17114
GO:00182084LiverCirrhoticpeptidyl-proline modification26/463458/187236.65e-045.04e-0326
GO:00004132LiverCirrhoticprotein peptidyl-prolyl isomerization19/463442/187233.00e-031.71e-0219
GO:000645712LiverHCCprotein folding160/7958212/187231.07e-221.88e-20160
GO:001820811LiverHCCpeptidyl-proline modification42/795858/187233.73e-064.85e-0542
GO:00004131LiverHCCprotein peptidyl-prolyl isomerization31/795842/187233.83e-053.80e-0431
GO:000645718Oral cavityOSCCprotein folding154/7305212/187231.89e-234.60e-21154
GO:00182088Oral cavityOSCCpeptidyl-proline modification42/730558/187232.49e-073.92e-0642
GO:00004134Oral cavityOSCCprotein peptidyl-prolyl isomerization28/730542/187232.61e-041.67e-0328
GO:000645719Oral cavityLPprotein folding125/4623212/187231.62e-268.45e-24125
GO:001820815Oral cavityLPpeptidyl-proline modification28/462358/187238.35e-051.07e-0328
GO:000041312Oral cavityLPprotein peptidyl-prolyl isomerization22/462342/187231.04e-041.26e-0322
GO:0006457112ThyroidPTCprotein folding137/5968212/187238.29e-232.01e-20137
Page: 1 2 

check button Enriched KEGG pathways.
Pathway IDTissueDisease StageDescriptionGene RatioBg Ratiopvaluep.adjustqvalueCount
Page: 1 

Top

Cell-cell communication analysis

check buttonIdentification of potential cell-cell interactions between two cell types and their ligand-receptor pairs for different disease states
LigandReceptorLRpairPathwayTissueDisease Stage
Page: 1 

Top

Single-cell gene regulatory network inference analysis

check buttonFind out the significant the regulons (TFs) and the target genes of each regulon across cell types for different disease states
TFCell TypeTissueDisease StageTarget GeneRSSRegulon Activity
∗The dot plots of a searched regulon are shown for all cell subpopulations in each disease state of each tissue based on the regulon specific score inferred using pySCENIC and by calculating the average expression.
Page: 1 

Top

Somatic mutation of malignant transformation related genes

check buttonAnnotation of somatic variants for genes involved in malignant transformation
Hugo SymbolVariant ClassVariant ClassificationdbSNP RSHGVScHGVSpHGVSp ShortSWISSPROTBIOTYPESIFTPolyPhenTumor Sample BarcodeTissueHistologySexAgeStageTherapy TypesDrugsOutcome
FKBP9SNVMissense_Mutationnovelc.1864G>Cp.Glu622Glnp.E622QO95302protein_codingdeleterious(0)probably_damaging(0.997)TCGA-AR-A2LE-01Breastbreast invasive carcinomaFemale>=65I/IIHormone TherapytamoxiphenPD
FKBP9SNVMissense_Mutationc.966N>Cp.Glu322Aspp.E322DO95302protein_codingtolerated(0.13)benign(0.003)TCGA-E9-A1NA-01Breastbreast invasive carcinomaFemale<65I/IIChemotherapycyclophosphamideSD
FKBP9insertionFrame_Shift_Insnovelc.659_660insCAGGAGGCAGGGGACCp.Phe221ArgfsTer22p.F221Rfs*22O95302protein_codingTCGA-B6-A0IK-01Breastbreast invasive carcinomaFemale<65III/IVUnknownUnknownPD
FKBP9insertionFrame_Shift_Insnovelc.660_661insGGCACTGGAAGGGp.Phe221GlyfsTer21p.F221Gfs*21O95302protein_codingTCGA-B6-A0IK-01Breastbreast invasive carcinomaFemale<65III/IVUnknownUnknownPD
FKBP9SNVMissense_Mutationnovelc.551T>Cp.Val184Alap.V184AO95302protein_codingtolerated(0.05)benign(0.345)TCGA-2W-A8YY-01Cervixcervical & endocervical cancerFemale<65I/IIChemotherapycisplatinCR
FKBP9SNVMissense_Mutationc.1660N>Cp.Asp554Hisp.D554HO95302protein_codingdeleterious(0)probably_damaging(0.999)TCGA-EK-A2H0-01Cervixcervical & endocervical cancerFemale<65I/IIChemotherapycisplatinCR
FKBP9SNVMissense_Mutationc.1660N>Cp.Asp554Hisp.D554HO95302protein_codingdeleterious(0)probably_damaging(0.999)TCGA-ZJ-A8QQ-01Cervixcervical & endocervical cancerFemale<65I/IIChemotherapycisplatinSD
FKBP9SNVMissense_Mutationnovelc.1034N>Ap.Gly345Aspp.G345DO95302protein_codingdeleterious(0)probably_damaging(0.994)TCGA-AA-3811-01Colorectumcolon adenocarcinomaFemale>=65III/IVUnknownUnknownPD
FKBP9SNVMissense_Mutationnovelc.695A>Gp.Asp232Glyp.D232GO95302protein_codingdeleterious(0.02)probably_damaging(1)TCGA-AA-3984-01Colorectumcolon adenocarcinomaFemale<65I/IIUnknownUnknownSD
FKBP9SNVMissense_Mutationc.1442N>Ap.Gly481Glup.G481EO95302protein_codingdeleterious(0)probably_damaging(1)TCGA-AA-A00N-01Colorectumcolon adenocarcinomaMale>=65I/IIUnknownUnknownPD
Page: 1 2 3 4 5 6 

Top

Related drugs of malignant transformation related genes

check buttonIdentification of chemicals and drugs interact with genes involved in malignant transfromation
(DGIdb 4.0)
Entrez IDSymbolCategoryInteraction TypesDrug Claim NameDrug NamePMIDs
Page: 1