
|
|||||
|
 | |
| |
| |
| |
| |
| |
|
Gene: FECH |
Gene summary for FECH |
| Gene information | Species | Human | Gene symbol | FECH | Gene ID | 2235 |
| Gene name | ferrochelatase | |
| Gene Alias | EPP | |
| Cytomap | 18q21.31 | |
| Gene Type | protein-coding | GO ID | GO:0006091 | UniProtAcc | P22830 |
Top |
Malignant transformation analysis |
| Identification of the aberrant gene expression in precancerous and cancerous lesions by comparing the gene expression of stem-like cells in diseased tissues with normal stem cells |
| Entrez ID | Symbol | Replicates | Species | Organ | Tissue | Adj P-value | Log2FC | Malignancy |
| 2235 | FECH | P75T-E | Human | Esophagus | ESCC | 8.46e-03 | 9.63e-02 | 0.1125 |
| 2235 | FECH | P76T-E | Human | Esophagus | ESCC | 1.81e-07 | 1.07e-01 | 0.1207 |
| 2235 | FECH | P79T-E | Human | Esophagus | ESCC | 6.68e-12 | 2.20e-01 | 0.1154 |
| 2235 | FECH | P80T-E | Human | Esophagus | ESCC | 3.46e-07 | 2.98e-01 | 0.155 |
| 2235 | FECH | P82T-E | Human | Esophagus | ESCC | 2.38e-03 | 2.66e-01 | 0.1072 |
| 2235 | FECH | P83T-E | Human | Esophagus | ESCC | 9.24e-18 | 5.10e-01 | 0.1738 |
| 2235 | FECH | P89T-E | Human | Esophagus | ESCC | 2.64e-06 | 2.39e-01 | 0.1752 |
| 2235 | FECH | P91T-E | Human | Esophagus | ESCC | 2.02e-03 | 3.29e-01 | 0.1828 |
| 2235 | FECH | P107T-E | Human | Esophagus | ESCC | 5.06e-15 | 2.34e-01 | 0.171 |
| 2235 | FECH | P127T-E | Human | Esophagus | ESCC | 1.96e-15 | 1.39e-01 | 0.0826 |
| 2235 | FECH | P128T-E | Human | Esophagus | ESCC | 6.36e-13 | 2.03e-01 | 0.1241 |
| 2235 | FECH | P130T-E | Human | Esophagus | ESCC | 4.27e-06 | 1.58e-01 | 0.1676 |
| 2235 | FECH | HCC1_Meng | Human | Liver | HCC | 1.01e-37 | 7.85e-02 | 0.0246 |
| 2235 | FECH | HCC2 | Human | Liver | HCC | 3.29e-15 | 3.10e+00 | 0.5341 |
| 2235 | FECH | S014 | Human | Liver | HCC | 1.18e-08 | 3.50e-01 | 0.2254 |
| 2235 | FECH | S015 | Human | Liver | HCC | 1.31e-08 | 4.40e-01 | 0.2375 |
| 2235 | FECH | S016 | Human | Liver | HCC | 4.96e-06 | 2.56e-01 | 0.2243 |
| 2235 | FECH | S027 | Human | Liver | HCC | 1.49e-08 | 5.56e-01 | 0.2446 |
| 2235 | FECH | S028 | Human | Liver | HCC | 1.71e-13 | 5.30e-01 | 0.2503 |
| 2235 | FECH | S029 | Human | Liver | HCC | 1.00e-10 | 5.13e-01 | 0.2581 |
| Page: 1 2 3 |
| Tissue | Expression Dynamics | Abbreviation |
| Esophagus | 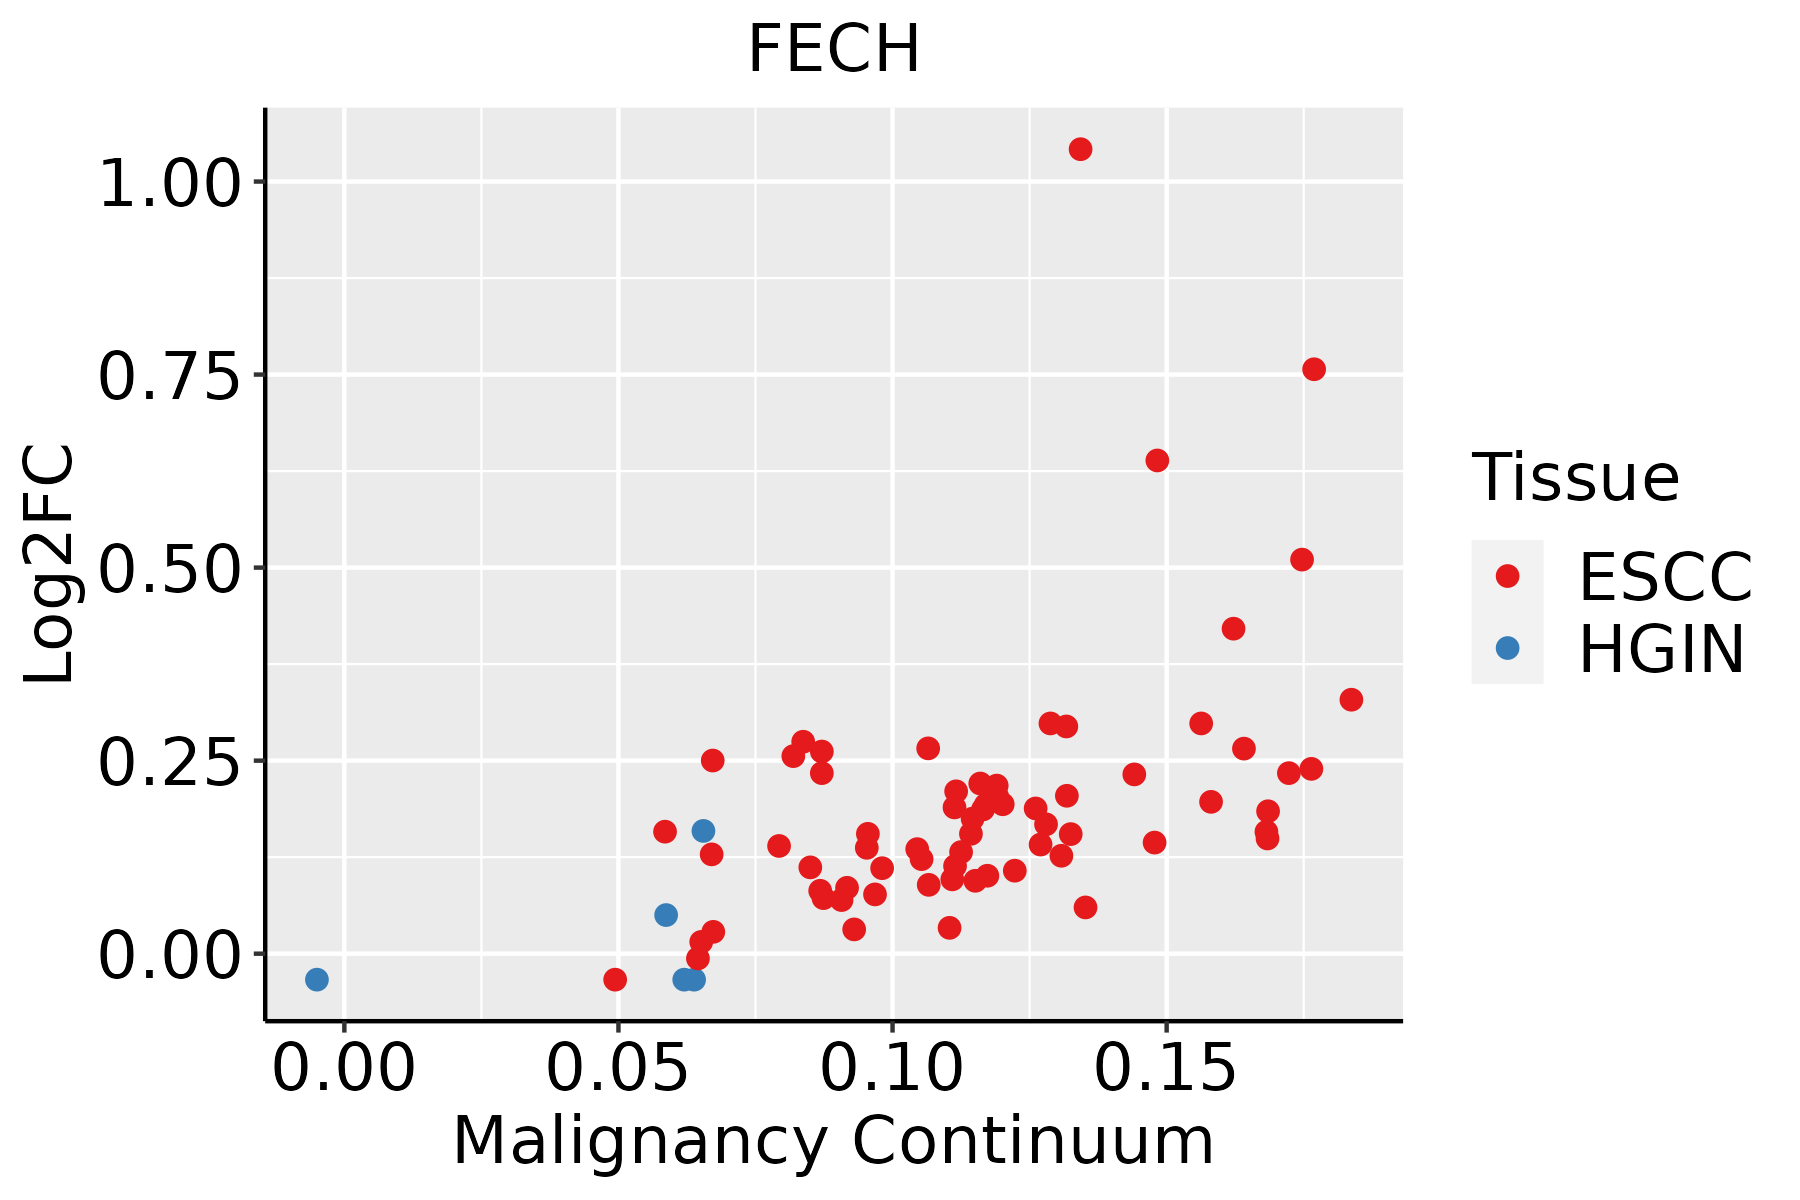 | ESCC: Esophageal squamous cell carcinoma |
| HGIN: High-grade intraepithelial neoplasias | ||
| LGIN: Low-grade intraepithelial neoplasias | ||
| Liver | 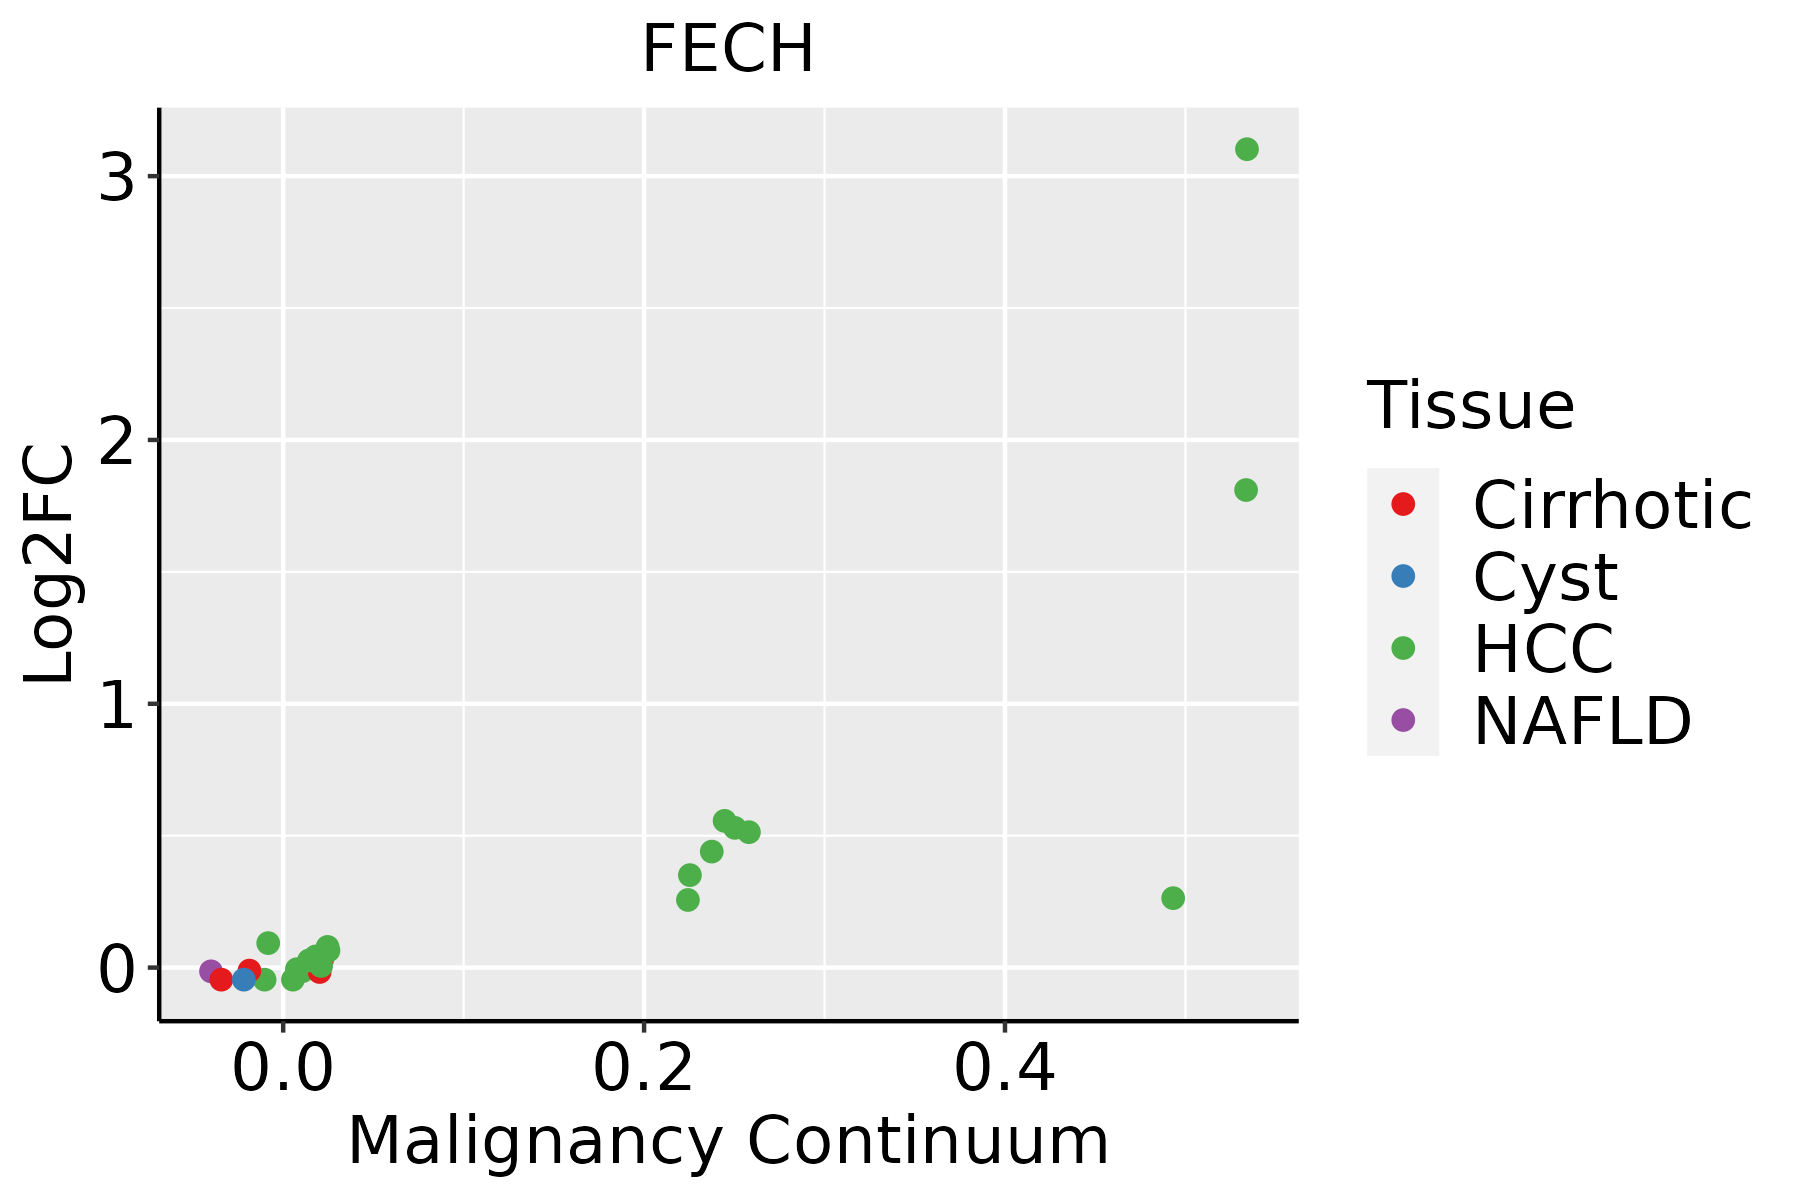 | HCC: Hepatocellular carcinoma |
| NAFLD: Non-alcoholic fatty liver disease |
| ∗log2FC in expression of this searched gene in stem-like cells from each diseased tissue sample relative to stem-like cells in normal samples in each tissue plotted against the malignancy continuum. Samples are colored based on if they are from different disease stage. |
Top |
Malignant transformation related pathway analysis |
| Find out the enriched GO biological processes and KEGG pathways involved in transition from healthy to precancer to cancer |
| Tissue | Disease Stage | Enriched GO biological Processes |
| Colorectum | AD |  |
| Colorectum | SER |  |
| Colorectum | MSS |  |
| Colorectum | MSI-H |  |
| Colorectum | FAP |  |
| ∗Top 15 enriched GO BP terms are showed in the bar plot of each disease state in each tissue. Each row represents a significant GO biological process which is colored according to the -log10(p.adjust). |
| Page: 1 2 3 4 5 6 7 8 9 |
| GO ID | Tissue | Disease Stage | Description | Gene Ratio | Bg Ratio | pvalue | p.adjust | Count |
| GO:0006091110 | Esophagus | ESCC | generation of precursor metabolites and energy | 331/8552 | 490/18723 | 3.86e-23 | 8.45e-21 | 331 |
| GO:000931419 | Esophagus | ESCC | response to radiation | 277/8552 | 456/18723 | 4.42e-11 | 1.43e-09 | 277 |
| GO:0048545111 | Esophagus | ESCC | response to steroid hormone | 204/8552 | 339/18723 | 4.47e-08 | 8.11e-07 | 204 |
| GO:004668514 | Esophagus | ESCC | response to arsenic-containing substance | 30/8552 | 33/18723 | 5.73e-08 | 1.02e-06 | 30 |
| GO:0071383110 | Esophagus | ESCC | cellular response to steroid hormone stimulus | 127/8552 | 204/18723 | 1.26e-06 | 1.55e-05 | 127 |
| GO:1901654111 | Esophagus | ESCC | response to ketone | 118/8552 | 194/18723 | 1.45e-05 | 1.31e-04 | 118 |
| GO:000941611 | Esophagus | ESCC | response to light stimulus | 183/8552 | 320/18723 | 2.03e-05 | 1.76e-04 | 183 |
| GO:000941020 | Esophagus | ESCC | response to xenobiotic stimulus | 253/8552 | 462/18723 | 4.55e-05 | 3.58e-04 | 253 |
| GO:001003827 | Esophagus | ESCC | response to metal ion | 208/8552 | 373/18723 | 5.02e-05 | 3.90e-04 | 208 |
| GO:000963620 | Esophagus | ESCC | response to toxic substance | 150/8552 | 262/18723 | 1.00e-04 | 7.12e-04 | 150 |
| GO:00067791 | Esophagus | ESCC | porphyrin-containing compound biosynthetic process | 23/8552 | 31/18723 | 1.20e-03 | 5.88e-03 | 23 |
| GO:00330141 | Esophagus | ESCC | tetrapyrrole biosynthetic process | 23/8552 | 31/18723 | 1.20e-03 | 5.88e-03 | 23 |
| GO:19016556 | Esophagus | ESCC | cellular response to ketone | 59/8552 | 96/18723 | 1.32e-03 | 6.30e-03 | 59 |
| GO:00461482 | Esophagus | ESCC | pigment biosynthetic process | 40/8552 | 62/18723 | 2.14e-03 | 9.54e-03 | 40 |
| GO:003196020 | Esophagus | ESCC | response to corticosteroid | 95/8552 | 167/18723 | 2.27e-03 | 9.99e-03 | 95 |
| GO:005138420 | Esophagus | ESCC | response to glucocorticoid | 85/8552 | 148/18723 | 2.60e-03 | 1.11e-02 | 85 |
| GO:00067832 | Esophagus | ESCC | heme biosynthetic process | 20/8552 | 27/18723 | 2.61e-03 | 1.11e-02 | 20 |
| GO:0097305111 | Esophagus | ESCC | response to alcohol | 138/8552 | 253/18723 | 2.70e-03 | 1.14e-02 | 138 |
| GO:00330132 | Esophagus | ESCC | tetrapyrrole metabolic process | 37/8552 | 59/18723 | 6.23e-03 | 2.29e-02 | 37 |
| GO:00715487 | Esophagus | ESCC | response to dexamethasone | 26/8552 | 39/18723 | 6.63e-03 | 2.43e-02 | 26 |
| Page: 1 2 3 |
| Pathway ID | Tissue | Disease Stage | Description | Gene Ratio | Bg Ratio | pvalue | p.adjust | qvalue | Count |
| hsa012405 | Esophagus | ESCC | Biosynthesis of cofactors | 97/4205 | 153/8465 | 3.88e-04 | 1.35e-03 | 6.94e-04 | 97 |
| hsa0124012 | Esophagus | ESCC | Biosynthesis of cofactors | 97/4205 | 153/8465 | 3.88e-04 | 1.35e-03 | 6.94e-04 | 97 |
| hsa012402 | Liver | HCC | Biosynthesis of cofactors | 103/4020 | 153/8465 | 4.67e-07 | 5.05e-06 | 2.81e-06 | 103 |
| hsa012403 | Liver | HCC | Biosynthesis of cofactors | 103/4020 | 153/8465 | 4.67e-07 | 5.05e-06 | 2.81e-06 | 103 |
| Page: 1 |
Top |
Cell-cell communication analysis |
| Identification of potential cell-cell interactions between two cell types and their ligand-receptor pairs for different disease states |
| Ligand | Receptor | LRpair | Pathway | Tissue | Disease Stage |
| Page: 1 |
Top |
Single-cell gene regulatory network inference analysis |
| Find out the significant the regulons (TFs) and the target genes of each regulon across cell types for different disease states |
| TF | Cell Type | Tissue | Disease Stage | Target Gene | RSS | Regulon Activity |
| ∗The dot plots of a searched regulon are shown for all cell subpopulations in each disease state of each tissue based on the regulon specific score inferred using pySCENIC and by calculating the average expression. |
| Page: 1 |
Top |
Somatic mutation of malignant transformation related genes |
| Annotation of somatic variants for genes involved in malignant transformation |
| Hugo Symbol | Variant Class | Variant Classification | dbSNP RS | HGVSc | HGVSp | HGVSp Short | SWISSPROT | BIOTYPE | SIFT | PolyPhen | Tumor Sample Barcode | Tissue | Histology | Sex | Age | Stage | Therapy Types | Drugs | Outcome |
| FECH | insertion | Frame_Shift_Ins | novel | c.1029_1030insGTAACTGACTTTTATATGAAGTTTGAGAATACAGCCTCTTCAGTTG | p.Thr344ValfsTer18 | p.T344Vfs*18 | P22830 | protein_coding | TCGA-A8-A07J-01 | Breast | breast invasive carcinoma | Female | <65 | I/II | Chemotherapy | 5-fluorouracil | CR | ||
| FECH | insertion | In_Frame_Ins | novel | c.724_725insCTGGTCTCGACCTCCTGGGCCCAG | p.Cys242delinsSerGlyLeuAspLeuLeuGlyProGly | p.C242delinsSGLDLLGPG | P22830 | protein_coding | TCGA-AN-A03Y-01 | Breast | breast invasive carcinoma | Female | >=65 | I/II | Unknown | Unknown | SD | ||
| FECH | insertion | In_Frame_Ins | novel | c.954_955insGTTTGCTGTTATGTTGTGATCAATCTGATTATTGAAATAACAAATACC | p.Gly318_Pro319insValCysCysTyrValValIleAsnLeuIleIleGluIleThrAsnThr | p.G318_P319insVCCYVVINLIIEITNT | P22830 | protein_coding | TCGA-B6-A0I6-01 | Breast | breast invasive carcinoma | Female | <65 | I/II | Unknown | Unknown | PD | ||
| FECH | SNV | Missense_Mutation | c.800C>T | p.Ser267Phe | p.S267F | P22830 | protein_coding | deleterious(0) | possibly_damaging(0.793) | TCGA-C5-A7CL-01 | Cervix | cervical & endocervical cancer | Female | <65 | III/IV | Chemotherapy | cisplatin | PD | |
| FECH | SNV | Missense_Mutation | c.181N>G | p.Gln61Glu | p.Q61E | P22830 | protein_coding | tolerated(0.18) | benign(0.003) | TCGA-HM-A4S6-01 | Cervix | cervical & endocervical cancer | Female | <65 | III/IV | Chemotherapy | cisplatin | CR | |
| FECH | SNV | Missense_Mutation | rs770820411 | c.862N>A | p.Ala288Thr | p.A288T | P22830 | protein_coding | deleterious(0.01) | possibly_damaging(0.756) | TCGA-AA-A00N-01 | Colorectum | colon adenocarcinoma | Male | >=65 | I/II | Unknown | Unknown | PD |
| FECH | SNV | Missense_Mutation | rs746310270 | c.661N>T | p.Arg221Trp | p.R221W | P22830 | protein_coding | deleterious(0.02) | possibly_damaging(0.714) | TCGA-AA-A01R-01 | Colorectum | colon adenocarcinoma | Male | <65 | III/IV | Chemotherapy | 5-fluorouracil | PD |
| FECH | SNV | Missense_Mutation | novel | c.417G>T | p.Lys139Asn | p.K139N | P22830 | protein_coding | tolerated(0.19) | possibly_damaging(0.722) | TCGA-AG-A002-01 | Colorectum | rectum adenocarcinoma | Male | <65 | I/II | Unknown | Unknown | SD |
| FECH | SNV | Missense_Mutation | rs141888884 | c.911N>A | p.Arg304Gln | p.R304Q | P22830 | protein_coding | deleterious(0.03) | probably_damaging(0.964) | TCGA-A5-A0G3-01 | Endometrium | uterine corpus endometrioid carcinoma | Female | <65 | III/IV | Chemotherapy | carboplatin | PD |
| FECH | SNV | Missense_Mutation | rs141888884 | c.911N>A | p.Arg304Gln | p.R304Q | P22830 | protein_coding | deleterious(0.03) | probably_damaging(0.964) | TCGA-AJ-A3EK-01 | Endometrium | uterine corpus endometrioid carcinoma | Female | <65 | I/II | Chemotherapy | carboplatin | CR |
| Page: 1 2 3 4 5 |
Top |
Related drugs of malignant transformation related genes |
| Identification of chemicals and drugs interact with genes involved in malignant transfromation |
| (DGIdb 4.0) |
| Entrez ID | Symbol | Category | Interaction Types | Drug Claim Name | Drug Name | PMIDs |
| 2235 | FECH | ENZYME | Methyl aminolevulinate | |||
| 2235 | FECH | ENZYME | Cholic Acid |
| Page: 1 |

Copyright 2023-Present -The University of Texas Health Science Center at Houston |