
|
|||||
|
 | |
| |
| |
| |
| |
| |
|
Gene: FCHO2 |
Gene summary for FCHO2 |
| Gene information | Species | Human | Gene symbol | FCHO2 | Gene ID | 115548 |
| Gene name | FCH and mu domain containing endocytic adaptor 2 | |
| Gene Alias | FCHO2 | |
| Cytomap | 5q13.2 | |
| Gene Type | protein-coding | GO ID | GO:0006810 | UniProtAcc | Q0JRZ9 |
Top |
Malignant transformation analysis |
| Identification of the aberrant gene expression in precancerous and cancerous lesions by comparing the gene expression of stem-like cells in diseased tissues with normal stem cells |
| Entrez ID | Symbol | Replicates | Species | Organ | Tissue | Adj P-value | Log2FC | Malignancy |
| 115548 | FCHO2 | RNA-P25T1-P25T1-4 | Human | Lung | AIS | 1.26e-10 | 6.46e-01 | -0.2119 |
| 115548 | FCHO2 | RNA-P6T2-P6T2-1 | Human | Lung | IAC | 6.96e-19 | 7.08e-01 | -0.0166 |
| 115548 | FCHO2 | RNA-P6T2-P6T2-2 | Human | Lung | IAC | 3.50e-35 | 8.96e-01 | -0.0132 |
| 115548 | FCHO2 | RNA-P6T2-P6T2-3 | Human | Lung | IAC | 2.15e-34 | 9.16e-01 | -0.013 |
| 115548 | FCHO2 | RNA-P6T2-P6T2-4 | Human | Lung | IAC | 9.58e-29 | 8.65e-01 | -0.0121 |
| 115548 | FCHO2 | RNA-P7T1-P7T1-2 | Human | Lung | AIS | 8.62e-03 | 4.86e-01 | -0.0876 |
| 115548 | FCHO2 | RNA-P7T1-P7T1-3 | Human | Lung | AIS | 5.27e-05 | 7.51e-01 | -0.0822 |
| 115548 | FCHO2 | RNA-P7T1-P7T1-4 | Human | Lung | AIS | 6.21e-03 | 5.37e-01 | -0.0809 |
| 115548 | FCHO2 | male-WTA | Human | Thyroid | PTC | 7.56e-18 | 1.70e-01 | 0.1037 |
| 115548 | FCHO2 | PTC01 | Human | Thyroid | PTC | 2.63e-04 | 5.44e-02 | 0.1899 |
| 115548 | FCHO2 | PTC03 | Human | Thyroid | PTC | 3.42e-10 | 4.37e-01 | 0.1784 |
| 115548 | FCHO2 | PTC04 | Human | Thyroid | PTC | 3.36e-46 | 9.98e-01 | 0.1927 |
| 115548 | FCHO2 | PTC05 | Human | Thyroid | PTC | 4.62e-25 | 9.66e-01 | 0.2065 |
| 115548 | FCHO2 | PTC06 | Human | Thyroid | PTC | 3.86e-26 | 7.54e-01 | 0.2057 |
| 115548 | FCHO2 | PTC07 | Human | Thyroid | PTC | 5.09e-39 | 6.67e-01 | 0.2044 |
| 115548 | FCHO2 | ATC12 | Human | Thyroid | ATC | 8.59e-06 | 5.79e-02 | 0.34 |
| 115548 | FCHO2 | ATC13 | Human | Thyroid | ATC | 1.91e-16 | 3.59e-01 | 0.34 |
| 115548 | FCHO2 | ATC2 | Human | Thyroid | ATC | 9.05e-05 | 3.52e-01 | 0.34 |
| 115548 | FCHO2 | ATC4 | Human | Thyroid | ATC | 5.20e-09 | 1.11e-01 | 0.34 |
| 115548 | FCHO2 | ATC5 | Human | Thyroid | ATC | 6.78e-31 | 4.00e-01 | 0.34 |
| Page: 1 2 3 |
| Tissue | Expression Dynamics | Abbreviation |
| Cervix | 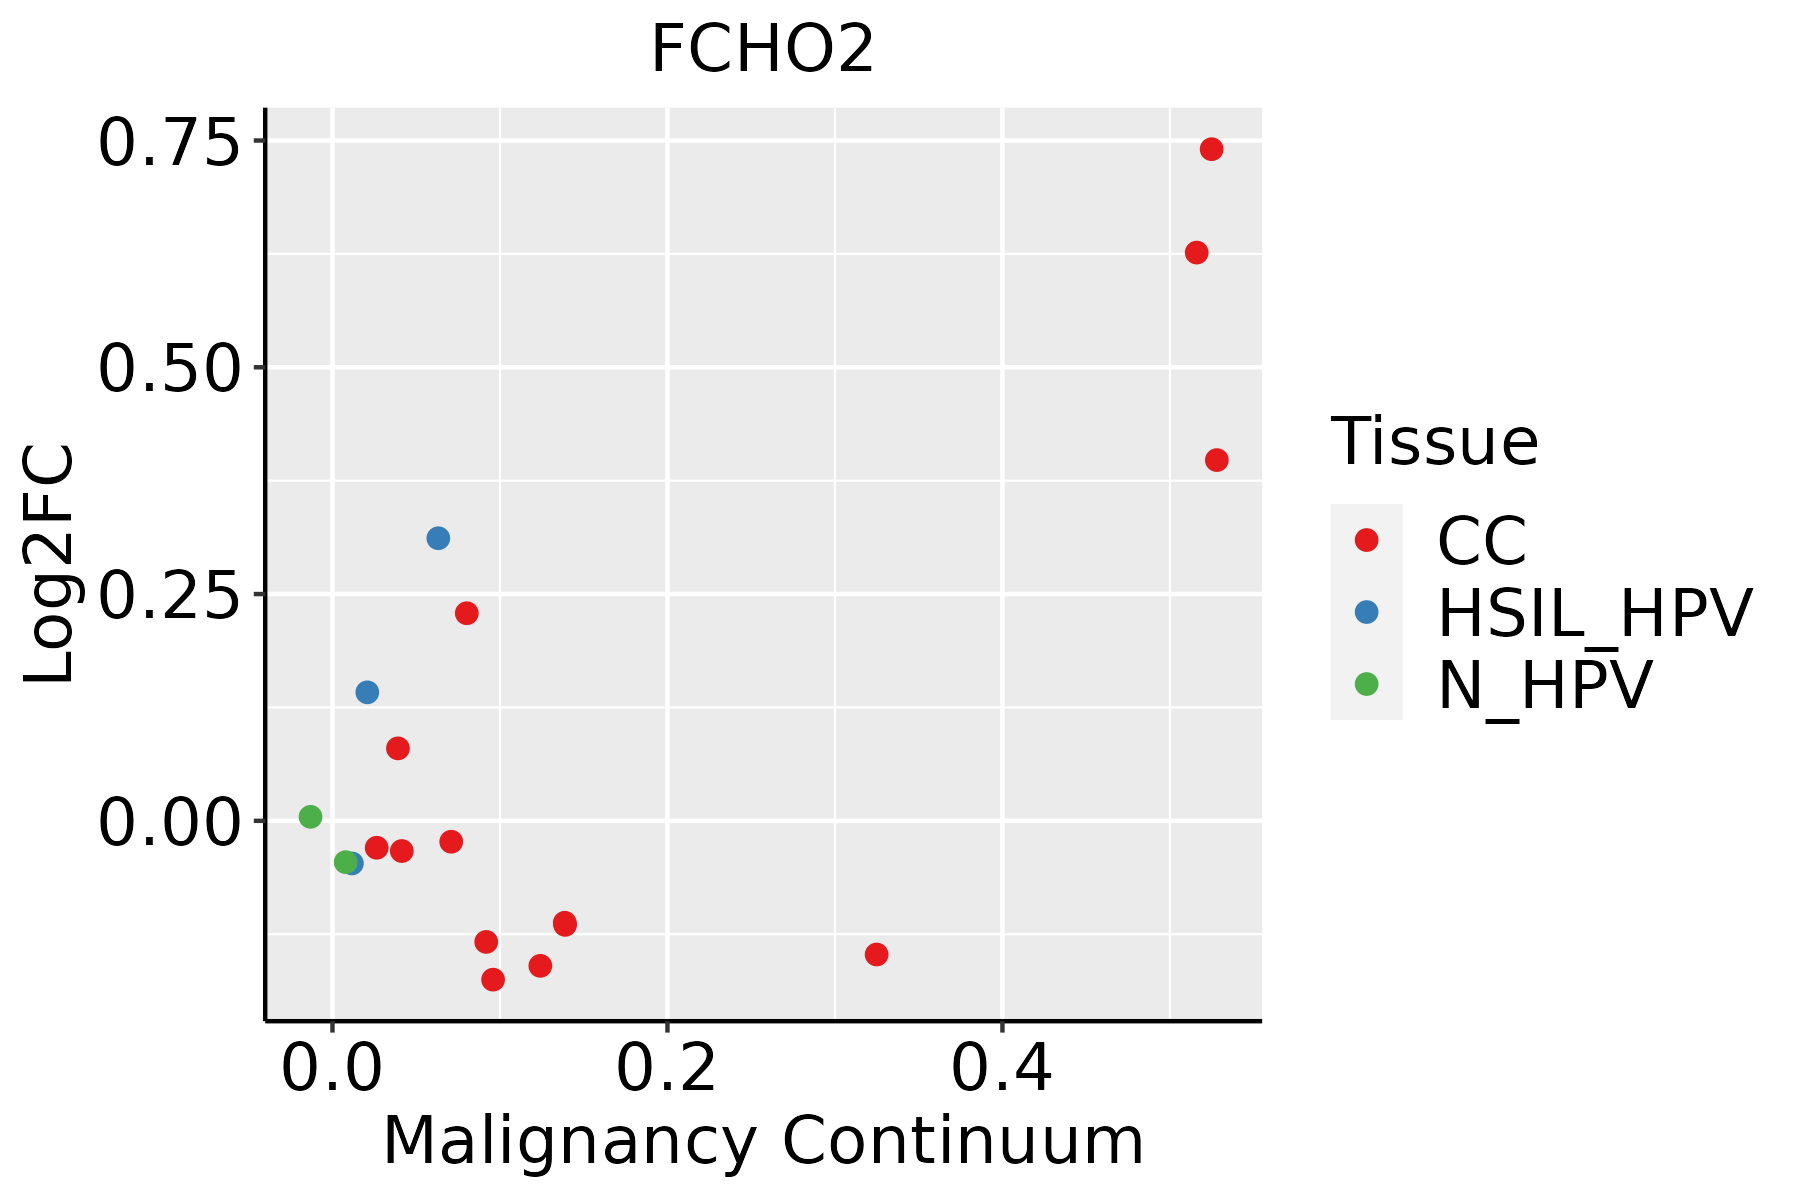 | CC: Cervix cancer |
| HSIL_HPV: HPV-infected high-grade squamous intraepithelial lesions | ||
| N_HPV: HPV-infected normal cervix | ||
| Colorectum (GSE201348) |  | FAP: Familial adenomatous polyposis |
| CRC: Colorectal cancer | ||
| Colorectum (HTA11) |  | AD: Adenomas |
| SER: Sessile serrated lesions | ||
| MSI-H: Microsatellite-high colorectal cancer | ||
| MSS: Microsatellite stable colorectal cancer | ||
| Lung | 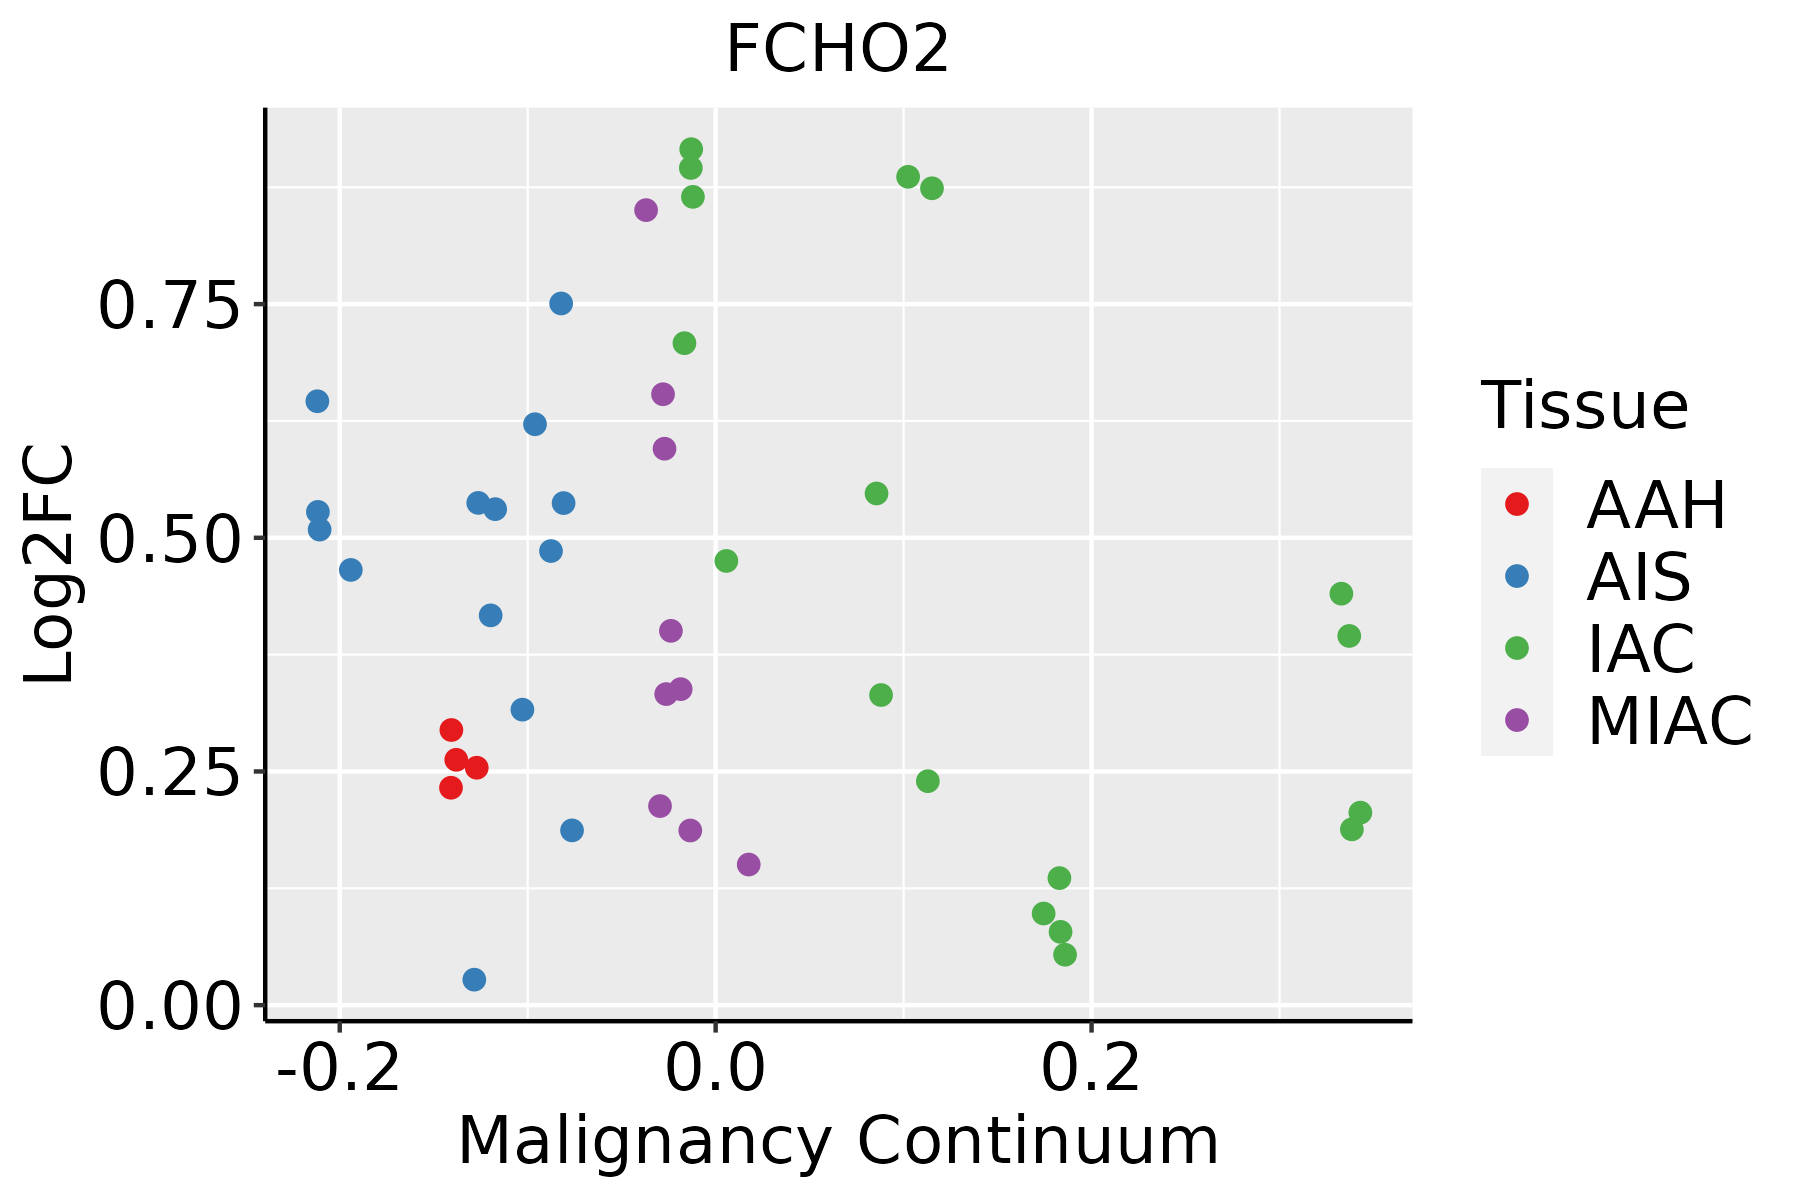 | AAH: Atypical adenomatous hyperplasia |
| AIS: Adenocarcinoma in situ | ||
| IAC: Invasive lung adenocarcinoma | ||
| MIA: Minimally invasive adenocarcinoma | ||
| Thyroid |  | ATC: Anaplastic thyroid cancer |
| HT: Hashimoto's thyroiditis | ||
| PTC: Papillary thyroid cancer |
| ∗log2FC in expression of this searched gene in stem-like cells from each diseased tissue sample relative to stem-like cells in normal samples in each tissue plotted against the malignancy continuum. Samples are colored based on if they are from different disease stage. |
Top |
Malignant transformation related pathway analysis |
| Find out the enriched GO biological processes and KEGG pathways involved in transition from healthy to precancer to cancer |
| Tissue | Disease Stage | Enriched GO biological Processes |
| Colorectum | AD |  |
| Colorectum | SER |  |
| Colorectum | MSS |  |
| Colorectum | MSI-H |  |
| Colorectum | FAP |  |
| ∗Top 15 enriched GO BP terms are showed in the bar plot of each disease state in each tissue. Each row represents a significant GO biological process which is colored according to the -log10(p.adjust). |
| Page: 1 2 3 4 5 6 7 8 9 |
| GO ID | Tissue | Disease Stage | Description | Gene Ratio | Bg Ratio | pvalue | p.adjust | Count |
| GO:007265910 | Cervix | CC | protein localization to plasma membrane | 73/2311 | 284/18723 | 4.95e-10 | 6.73e-08 | 73 |
| GO:19907788 | Cervix | CC | protein localization to cell periphery | 78/2311 | 333/18723 | 1.22e-08 | 9.73e-07 | 78 |
| GO:00068987 | Cervix | CC | receptor-mediated endocytosis | 53/2311 | 244/18723 | 2.52e-05 | 4.29e-04 | 53 |
| GO:00725836 | Cervix | CC | clathrin-dependent endocytosis | 16/2311 | 47/18723 | 9.56e-05 | 1.25e-03 | 16 |
| GO:00484883 | Cervix | CC | synaptic vesicle endocytosis | 16/2311 | 62/18723 | 2.87e-03 | 1.91e-02 | 16 |
| GO:01402383 | Cervix | CC | presynaptic endocytosis | 16/2311 | 62/18723 | 2.87e-03 | 1.91e-02 | 16 |
| GO:00482686 | Cervix | CC | clathrin coat assembly | 7/2311 | 18/18723 | 3.99e-03 | 2.48e-02 | 7 |
| GO:00364655 | Cervix | CC | synaptic vesicle recycling | 17/2311 | 75/18723 | 8.87e-03 | 4.53e-02 | 17 |
| GO:00103243 | Cervix | CC | membrane invagination | 28/2311 | 144/18723 | 9.50e-03 | 4.72e-02 | 28 |
| GO:001032411 | Cervix | HSIL_HPV | membrane invagination | 17/737 | 144/18723 | 5.28e-05 | 1.30e-03 | 17 |
| GO:000689814 | Cervix | HSIL_HPV | receptor-mediated endocytosis | 20/737 | 244/18723 | 1.64e-03 | 1.78e-02 | 20 |
| GO:007265913 | Cervix | HSIL_HPV | protein localization to plasma membrane | 21/737 | 284/18723 | 4.36e-03 | 3.68e-02 | 21 |
| GO:0072659 | Colorectum | AD | protein localization to plasma membrane | 122/3918 | 284/18723 | 2.86e-17 | 1.49e-14 | 122 |
| GO:1990778 | Colorectum | AD | protein localization to cell periphery | 129/3918 | 333/18723 | 5.51e-14 | 1.15e-11 | 129 |
| GO:0072583 | Colorectum | AD | clathrin-dependent endocytosis | 24/3918 | 47/18723 | 4.60e-06 | 1.22e-04 | 24 |
| GO:0006898 | Colorectum | AD | receptor-mediated endocytosis | 76/3918 | 244/18723 | 1.07e-04 | 1.59e-03 | 76 |
| GO:0048268 | Colorectum | AD | clathrin coat assembly | 10/3918 | 18/18723 | 1.31e-03 | 1.15e-02 | 10 |
| GO:0099003 | Colorectum | AD | vesicle-mediated transport in synapse | 57/3918 | 200/18723 | 6.53e-03 | 4.06e-02 | 57 |
| GO:00726592 | Colorectum | MSS | protein localization to plasma membrane | 113/3467 | 284/18723 | 3.23e-17 | 1.55e-14 | 113 |
| GO:19907782 | Colorectum | MSS | protein localization to cell periphery | 120/3467 | 333/18723 | 2.02e-14 | 5.47e-12 | 120 |
| Page: 1 2 3 4 |
| Pathway ID | Tissue | Disease Stage | Description | Gene Ratio | Bg Ratio | pvalue | p.adjust | qvalue | Count |
| Page: 1 |
Top |
Cell-cell communication analysis |
| Identification of potential cell-cell interactions between two cell types and their ligand-receptor pairs for different disease states |
| Ligand | Receptor | LRpair | Pathway | Tissue | Disease Stage |
| Page: 1 |
Top |
Single-cell gene regulatory network inference analysis |
| Find out the significant the regulons (TFs) and the target genes of each regulon across cell types for different disease states |
| TF | Cell Type | Tissue | Disease Stage | Target Gene | RSS | Regulon Activity |
| ∗The dot plots of a searched regulon are shown for all cell subpopulations in each disease state of each tissue based on the regulon specific score inferred using pySCENIC and by calculating the average expression. |
| Page: 1 |
Top |
Somatic mutation of malignant transformation related genes |
| Annotation of somatic variants for genes involved in malignant transformation |
| Hugo Symbol | Variant Class | Variant Classification | dbSNP RS | HGVSc | HGVSp | HGVSp Short | SWISSPROT | BIOTYPE | SIFT | PolyPhen | Tumor Sample Barcode | Tissue | Histology | Sex | Age | Stage | Therapy Types | Drugs | Outcome |
| FCHO2 | SNV | Missense_Mutation | c.634N>G | p.His212Asp | p.H212D | Q0JRZ9 | protein_coding | deleterious(0) | benign(0.043) | TCGA-AC-A23H-01 | Breast | breast invasive carcinoma | Female | >=65 | I/II | Unknown | Unknown | PD | |
| FCHO2 | SNV | Missense_Mutation | novel | c.1714N>T | p.Asp572Tyr | p.D572Y | Q0JRZ9 | protein_coding | deleterious(0) | probably_damaging(0.936) | TCGA-AN-A046-01 | Breast | breast invasive carcinoma | Female | >=65 | I/II | Unknown | Unknown | SD |
| FCHO2 | SNV | Missense_Mutation | c.830N>T | p.Ser277Ile | p.S277I | Q0JRZ9 | protein_coding | tolerated(0.47) | benign(0.001) | TCGA-D8-A140-01 | Breast | breast invasive carcinoma | Female | <65 | I/II | Chemotherapy | doxorubicin+cyclophosphamid | SD | |
| FCHO2 | SNV | Missense_Mutation | novel | c.1225A>G | p.Lys409Glu | p.K409E | Q0JRZ9 | protein_coding | tolerated(0.16) | benign(0.039) | TCGA-2W-A8YY-01 | Cervix | cervical & endocervical cancer | Female | <65 | I/II | Chemotherapy | cisplatin | CR |
| FCHO2 | SNV | Missense_Mutation | novel | c.1981G>A | p.Val661Ile | p.V661I | Q0JRZ9 | protein_coding | tolerated(0.24) | possibly_damaging(0.549) | TCGA-2W-A8YY-01 | Cervix | cervical & endocervical cancer | Female | <65 | I/II | Chemotherapy | cisplatin | CR |
| FCHO2 | SNV | Missense_Mutation | c.607N>G | p.Gln203Glu | p.Q203E | Q0JRZ9 | protein_coding | deleterious(0) | benign(0.06) | TCGA-DR-A0ZM-01 | Cervix | cervical & endocervical cancer | Female | <65 | III/IV | Unspecific | Cisplatin | SD | |
| FCHO2 | SNV | Missense_Mutation | novel | c.1223N>T | p.Thr408Ile | p.T408I | Q0JRZ9 | protein_coding | tolerated(0.19) | benign(0.143) | TCGA-VS-A9V4-01 | Cervix | cervical & endocervical cancer | Female | <65 | I/II | Chemotherapy | cisplatin | PD |
| FCHO2 | SNV | Missense_Mutation | c.1789N>G | p.Arg597Gly | p.R597G | Q0JRZ9 | protein_coding | deleterious(0) | possibly_damaging(0.809) | TCGA-A6-2686-01 | Colorectum | colon adenocarcinoma | Female | >=65 | I/II | Unknown | Unknown | SD | |
| FCHO2 | SNV | Missense_Mutation | c.2047A>G | p.Thr683Ala | p.T683A | Q0JRZ9 | protein_coding | tolerated(0.72) | benign(0.246) | TCGA-AA-3715-01 | Colorectum | colon adenocarcinoma | Male | >=65 | I/II | Unknown | Unknown | PD | |
| FCHO2 | SNV | Missense_Mutation | c.1132A>C | p.Lys378Gln | p.K378Q | Q0JRZ9 | protein_coding | deleterious(0) | benign(0.419) | TCGA-AA-3977-01 | Colorectum | colon adenocarcinoma | Male | >=65 | I/II | Unknown | Unknown | SD |
| Page: 1 2 3 4 5 6 7 8 9 |
Top |
Related drugs of malignant transformation related genes |
| Identification of chemicals and drugs interact with genes involved in malignant transfromation |
| (DGIdb 4.0) |
| Entrez ID | Symbol | Category | Interaction Types | Drug Claim Name | Drug Name | PMIDs |
| Page: 1 |

Copyright 2023-Present -The University of Texas Health Science Center at Houston |