Schematic overview of the cellular and molecular mechanisms involved in the cancer progression, including the proposed cellular and molecular mechanisms in cancer cells trajectory. AT1: alveolar type 1 cells; AT2: alveolar type 2 cells; AAH: atypical adenomatous hyperplasia; AIS: adenocarcinoma in situ; MIA: minimally invasive adenocarcinoma; IA: invasive adenocarcinoma; EMT: epithelial-mesenchymal transition

Home

Download

Statistics

Help

Contact

Center for Computational Systems Medicine
leaf

Gene summary

leaf

Malignant transformation analysis

leaf

Malignant transformation related pathway analysis

leaf

Cell-cell communication analysis

leaf

Single-cell gene regulatory network inference analysis

leaf

Somatic mutation of malignant transformation related genes

leaf

Related drugs of malignant transformation related genes

Gene: FBXL12

Gene summary for FBXL12

check button Gene summary.

Gene informationSpeciesHuman
Gene symbol

FBXL12

Gene ID

54850

Gene nameF-box and leucine rich repeat protein 12
Gene AliasFbl12
Cytomap19p13.2
Gene Typeprotein-coding
GO ID

GO:0000086

UniProtAcc

Q9NXK8


Top

Malignant transformation analysis

check button Identification of the aberrant gene expression in precancerous and cancerous lesions by comparing the gene expression of stem-like cells in diseased tissues with normal stem cells
check button Malignant transformation involving gene list.
Entrez IDSymbolReplicatesSpeciesOrganTissueAdj P-valueLog2FCMalignancy
54850FBXL12P54T-EHumanEsophagusESCC1.86e-255.53e-010.0975
54850FBXL12P56T-EHumanEsophagusESCC1.57e-024.88e-010.1613
54850FBXL12P57T-EHumanEsophagusESCC7.07e-142.35e-010.0926
54850FBXL12P61T-EHumanEsophagusESCC3.18e-226.54e-010.099
54850FBXL12P62T-EHumanEsophagusESCC8.12e-459.60e-010.1302
54850FBXL12P65T-EHumanEsophagusESCC5.30e-123.03e-010.0978
54850FBXL12P74T-EHumanEsophagusESCC5.46e-185.43e-010.1479
54850FBXL12P75T-EHumanEsophagusESCC4.65e-468.18e-010.1125
54850FBXL12P76T-EHumanEsophagusESCC6.08e-112.37e-010.1207
54850FBXL12P79T-EHumanEsophagusESCC2.77e-294.56e-010.1154
54850FBXL12P80T-EHumanEsophagusESCC1.28e-301.01e+000.155
54850FBXL12P82T-EHumanEsophagusESCC1.91e-124.06e-010.1072
54850FBXL12P83T-EHumanEsophagusESCC4.91e-267.39e-010.1738
54850FBXL12P84T-EHumanEsophagusESCC4.02e-054.14e-010.0933
54850FBXL12P89T-EHumanEsophagusESCC1.10e-135.26e-010.1752
54850FBXL12P91T-EHumanEsophagusESCC5.37e-131.04e+000.1828
54850FBXL12P107T-EHumanEsophagusESCC5.75e-347.36e-010.171
54850FBXL12P126T-EHumanEsophagusESCC6.37e-033.45e-010.1125
54850FBXL12P127T-EHumanEsophagusESCC1.06e-152.79e-010.0826
54850FBXL12P128T-EHumanEsophagusESCC2.03e-258.28e-010.1241
Page: 1 2 3 4 5 

check button Transcriptomic changes along malignancy continuum.
TissueExpression DynamicsAbbreviation
Colorectum (GSE201348)The image shows the transcriptomic changes along malignancy continuum.log2FC in expression of this searched gene in stem-like cells from each diseased tissue sample relative to stem-like cells in normal samples in each tissue plotted against the malignancy continuum. Samples are colored based on if they are from different disease stage.FAP: Familial adenomatous polyposis
CRC: Colorectal cancer
Colorectum (HTA11)The image shows the transcriptomic changes along malignancy continuum.log2FC in expression of this searched gene in stem-like cells from each diseased tissue sample relative to stem-like cells in normal samples in each tissue plotted against the malignancy continuum. Samples are colored based on if they are from different disease stage.AD: Adenomas
SER: Sessile serrated lesions
MSI-H: Microsatellite-high colorectal cancer
MSS: Microsatellite stable colorectal cancer
EsophagusThe image shows the transcriptomic changes along malignancy continuum.log2FC in expression of this searched gene in stem-like cells from each diseased tissue sample relative to stem-like cells in normal samples in each tissue plotted against the malignancy continuum. Samples are colored based on if they are from different disease stage.ESCC: Esophageal squamous cell carcinoma
HGIN: High-grade intraepithelial neoplasias
LGIN: Low-grade intraepithelial neoplasias
Oral CavityThe image shows the transcriptomic changes along malignancy continuum.log2FC in expression of this searched gene in stem-like cells from each diseased tissue sample relative to stem-like cells in normal samples in each tissue plotted against the malignancy continuum. Samples are colored based on if they are from different disease stage.
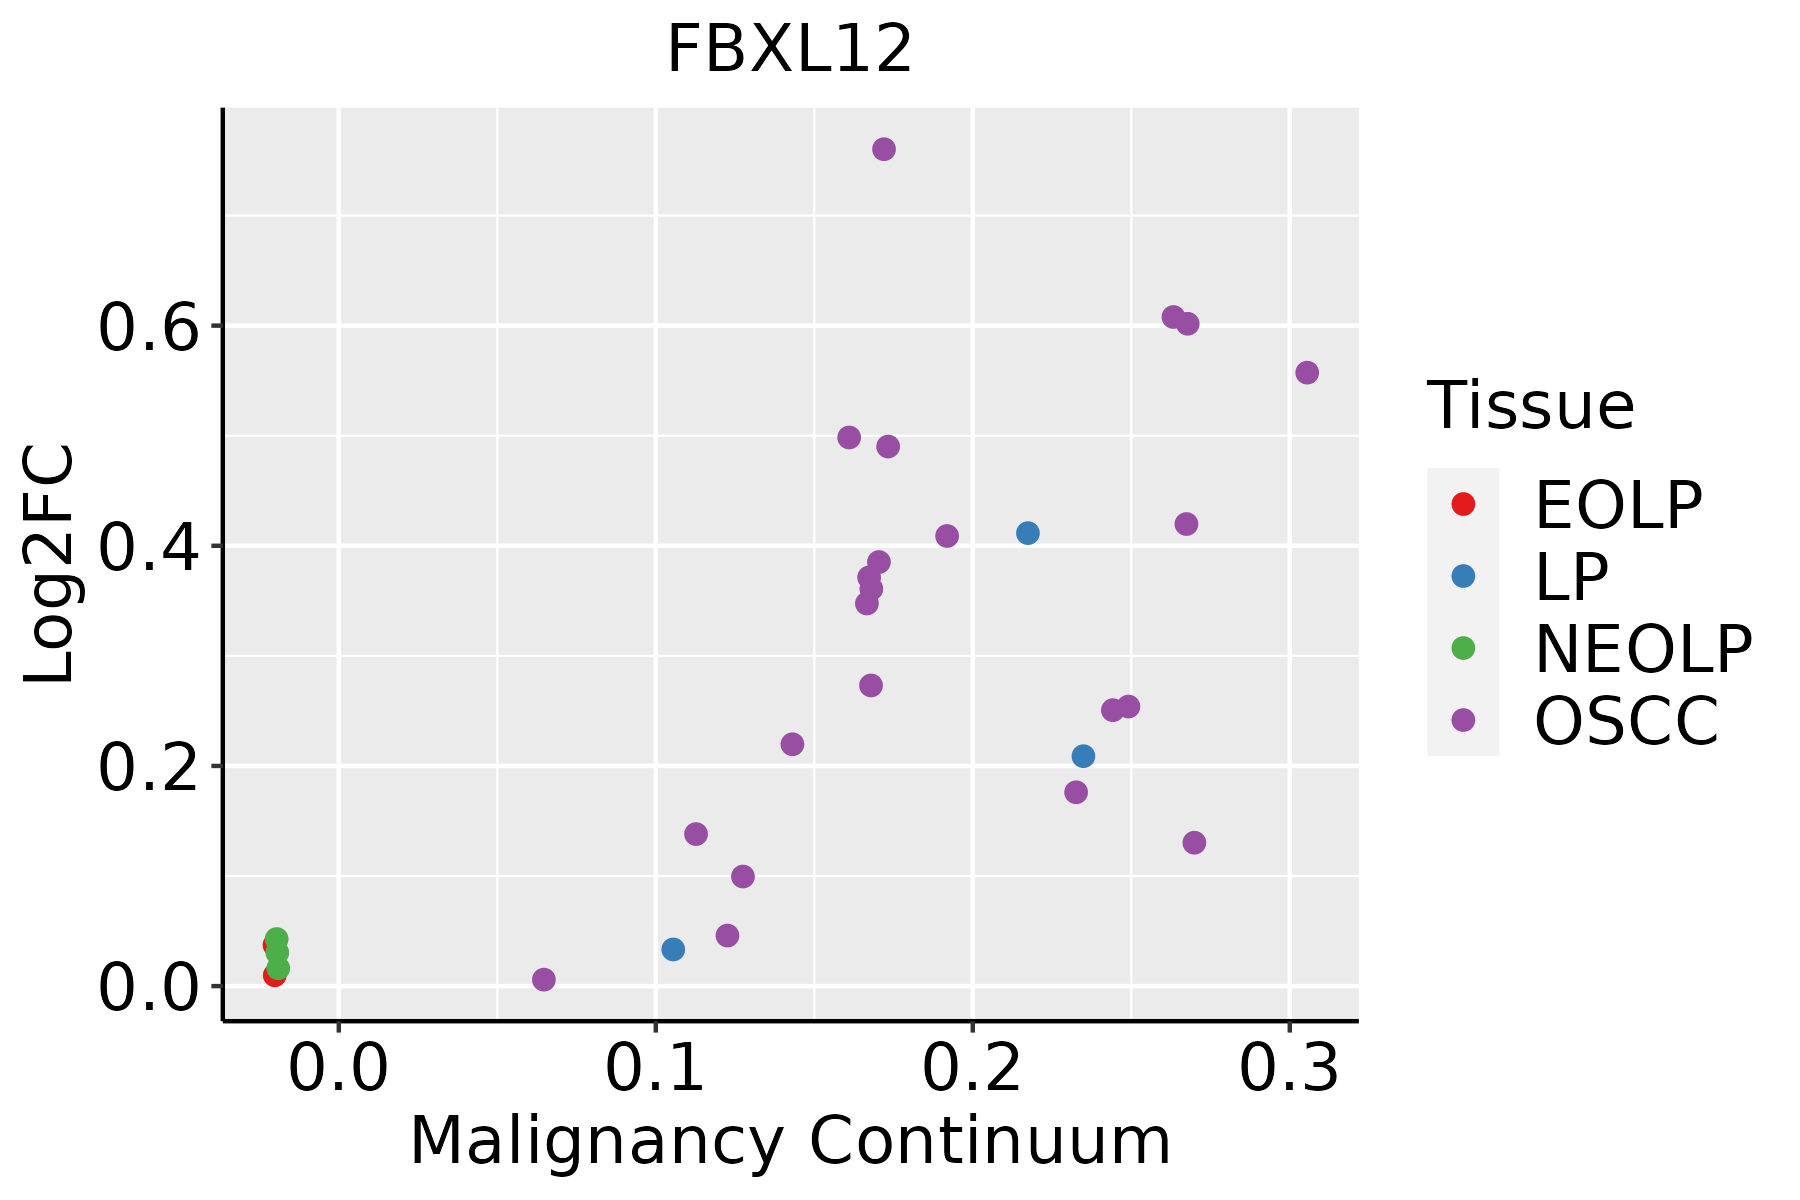
EOLP: Erosive Oral lichen planus
LP: leukoplakia
NEOLP: Non-erosive oral lichen planus
OSCC: Oral squamous cell carcinoma
ThyroidThe image shows the transcriptomic changes along malignancy continuum.log2FC in expression of this searched gene in stem-like cells from each diseased tissue sample relative to stem-like cells in normal samples in each tissue plotted against the malignancy continuum. Samples are colored based on if they are from different disease stage.
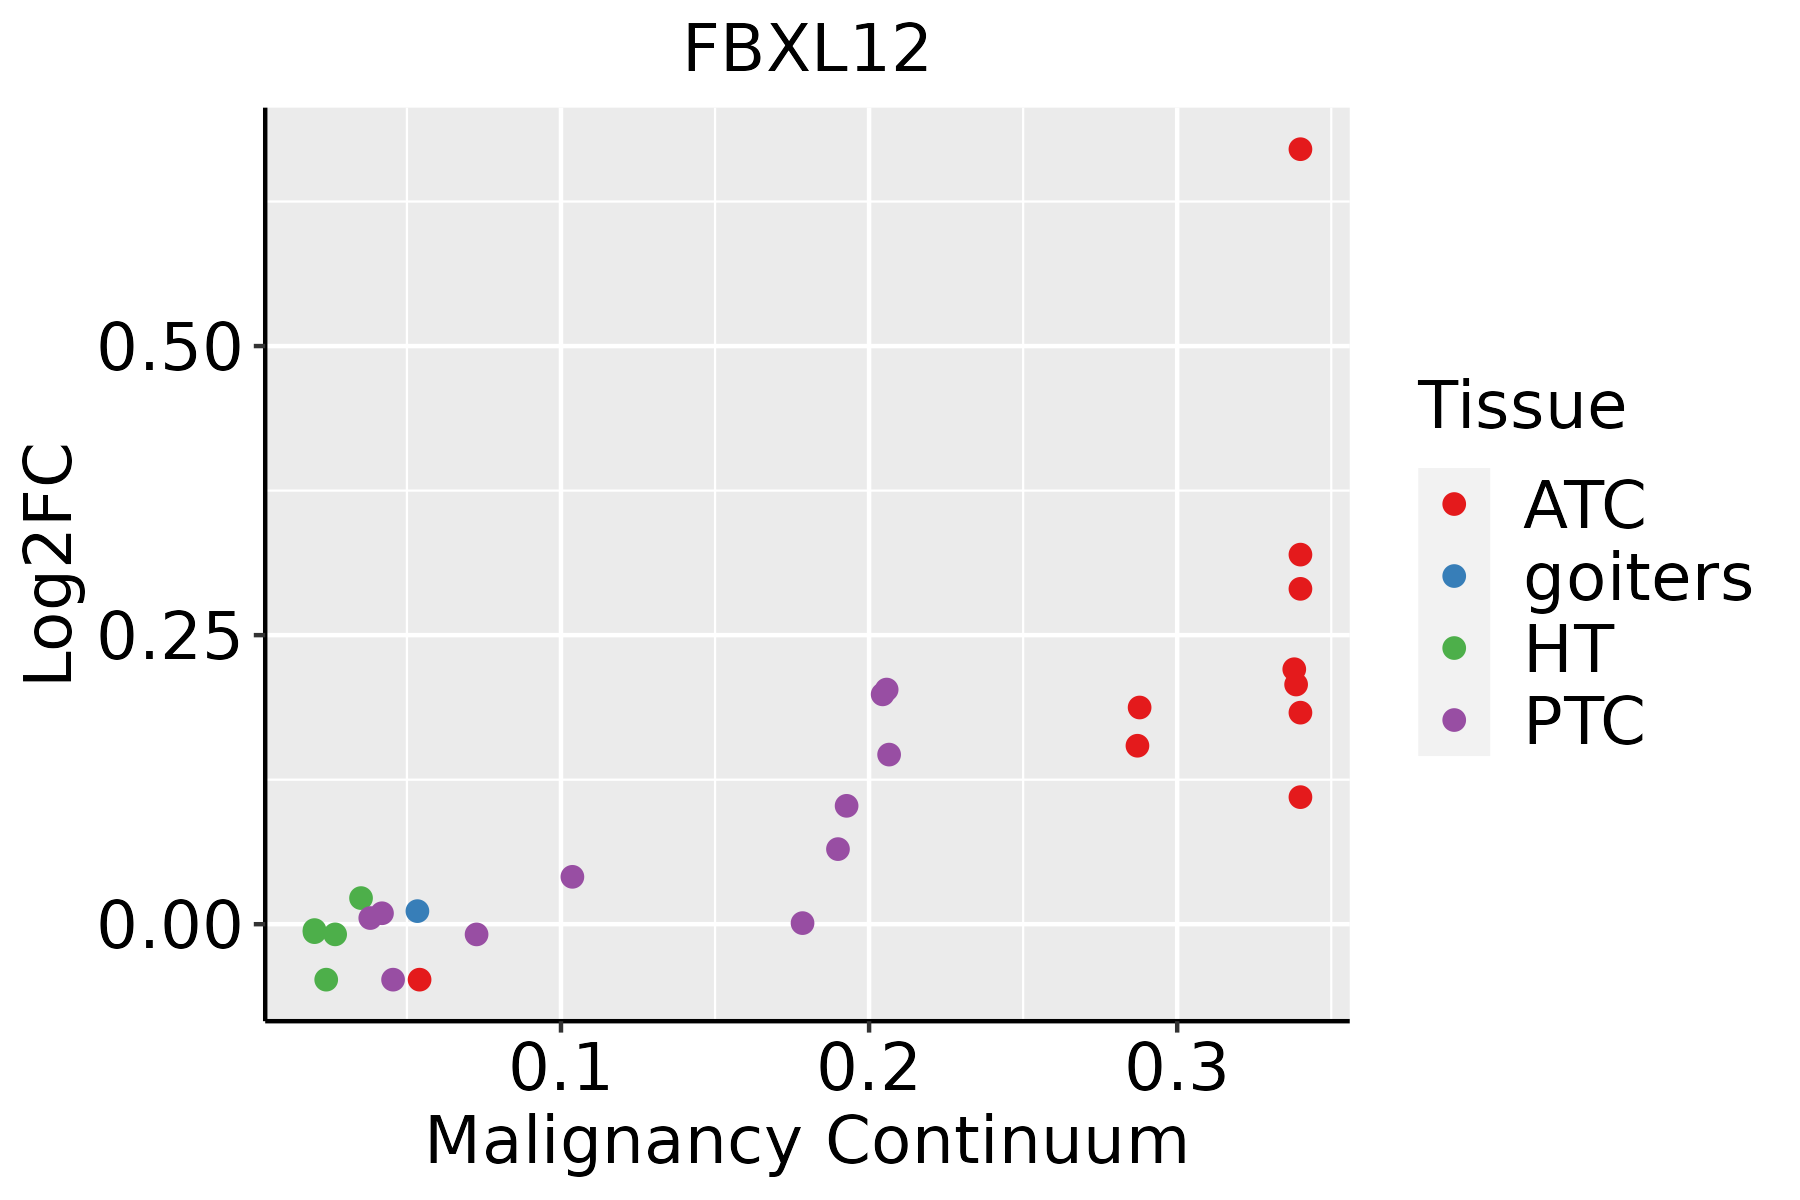
ATC: Anaplastic thyroid cancer
HT: Hashimoto's thyroiditis
PTC: Papillary thyroid cancer
∗log2FC in expression of this searched gene in stem-like cells from each diseased tissue sample relative to stem-like cells in normal samples in each tissue plotted against the malignancy continuum. Samples are colored based on if they are from different disease stage.

Top

Malignant transformation related pathway analysis

check buttonFind out the enriched GO biological processes and KEGG pathways involved in transition from healthy to precancer to cancer
check button Figure of enriched GO biological processes.
TissueDisease StageEnriched GO biological Processes
ColorectumADGO analysis - Figure of enriched GO biological processes: Top 15 enriched GO BP terms are showed in the bar plot of each disease state in each tissue. Each row represents a significant GO biological process which is colored according to the -log10(p.adjust).
ColorectumSERGO analysis - Figure of enriched GO biological processes: Top 15 enriched GO BP terms are showed in the bar plot of each disease state in each tissue. Each row represents a significant GO biological process which is colored according to the -log10(p.adjust).
ColorectumMSSGO analysis - Figure of enriched GO biological processes: Top 15 enriched GO BP terms are showed in the bar plot of each disease state in each tissue. Each row represents a significant GO biological process which is colored according to the -log10(p.adjust).
ColorectumMSI-HGO analysis - Figure of enriched GO biological processes: Top 15 enriched GO BP terms are showed in the bar plot of each disease state in each tissue. Each row represents a significant GO biological process which is colored according to the -log10(p.adjust).
ColorectumFAPGO analysis - Figure of enriched GO biological processes: Top 15 enriched GO BP terms are showed in the bar plot of each disease state in each tissue. Each row represents a significant GO biological process which is colored according to the -log10(p.adjust).
∗Top 15 enriched GO BP terms are showed in the bar plot of each disease state in each tissue. Each row represents a significant GO biological process which is colored according to the -log10(p.adjust).
Page: 1 2 3 4 5 6 7 8 9 

check button Enriched GO biological processes.
GO IDTissueDisease StageDescriptionGene RatioBg Ratiopvaluep.adjustCount
GO:0010498ColorectumADproteasomal protein catabolic process174/3918490/187233.18e-147.66e-12174
GO:0043161ColorectumADproteasome-mediated ubiquitin-dependent protein catabolic process141/3918412/187231.77e-101.68e-08141
GO:0007623ColorectumADcircadian rhythm72/3918210/187234.50e-061.21e-0472
GO:0048511ColorectumADrhythmic process94/3918298/187231.00e-052.34e-0494
GO:0042752ColorectumADregulation of circadian rhythm40/3918121/187231.24e-031.09e-0240
GO:00104982ColorectumMSSproteasomal protein catabolic process157/3467490/187232.39e-135.25e-11157
GO:00431612ColorectumMSSproteasome-mediated ubiquitin-dependent protein catabolic process127/3467412/187237.70e-106.32e-08127
GO:00076232ColorectumMSScircadian rhythm69/3467210/187234.22e-071.67e-0569
GO:00485112ColorectumMSSrhythmic process89/3467298/187231.17e-063.96e-0589
GO:00427522ColorectumMSSregulation of circadian rhythm38/3467121/187234.33e-045.23e-0338
GO:0010498111EsophagusESCCproteasomal protein catabolic process369/8552490/187231.13e-411.80e-38369
GO:0043161111EsophagusESCCproteasome-mediated ubiquitin-dependent protein catabolic process312/8552412/187233.53e-364.48e-33312
GO:004477216EsophagusESCCmitotic cell cycle phase transition281/8552424/187234.63e-184.45e-16281
GO:000931419EsophagusESCCresponse to radiation277/8552456/187234.42e-111.43e-09277
GO:00448394EsophagusESCCcell cycle G2/M phase transition103/8552148/187233.09e-096.67e-08103
GO:00000864EsophagusESCCG2/M transition of mitotic cell cycle96/8552137/187236.00e-091.23e-0796
GO:000941611EsophagusESCCresponse to light stimulus183/8552320/187232.03e-051.76e-04183
GO:004851118EsophagusESCCrhythmic process164/8552298/187236.80e-043.57e-03164
GO:000762319EsophagusESCCcircadian rhythm119/8552210/187238.47e-044.36e-03119
GO:00311461EsophagusESCCSCF-dependent proteasomal ubiquitin-dependent protein catabolic process33/855249/187231.80e-038.26e-0333
Page: 1 2 3 

check button Enriched KEGG pathways.
Pathway IDTissueDisease StageDescriptionGene RatioBg Ratiopvaluep.adjustqvalueCount
Page: 1 

Top

Cell-cell communication analysis

check buttonIdentification of potential cell-cell interactions between two cell types and their ligand-receptor pairs for different disease states
LigandReceptorLRpairPathwayTissueDisease Stage
Page: 1 

Top

Single-cell gene regulatory network inference analysis

check buttonFind out the significant the regulons (TFs) and the target genes of each regulon across cell types for different disease states
TFCell TypeTissueDisease StageTarget GeneRSSRegulon Activity
∗The dot plots of a searched regulon are shown for all cell subpopulations in each disease state of each tissue based on the regulon specific score inferred using pySCENIC and by calculating the average expression.
Page: 1 

Top

Somatic mutation of malignant transformation related genes

check buttonAnnotation of somatic variants for genes involved in malignant transformation
Hugo SymbolVariant ClassVariant ClassificationdbSNP RSHGVScHGVSpHGVSp ShortSWISSPROTBIOTYPESIFTPolyPhenTumor Sample BarcodeTissueHistologySexAgeStageTherapy TypesDrugsOutcome
FBXL12SNVMissense_Mutationnovelc.722N>Gp.Ser241Cysp.S241CQ9NXK8protein_codingdeleterious(0)benign(0.021)TCGA-AC-A6IW-01Breastbreast invasive carcinomaFemale>=65I/IIUnknownUnknownSD
FBXL12SNVMissense_Mutationnovelc.908T>Gp.Leu303Argp.L303RQ9NXK8protein_codingtolerated(0.62)possibly_damaging(0.634)TCGA-AA-3663-01Colorectumcolon adenocarcinomaMale<65I/IIUnknownUnknownSD
FBXL12SNVMissense_Mutationnovelc.300G>Tp.Lys100Asnp.K100NQ9NXK8protein_codingdeleterious(0.01)possibly_damaging(0.535)TCGA-A5-A0G2-01Endometriumuterine corpus endometrioid carcinomaFemale<65III/IVUnknownUnknownSD
FBXL12SNVMissense_Mutationnovelc.529G>Cp.Ala177Prop.A177PQ9NXK8protein_codingtolerated(0.22)possibly_damaging(0.55)TCGA-AJ-A3EK-01Endometriumuterine corpus endometrioid carcinomaFemale<65I/IIChemotherapycarboplatinCR
FBXL12SNVMissense_Mutationnovelc.671N>Tp.Ser224Ilep.S224IQ9NXK8protein_codingdeleterious(0.01)benign(0.307)TCGA-AP-A051-01Endometriumuterine corpus endometrioid carcinomaFemale>=65I/IIUnknownUnknownSD
FBXL12SNVMissense_Mutationnovelc.284G>Tp.Arg95Ilep.R95IQ9NXK8protein_codingtolerated(0.08)benign(0.138)TCGA-AX-A1CE-01Endometriumuterine corpus endometrioid carcinomaFemale<65I/IIUnspecificPaclitaxelSD
FBXL12SNVMissense_Mutationrs138149906c.317N>Ap.Arg106Hisp.R106HQ9NXK8protein_codingtolerated(0.33)benign(0.003)TCGA-AX-A2HC-01Endometriumuterine corpus endometrioid carcinomaFemale<65III/IVChemotherapypaclitaxelPD
FBXL12SNVMissense_Mutationnovelc.362G>Ap.Ser121Asnp.S121NQ9NXK8protein_codingtolerated(0.31)benign(0.263)TCGA-B5-A3FA-01Endometriumuterine corpus endometrioid carcinomaFemale>=65I/IIUnknownUnknownSD
FBXL12SNVMissense_Mutationrs375844904c.683N>Ap.Arg228Glnp.R228QQ9NXK8protein_codingtolerated(0.06)benign(0.012)TCGA-BG-A222-01Endometriumuterine corpus endometrioid carcinomaFemale<65I/IIUnknownUnknownSD
FBXL12SNVMissense_Mutationnovelc.243C>Ap.Phe81Leup.F81LQ9NXK8protein_codingtolerated(0.69)benign(0)TCGA-BS-A0UF-01Endometriumuterine corpus endometrioid carcinomaFemale>=65I/IIUnknownUnknownSD
Page: 1 2 3 

Top

Related drugs of malignant transformation related genes

check buttonIdentification of chemicals and drugs interact with genes involved in malignant transfromation
(DGIdb 4.0)
Entrez IDSymbolCategoryInteraction TypesDrug Claim NameDrug NamePMIDs
Page: 1