
|
|||||
|
 | |
| |
| |
| |
| |
| |
|
Gene: FANCG |
Gene summary for FANCG |
| Gene information | Species | Human | Gene symbol | FANCG | Gene ID | 2189 |
| Gene name | FA complementation group G | |
| Gene Alias | FAG | |
| Cytomap | 9p13.3 | |
| Gene Type | protein-coding | GO ID | GO:0000003 | UniProtAcc | O15287 |
Top |
Malignant transformation analysis |
| Identification of the aberrant gene expression in precancerous and cancerous lesions by comparing the gene expression of stem-like cells in diseased tissues with normal stem cells |
| Entrez ID | Symbol | Replicates | Species | Organ | Tissue | Adj P-value | Log2FC | Malignancy |
| 2189 | FANCG | P91T-E | Human | Esophagus | ESCC | 8.90e-03 | 5.99e-01 | 0.1828 |
| 2189 | FANCG | P107T-E | Human | Esophagus | ESCC | 1.25e-07 | 2.42e-01 | 0.171 |
| 2189 | FANCG | P128T-E | Human | Esophagus | ESCC | 1.32e-02 | 1.61e-01 | 0.1241 |
| 2189 | FANCG | P130T-E | Human | Esophagus | ESCC | 8.42e-31 | 6.80e-01 | 0.1676 |
| 2189 | FANCG | C04 | Human | Oral cavity | OSCC | 8.46e-04 | 3.51e-01 | 0.2633 |
| 2189 | FANCG | C21 | Human | Oral cavity | OSCC | 2.55e-12 | 4.63e-01 | 0.2678 |
| 2189 | FANCG | C30 | Human | Oral cavity | OSCC | 3.07e-22 | 9.82e-01 | 0.3055 |
| 2189 | FANCG | C38 | Human | Oral cavity | OSCC | 1.24e-05 | 6.79e-01 | 0.172 |
| 2189 | FANCG | C43 | Human | Oral cavity | OSCC | 2.57e-15 | 3.10e-01 | 0.1704 |
| 2189 | FANCG | C46 | Human | Oral cavity | OSCC | 1.28e-14 | 3.99e-01 | 0.1673 |
| 2189 | FANCG | C51 | Human | Oral cavity | OSCC | 1.22e-06 | 4.42e-01 | 0.2674 |
| 2189 | FANCG | C57 | Human | Oral cavity | OSCC | 4.78e-05 | 2.59e-01 | 0.1679 |
| 2189 | FANCG | C08 | Human | Oral cavity | OSCC | 8.81e-04 | 1.38e-01 | 0.1919 |
| 2189 | FANCG | LN46 | Human | Oral cavity | OSCC | 1.69e-09 | 3.23e-01 | 0.1666 |
| 2189 | FANCG | LP15 | Human | Oral cavity | LP | 1.58e-03 | 7.19e-01 | 0.2174 |
| 2189 | FANCG | SYSMH2 | Human | Oral cavity | OSCC | 2.87e-02 | 1.32e-01 | 0.2326 |
| 2189 | FANCG | SYSMH3 | Human | Oral cavity | OSCC | 5.56e-06 | 1.69e-01 | 0.2442 |
| Page: 1 2 3 |
| Tissue | Expression Dynamics | Abbreviation |
| Esophagus | 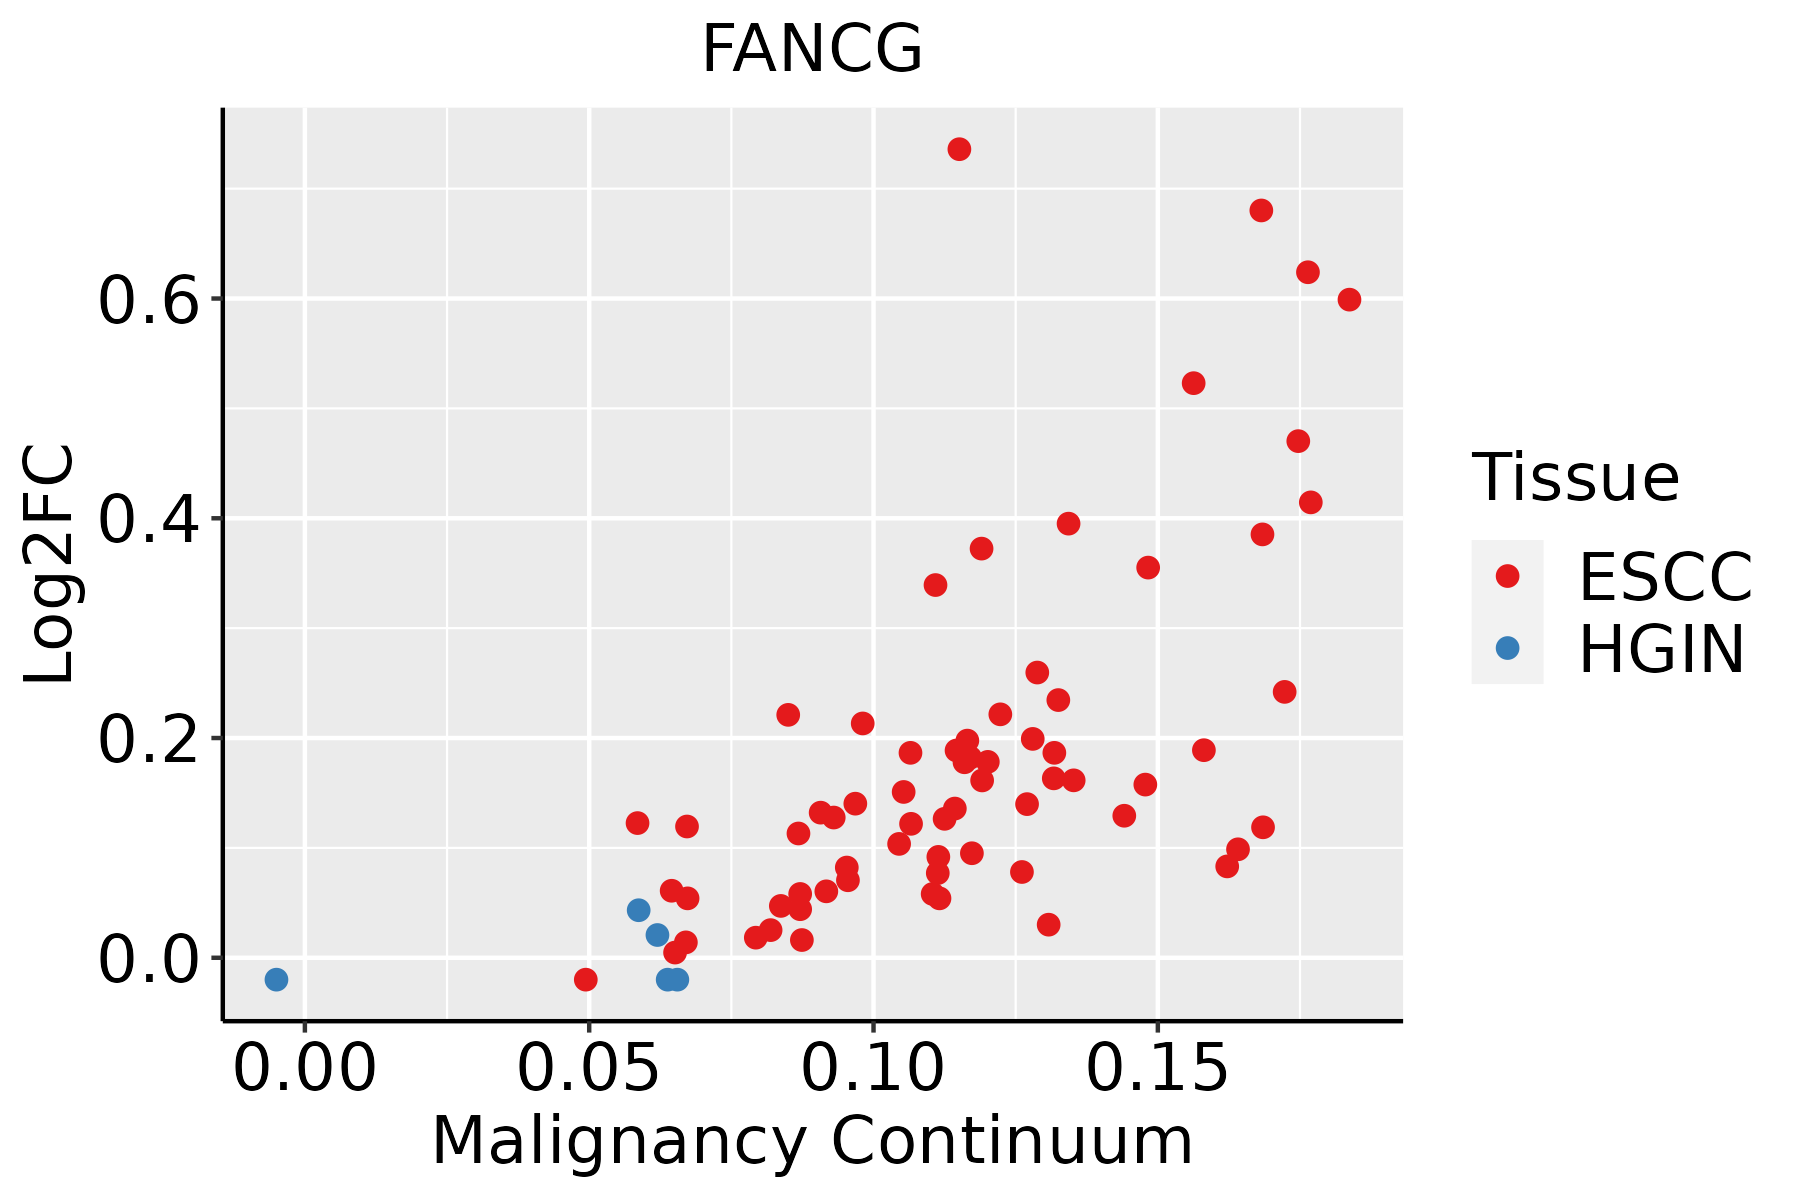 | ESCC: Esophageal squamous cell carcinoma |
| HGIN: High-grade intraepithelial neoplasias | ||
| LGIN: Low-grade intraepithelial neoplasias | ||
| Oral Cavity | 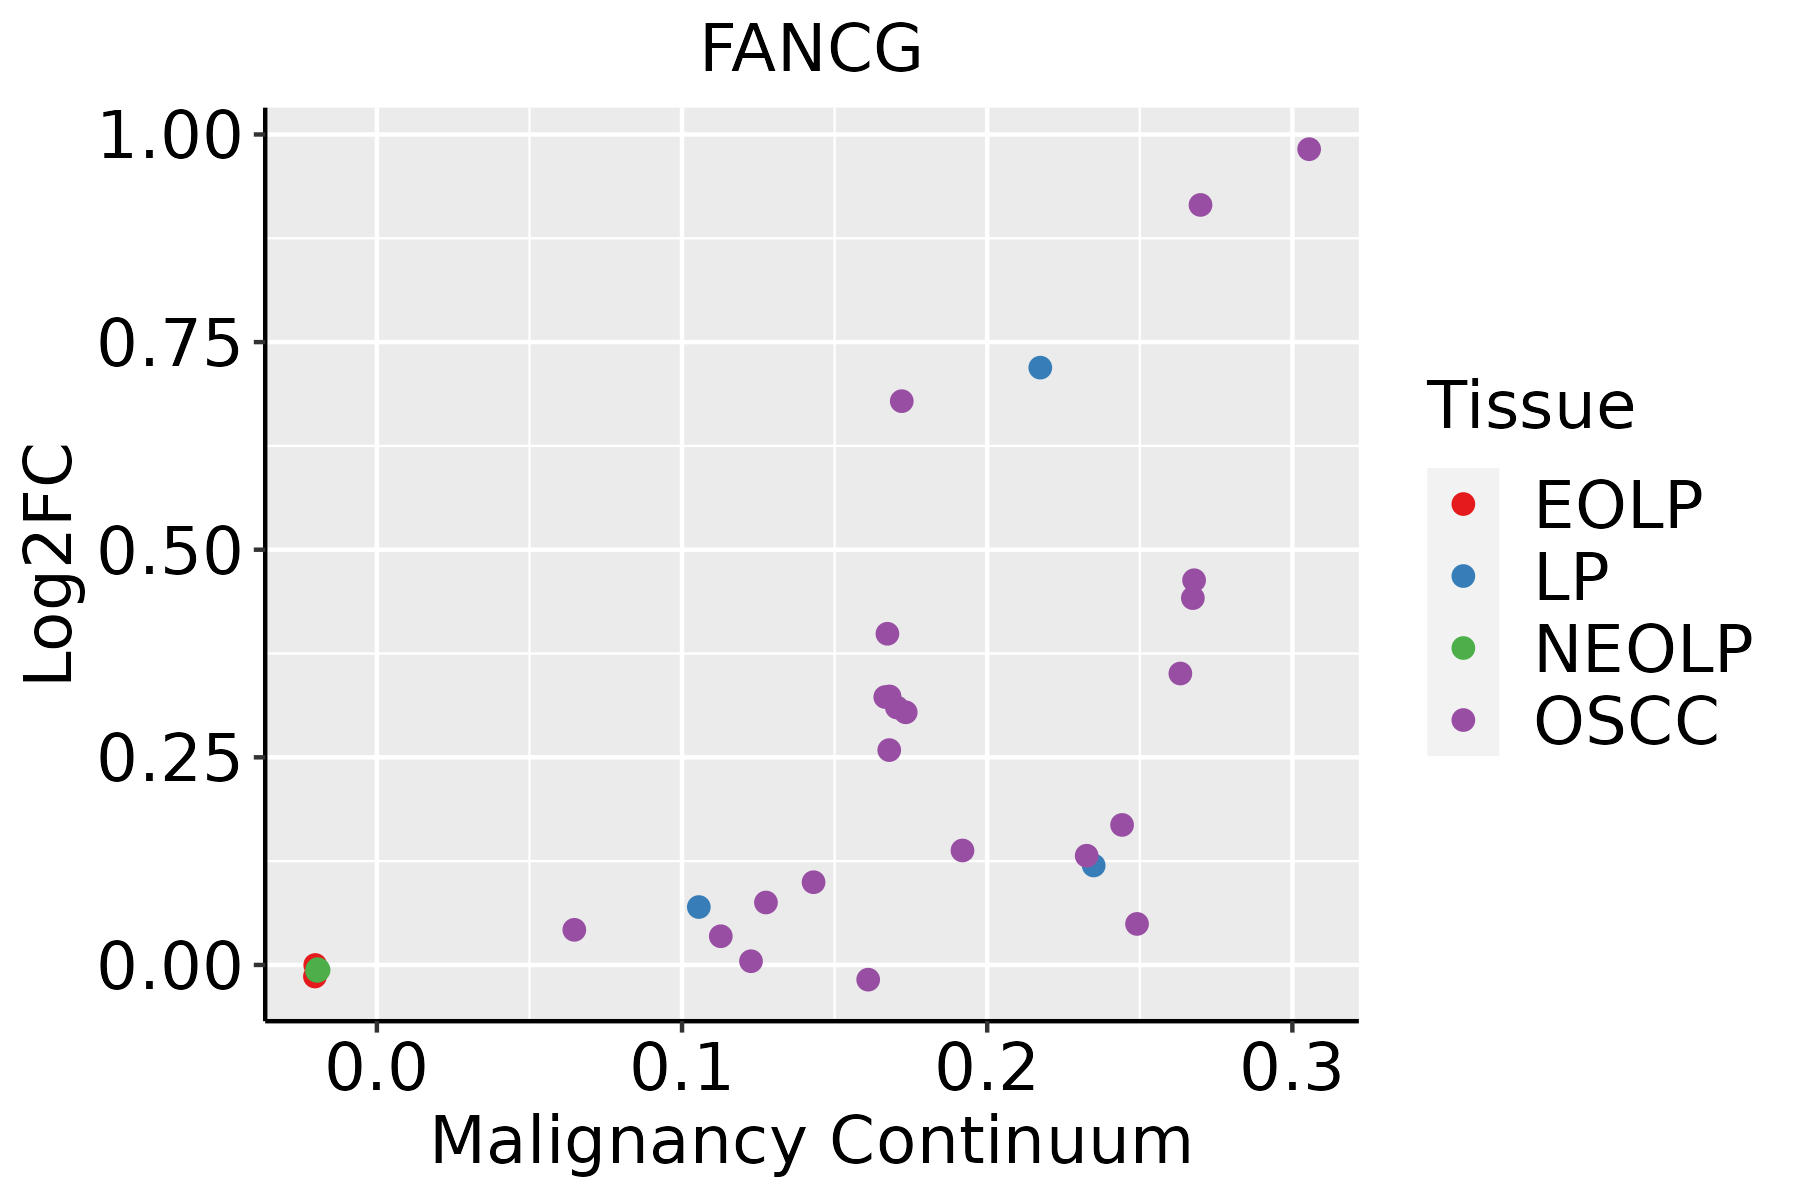 | EOLP: Erosive Oral lichen planus |
| LP: leukoplakia | ||
| NEOLP: Non-erosive oral lichen planus | ||
| OSCC: Oral squamous cell carcinoma |
| ∗log2FC in expression of this searched gene in stem-like cells from each diseased tissue sample relative to stem-like cells in normal samples in each tissue plotted against the malignancy continuum. Samples are colored based on if they are from different disease stage. |
Top |
Malignant transformation related pathway analysis |
| Find out the enriched GO biological processes and KEGG pathways involved in transition from healthy to precancer to cancer |
| Tissue | Disease Stage | Enriched GO biological Processes |
| Colorectum | AD |  |
| Colorectum | SER |  |
| Colorectum | MSS |  |
| Colorectum | MSI-H |  |
| Colorectum | FAP |  |
| ∗Top 15 enriched GO BP terms are showed in the bar plot of each disease state in each tissue. Each row represents a significant GO biological process which is colored according to the -log10(p.adjust). |
| Page: 1 2 3 4 5 6 7 8 9 |
| GO ID | Tissue | Disease Stage | Description | Gene Ratio | Bg Ratio | pvalue | p.adjust | Count |
| GO:000931419 | Esophagus | ESCC | response to radiation | 277/8552 | 456/18723 | 4.42e-11 | 1.43e-09 | 277 |
| GO:0061458110 | Esophagus | ESCC | reproductive system development | 247/8552 | 427/18723 | 2.24e-07 | 3.42e-06 | 247 |
| GO:004860818 | Esophagus | ESCC | reproductive structure development | 245/8552 | 424/18723 | 2.82e-07 | 4.14e-06 | 245 |
| GO:000931416 | Oral cavity | OSCC | response to radiation | 241/7305 | 456/18723 | 9.76e-10 | 2.40e-08 | 241 |
| GO:006145817 | Oral cavity | OSCC | reproductive system development | 217/7305 | 427/18723 | 3.75e-07 | 5.63e-06 | 217 |
| GO:004860816 | Oral cavity | OSCC | reproductive structure development | 214/7305 | 424/18723 | 8.58e-07 | 1.18e-05 | 214 |
| GO:000931417 | Oral cavity | LP | response to radiation | 155/4623 | 456/18723 | 4.12e-06 | 8.49e-05 | 155 |
| GO:006145818 | Oral cavity | LP | reproductive system development | 128/4623 | 427/18723 | 6.91e-03 | 3.96e-02 | 128 |
| GO:004860817 | Oral cavity | LP | reproductive structure development | 127/4623 | 424/18723 | 7.31e-03 | 4.08e-02 | 127 |
| Page: 1 |
| Pathway ID | Tissue | Disease Stage | Description | Gene Ratio | Bg Ratio | pvalue | p.adjust | qvalue | Count |
| Page: 1 |
Top |
Cell-cell communication analysis |
| Identification of potential cell-cell interactions between two cell types and their ligand-receptor pairs for different disease states |
| Ligand | Receptor | LRpair | Pathway | Tissue | Disease Stage |
| Page: 1 |
Top |
Single-cell gene regulatory network inference analysis |
| Find out the significant the regulons (TFs) and the target genes of each regulon across cell types for different disease states |
| TF | Cell Type | Tissue | Disease Stage | Target Gene | RSS | Regulon Activity |
| ∗The dot plots of a searched regulon are shown for all cell subpopulations in each disease state of each tissue based on the regulon specific score inferred using pySCENIC and by calculating the average expression. |
| Page: 1 |
Top |
Somatic mutation of malignant transformation related genes |
| Annotation of somatic variants for genes involved in malignant transformation |
| Hugo Symbol | Variant Class | Variant Classification | dbSNP RS | HGVSc | HGVSp | HGVSp Short | SWISSPROT | BIOTYPE | SIFT | PolyPhen | Tumor Sample Barcode | Tissue | Histology | Sex | Age | Stage | Therapy Types | Drugs | Outcome |
| FANCG | SNV | Missense_Mutation | rs752936336 | c.1696N>A | p.Glu566Lys | p.E566K | O15287 | protein_coding | deleterious(0) | possibly_damaging(0.516) | TCGA-AC-A23H-01 | Breast | breast invasive carcinoma | Female | >=65 | I/II | Unknown | Unknown | PD |
| FANCG | SNV | Missense_Mutation | c.466N>G | p.Leu156Val | p.L156V | O15287 | protein_coding | deleterious(0.01) | possibly_damaging(0.775) | TCGA-AO-A124-01 | Breast | breast invasive carcinoma | Female | <65 | I/II | Chemotherapy | doxorubicin | SD | |
| FANCG | SNV | Missense_Mutation | rs776489249 | c.608N>C | p.Leu203Ser | p.L203S | O15287 | protein_coding | deleterious(0.01) | probably_damaging(0.996) | TCGA-GM-A3NW-01 | Breast | breast invasive carcinoma | Female | <65 | I/II | Chemotherapy | fluorouracil | SD |
| FANCG | insertion | Frame_Shift_Ins | novel | c.280_281insCTGCCATCTTC | p.Gln94ProfsTer11 | p.Q94Pfs*11 | O15287 | protein_coding | TCGA-A2-A0CT-01 | Breast | breast invasive carcinoma | Female | >=65 | I/II | Chemotherapy | cytoxan | SD | ||
| FANCG | insertion | Nonsense_Mutation | novel | c.1249_1250insTTGAGCTGGATCCGTCCCTCTGATCGTGACGCCTTCCTTGA | p.Cys417PhefsTer8 | p.C417Ffs*8 | O15287 | protein_coding | TCGA-A8-A06P-01 | Breast | breast invasive carcinoma | Female | <65 | III/IV | Unspecific | SD | |||
| FANCG | insertion | In_Frame_Ins | novel | c.1786_1787insGTGTGTTCTGTGGTTGCCCTTTGACTTCTCTGG | p.Tyr596delinsCysValPheCysGlyCysProLeuThrSerLeuAsp | p.Y596delinsCVFCGCPLTSLD | O15287 | protein_coding | TCGA-B6-A0RE-01 | Breast | breast invasive carcinoma | Female | <65 | I/II | Unknown | Unknown | SD | ||
| FANCG | insertion | Nonsense_Mutation | novel | c.1725_1726insTGACAATGGGGTAGGAGTGGGGTGCTAGTCAGAAAGTTCAGAGTA | p.Glu575_Ala576insTer | p.E575_A576ins* | O15287 | protein_coding | TCGA-BH-A0AY-01 | Breast | breast invasive carcinoma | Female | <65 | I/II | Chemotherapy | SD | |||
| FANCG | SNV | Missense_Mutation | c.1095N>T | p.Glu365Asp | p.E365D | O15287 | protein_coding | deleterious(0) | probably_damaging(0.987) | TCGA-AA-3715-01 | Colorectum | colon adenocarcinoma | Male | >=65 | I/II | Unknown | Unknown | PD | |
| FANCG | SNV | Missense_Mutation | c.1060T>C | p.Cys354Arg | p.C354R | O15287 | protein_coding | deleterious(0) | probably_damaging(0.995) | TCGA-CK-6746-01 | Colorectum | colon adenocarcinoma | Female | >=65 | I/II | Unknown | Unknown | SD | |
| FANCG | SNV | Missense_Mutation | novel | c.854N>G | p.Glu285Gly | p.E285G | O15287 | protein_coding | deleterious(0.01) | probably_damaging(0.994) | TCGA-DM-A1DB-01 | Colorectum | colon adenocarcinoma | Male | >=65 | I/II | Unknown | Unknown | SD |
| Page: 1 2 3 4 5 |
Top |
Related drugs of malignant transformation related genes |
| Identification of chemicals and drugs interact with genes involved in malignant transfromation |
| (DGIdb 4.0) |
| Entrez ID | Symbol | Category | Interaction Types | Drug Claim Name | Drug Name | PMIDs |
| Page: 1 |

Copyright 2023-Present -The University of Texas Health Science Center at Houston |