
|
|||||
|
 | |
| |
| |
| |
| |
| |
|
Gene: FAM50B |
Gene summary for FAM50B |
| Gene information | Species | Human | Gene symbol | FAM50B | Gene ID | 26240 |
| Gene name | family with sequence similarity 50 member B | |
| Gene Alias | D6S2654E | |
| Cytomap | 6p25.2 | |
| Gene Type | protein-coding | GO ID | GO:0006325 | UniProtAcc | A0A024QZY3 |
Top |
Malignant transformation analysis |
| Identification of the aberrant gene expression in precancerous and cancerous lesions by comparing the gene expression of stem-like cells in diseased tissues with normal stem cells |
| Entrez ID | Symbol | Replicates | Species | Organ | Tissue | Adj P-value | Log2FC | Malignancy |
| 26240 | FAM50B | P75T-E | Human | Esophagus | ESCC | 3.50e-18 | 2.85e-01 | 0.1125 |
| 26240 | FAM50B | P76T-E | Human | Esophagus | ESCC | 2.45e-25 | 4.78e-01 | 0.1207 |
| 26240 | FAM50B | P79T-E | Human | Esophagus | ESCC | 2.93e-08 | 1.73e-01 | 0.1154 |
| 26240 | FAM50B | P80T-E | Human | Esophagus | ESCC | 1.49e-39 | 1.00e+00 | 0.155 |
| 26240 | FAM50B | P83T-E | Human | Esophagus | ESCC | 2.29e-33 | 7.79e-01 | 0.1738 |
| 26240 | FAM50B | P89T-E | Human | Esophagus | ESCC | 8.86e-10 | 4.27e-01 | 0.1752 |
| 26240 | FAM50B | P107T-E | Human | Esophagus | ESCC | 2.02e-15 | 3.47e-01 | 0.171 |
| 26240 | FAM50B | P127T-E | Human | Esophagus | ESCC | 1.55e-05 | 1.27e-01 | 0.0826 |
| 26240 | FAM50B | P128T-E | Human | Esophagus | ESCC | 1.31e-17 | 5.35e-01 | 0.1241 |
| 26240 | FAM50B | P130T-E | Human | Esophagus | ESCC | 4.44e-57 | 1.32e+00 | 0.1676 |
| 26240 | FAM50B | HCC1_Meng | Human | Liver | HCC | 6.32e-59 | 7.94e-02 | 0.0246 |
| 26240 | FAM50B | HCC2_Meng | Human | Liver | HCC | 1.90e-18 | 7.15e-02 | 0.0107 |
| 26240 | FAM50B | HCC1 | Human | Liver | HCC | 5.41e-06 | 2.62e+00 | 0.5336 |
| 26240 | FAM50B | HCC2 | Human | Liver | HCC | 3.60e-11 | 3.66e+00 | 0.5341 |
| 26240 | FAM50B | S014 | Human | Liver | HCC | 2.76e-11 | 7.31e-01 | 0.2254 |
| 26240 | FAM50B | S015 | Human | Liver | HCC | 5.28e-14 | 9.19e-01 | 0.2375 |
| 26240 | FAM50B | S016 | Human | Liver | HCC | 2.81e-25 | 1.06e+00 | 0.2243 |
| 26240 | FAM50B | S028 | Human | Liver | HCC | 2.99e-06 | 4.25e-01 | 0.2503 |
| 26240 | FAM50B | S029 | Human | Liver | HCC | 1.19e-06 | 4.48e-01 | 0.2581 |
| 26240 | FAM50B | C21 | Human | Oral cavity | OSCC | 1.44e-22 | 7.88e-01 | 0.2678 |
| Page: 1 2 3 4 |
| Tissue | Expression Dynamics | Abbreviation |
| Esophagus | 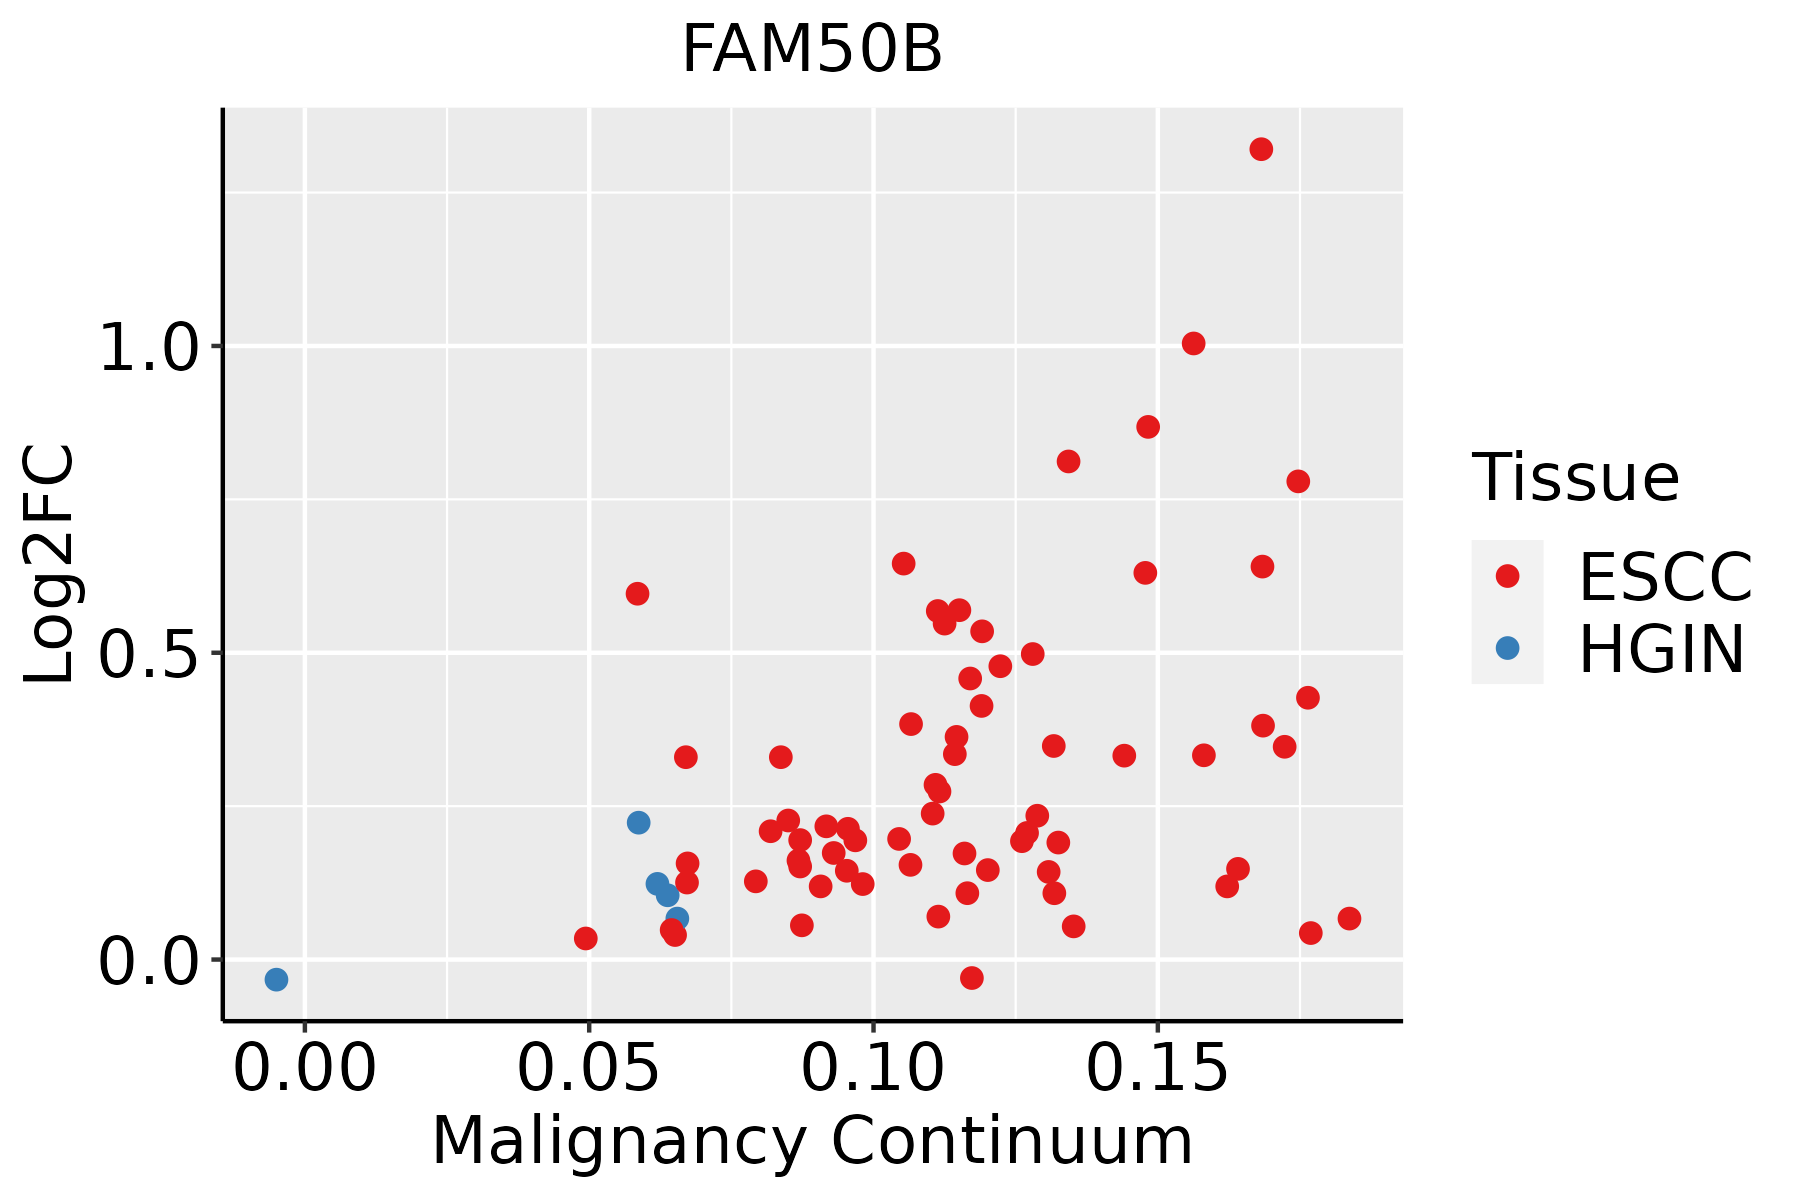 | ESCC: Esophageal squamous cell carcinoma |
| HGIN: High-grade intraepithelial neoplasias | ||
| LGIN: Low-grade intraepithelial neoplasias | ||
| Liver | 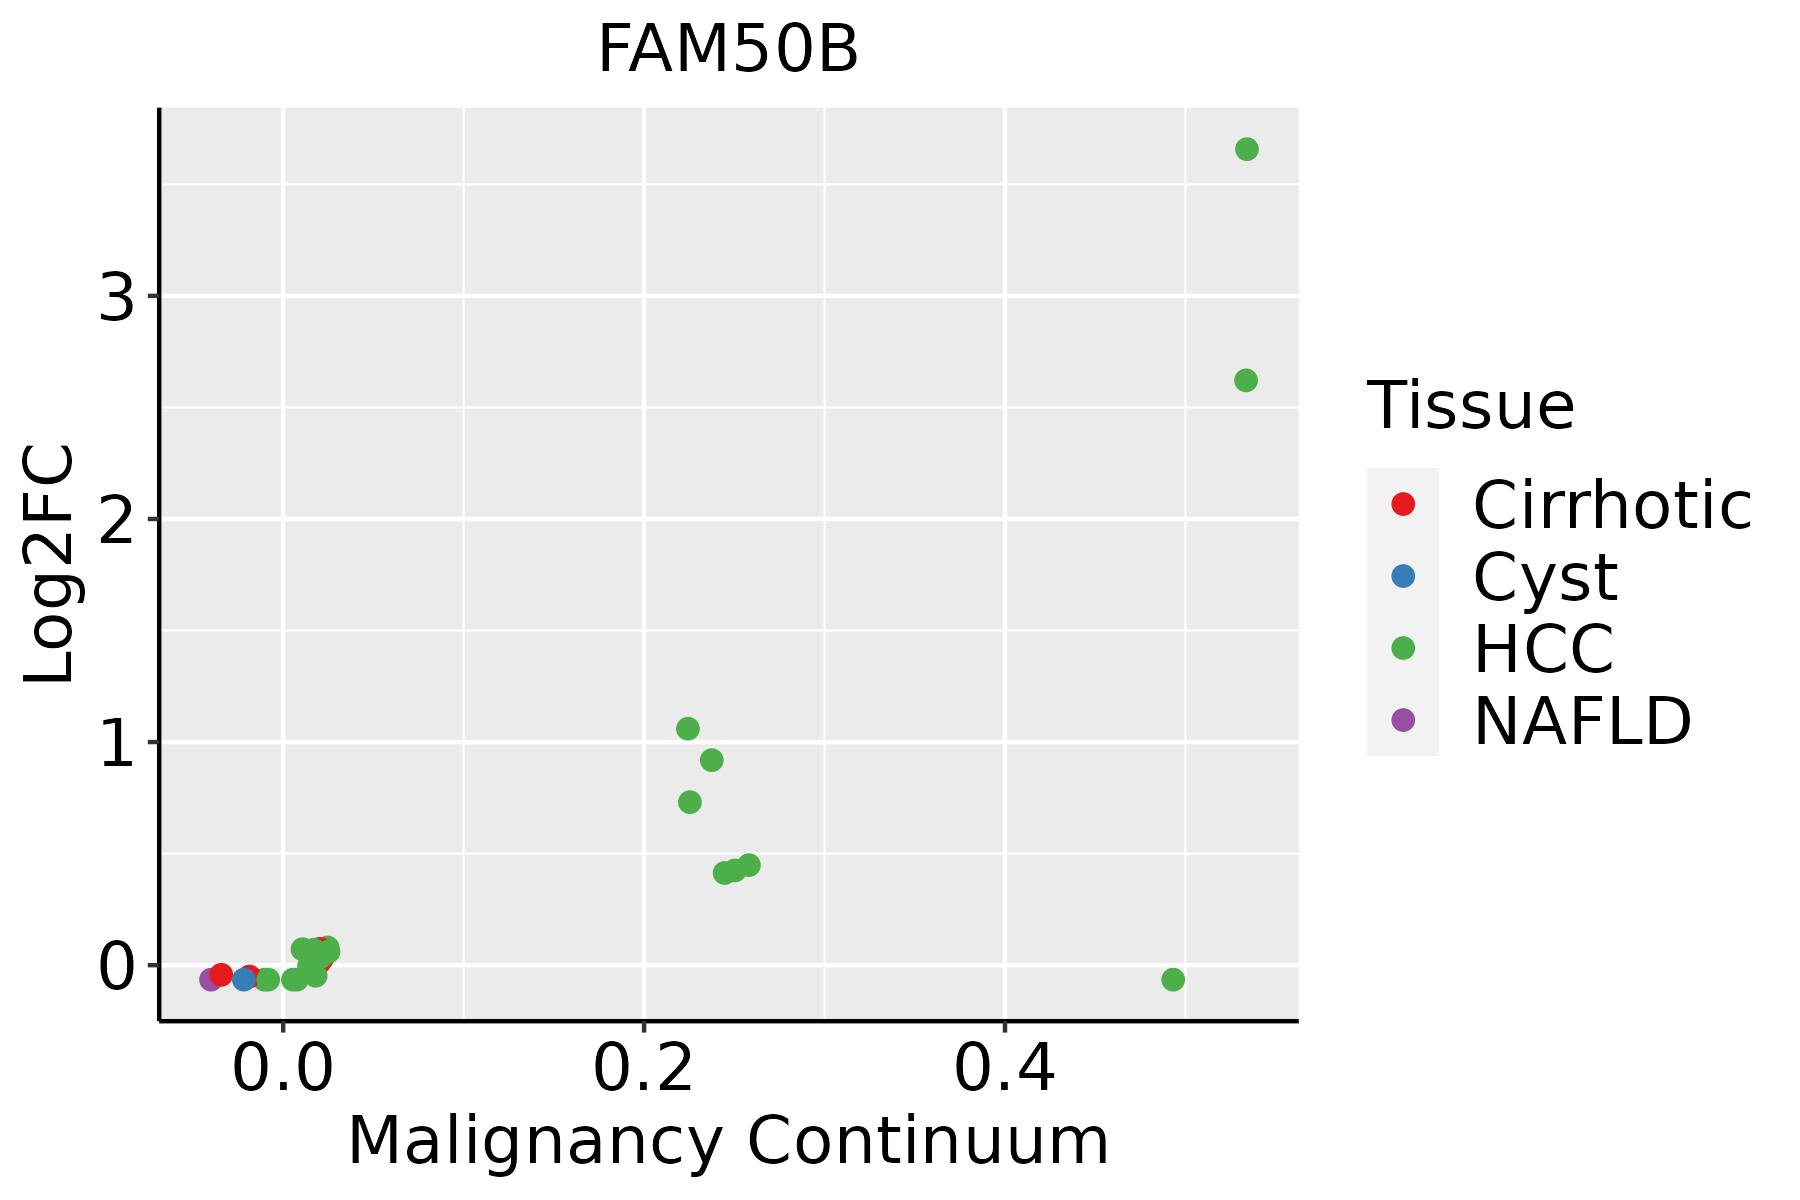 | HCC: Hepatocellular carcinoma |
| NAFLD: Non-alcoholic fatty liver disease | ||
| Oral Cavity | 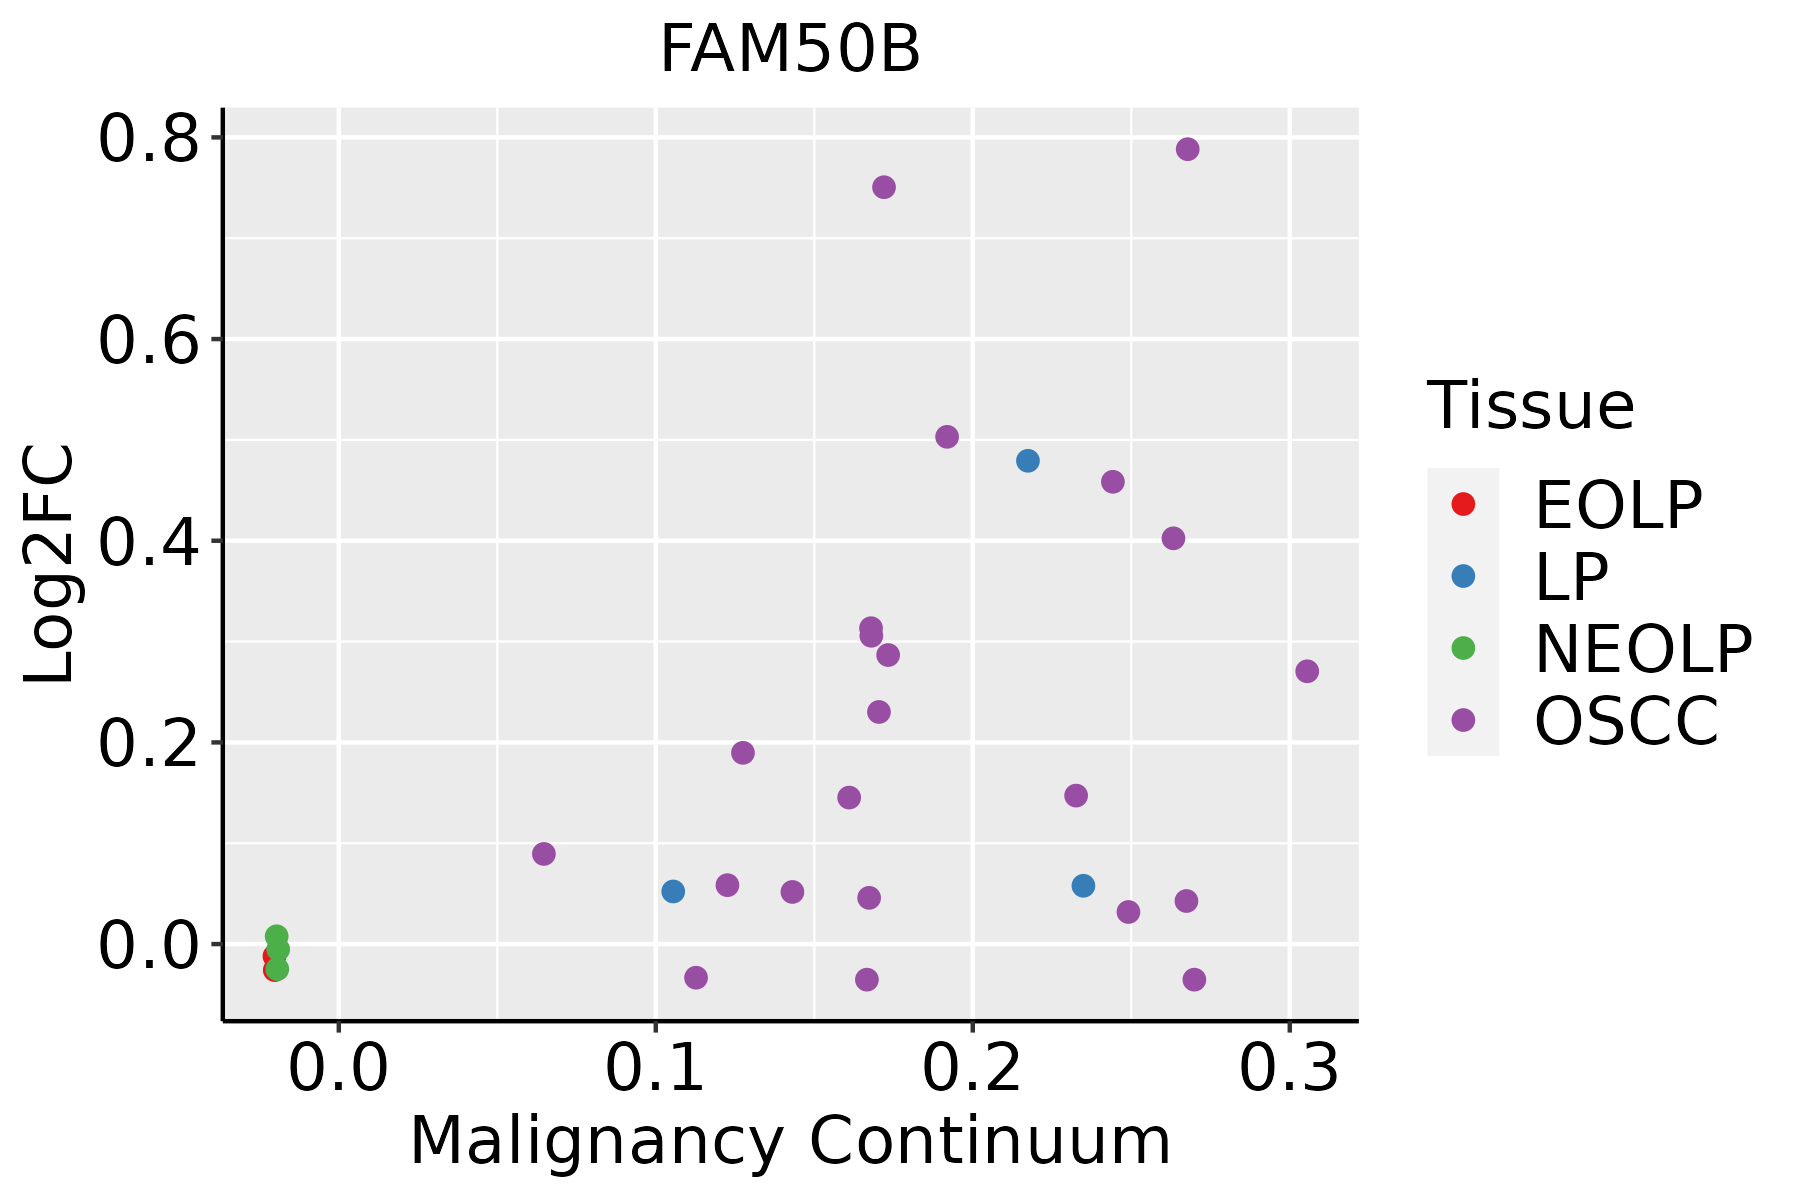 | EOLP: Erosive Oral lichen planus |
| LP: leukoplakia | ||
| NEOLP: Non-erosive oral lichen planus | ||
| OSCC: Oral squamous cell carcinoma |
| ∗log2FC in expression of this searched gene in stem-like cells from each diseased tissue sample relative to stem-like cells in normal samples in each tissue plotted against the malignancy continuum. Samples are colored based on if they are from different disease stage. |
Top |
Malignant transformation related pathway analysis |
| Find out the enriched GO biological processes and KEGG pathways involved in transition from healthy to precancer to cancer |
| Tissue | Disease Stage | Enriched GO biological Processes |
| Colorectum | AD |  |
| Colorectum | SER |  |
| Colorectum | MSS |  |
| Colorectum | MSI-H |  |
| Colorectum | FAP |  |
| ∗Top 15 enriched GO BP terms are showed in the bar plot of each disease state in each tissue. Each row represents a significant GO biological process which is colored according to the -log10(p.adjust). |
| Page: 1 2 3 4 5 6 7 8 9 |
| GO ID | Tissue | Disease Stage | Description | Gene Ratio | Bg Ratio | pvalue | p.adjust | Count |
| GO:000632516 | Esophagus | HGIN | chromatin organization | 92/2587 | 409/18723 | 1.05e-06 | 4.16e-05 | 92 |
| GO:000632517 | Esophagus | ESCC | chromatin organization | 240/8552 | 409/18723 | 6.52e-08 | 1.14e-06 | 240 |
| GO:000632511 | Liver | HCC | chromatin organization | 206/7958 | 409/18723 | 7.23e-04 | 4.41e-03 | 206 |
| GO:000632510 | Oral cavity | OSCC | chromatin organization | 190/7305 | 409/18723 | 1.17e-03 | 5.97e-03 | 190 |
| Page: 1 |
| Pathway ID | Tissue | Disease Stage | Description | Gene Ratio | Bg Ratio | pvalue | p.adjust | qvalue | Count |
| Page: 1 |
Top |
Cell-cell communication analysis |
| Identification of potential cell-cell interactions between two cell types and their ligand-receptor pairs for different disease states |
| Ligand | Receptor | LRpair | Pathway | Tissue | Disease Stage |
| Page: 1 |
Top |
Single-cell gene regulatory network inference analysis |
| Find out the significant the regulons (TFs) and the target genes of each regulon across cell types for different disease states |
| TF | Cell Type | Tissue | Disease Stage | Target Gene | RSS | Regulon Activity |
| ∗The dot plots of a searched regulon are shown for all cell subpopulations in each disease state of each tissue based on the regulon specific score inferred using pySCENIC and by calculating the average expression. |
| Page: 1 |
Top |
Somatic mutation of malignant transformation related genes |
| Annotation of somatic variants for genes involved in malignant transformation |
| Hugo Symbol | Variant Class | Variant Classification | dbSNP RS | HGVSc | HGVSp | HGVSp Short | SWISSPROT | BIOTYPE | SIFT | PolyPhen | Tumor Sample Barcode | Tissue | Histology | Sex | Age | Stage | Therapy Types | Drugs | Outcome |
| FAM50B | SNV | Missense_Mutation | c.820N>A | p.Val274Met | p.V274M | Q9Y247 | protein_coding | deleterious(0) | probably_damaging(0.977) | TCGA-C5-A8ZZ-01 | Cervix | cervical & endocervical cancer | Female | <65 | I/II | Unspecific | Cisplatin | SD | |
| FAM50B | SNV | Missense_Mutation | c.686C>T | p.Ser229Phe | p.S229F | Q9Y247 | protein_coding | deleterious(0.01) | possibly_damaging(0.866) | TCGA-DR-A0ZM-01 | Cervix | cervical & endocervical cancer | Female | <65 | III/IV | Unspecific | Cisplatin | SD | |
| FAM50B | deletion | Frame_Shift_Del | novel | c.596_612delGCACGGTGCGGGTGCGC | p.Arg199GlnfsTer69 | p.R199Qfs*69 | Q9Y247 | protein_coding | TCGA-C5-A7CG-01 | Cervix | cervical & endocervical cancer | Female | <65 | I/II | Unknown | Unknown | SD | ||
| FAM50B | SNV | Missense_Mutation | rs748727501 | c.773N>T | p.Ala258Val | p.A258V | Q9Y247 | protein_coding | deleterious(0) | possibly_damaging(0.73) | TCGA-AA-3663-01 | Colorectum | colon adenocarcinoma | Male | <65 | I/II | Unknown | Unknown | SD |
| FAM50B | SNV | Missense_Mutation | rs770945816 | c.314N>A | p.Arg105Gln | p.R105Q | Q9Y247 | protein_coding | tolerated(0.13) | benign(0.227) | TCGA-AD-6889-01 | Colorectum | colon adenocarcinoma | Male | >=65 | I/II | Chemotherapy | xeloda | PD |
| FAM50B | SNV | Missense_Mutation | rs768080374 | c.415G>A | p.Ala139Thr | p.A139T | Q9Y247 | protein_coding | tolerated(0.19) | benign(0.028) | TCGA-AZ-4615-01 | Colorectum | colon adenocarcinoma | Male | >=65 | III/IV | Chemotherapy | xeloda | PD |
| FAM50B | SNV | Missense_Mutation | c.411N>C | p.Arg137Ser | p.R137S | Q9Y247 | protein_coding | tolerated(0.72) | benign(0) | TCGA-CK-4951-01 | Colorectum | colon adenocarcinoma | Female | >=65 | I/II | Unknown | Unknown | PD | |
| FAM50B | SNV | Missense_Mutation | c.592C>T | p.Arg198Trp | p.R198W | Q9Y247 | protein_coding | deleterious(0) | probably_damaging(1) | TCGA-D5-5540-01 | Colorectum | colon adenocarcinoma | Male | >=65 | I/II | Unknown | Unknown | SD | |
| FAM50B | SNV | Missense_Mutation | c.860N>T | p.Ser287Leu | p.S287L | Q9Y247 | protein_coding | deleterious(0) | probably_damaging(0.996) | TCGA-G4-6588-01 | Colorectum | colon adenocarcinoma | Female | <65 | I/II | Unknown | Unknown | SD | |
| FAM50B | SNV | Missense_Mutation | c.883N>T | p.Arg295Cys | p.R295C | Q9Y247 | protein_coding | deleterious(0) | probably_damaging(1) | TCGA-AG-A01W-01 | Colorectum | rectum adenocarcinoma | Female | >=65 | I/II | Chemotherapy | 5-fluorouracil | CR |
| Page: 1 2 3 4 5 |
Top |
Related drugs of malignant transformation related genes |
| Identification of chemicals and drugs interact with genes involved in malignant transfromation |
| (DGIdb 4.0) |
| Entrez ID | Symbol | Category | Interaction Types | Drug Claim Name | Drug Name | PMIDs |
| Page: 1 |

Copyright 2023-Present -The University of Texas Health Science Center at Houston |