
|
|||||
|
 | |
| |
| |
| |
| |
| |
|
Gene: FAM214A |
Gene summary for FAM214A |
| Gene information | Species | Human | Gene symbol | FAM214A | Gene ID | 56204 |
| Gene name | family with sequence similarity 214 member A | |
| Gene Alias | KIAA1370 | |
| Cytomap | 15q21.2-q21.3 | |
| Gene Type | protein-coding | GO ID | GO:0003674 | UniProtAcc | Q32MH5 |
Top |
Malignant transformation analysis |
| Identification of the aberrant gene expression in precancerous and cancerous lesions by comparing the gene expression of stem-like cells in diseased tissues with normal stem cells |
| Entrez ID | Symbol | Replicates | Species | Organ | Tissue | Adj P-value | Log2FC | Malignancy |
| 56204 | FAM214A | P16T-E | Human | Esophagus | ESCC | 2.55e-07 | 9.56e-02 | 0.1153 |
| 56204 | FAM214A | P17T-E | Human | Esophagus | ESCC | 1.99e-04 | 6.89e-02 | 0.1278 |
| 56204 | FAM214A | P20T-E | Human | Esophagus | ESCC | 1.02e-09 | 6.86e-02 | 0.1124 |
| 56204 | FAM214A | P21T-E | Human | Esophagus | ESCC | 7.01e-08 | 1.73e-02 | 0.1617 |
| 56204 | FAM214A | P22T-E | Human | Esophagus | ESCC | 5.68e-11 | 6.40e-03 | 0.1236 |
| 56204 | FAM214A | P23T-E | Human | Esophagus | ESCC | 3.74e-14 | 5.67e-01 | 0.108 |
| 56204 | FAM214A | P26T-E | Human | Esophagus | ESCC | 5.86e-12 | 7.07e-02 | 0.1276 |
| 56204 | FAM214A | P27T-E | Human | Esophagus | ESCC | 1.33e-08 | 1.79e-02 | 0.1055 |
| 56204 | FAM214A | P28T-E | Human | Esophagus | ESCC | 1.07e-11 | 9.48e-02 | 0.1149 |
| 56204 | FAM214A | P30T-E | Human | Esophagus | ESCC | 7.93e-03 | 8.09e-02 | 0.137 |
| 56204 | FAM214A | P31T-E | Human | Esophagus | ESCC | 2.68e-02 | 3.66e-02 | 0.1251 |
| 56204 | FAM214A | P32T-E | Human | Esophagus | ESCC | 1.92e-05 | -3.02e-02 | 0.1666 |
| 56204 | FAM214A | P37T-E | Human | Esophagus | ESCC | 2.11e-11 | 7.26e-02 | 0.1371 |
| 56204 | FAM214A | P39T-E | Human | Esophagus | ESCC | 2.98e-07 | 1.71e-01 | 0.0894 |
| 56204 | FAM214A | P40T-E | Human | Esophagus | ESCC | 4.25e-04 | 9.81e-03 | 0.109 |
| 56204 | FAM214A | P42T-E | Human | Esophagus | ESCC | 8.33e-09 | 2.06e-01 | 0.1175 |
| 56204 | FAM214A | P47T-E | Human | Esophagus | ESCC | 2.90e-04 | 1.30e-01 | 0.1067 |
| 56204 | FAM214A | P48T-E | Human | Esophagus | ESCC | 3.86e-03 | 1.04e-01 | 0.0959 |
| 56204 | FAM214A | P52T-E | Human | Esophagus | ESCC | 4.14e-11 | 3.61e-02 | 0.1555 |
| 56204 | FAM214A | P54T-E | Human | Esophagus | ESCC | 1.42e-07 | 2.73e-01 | 0.0975 |
| Page: 1 2 3 4 5 6 |
| Tissue | Expression Dynamics | Abbreviation |
| Breast | 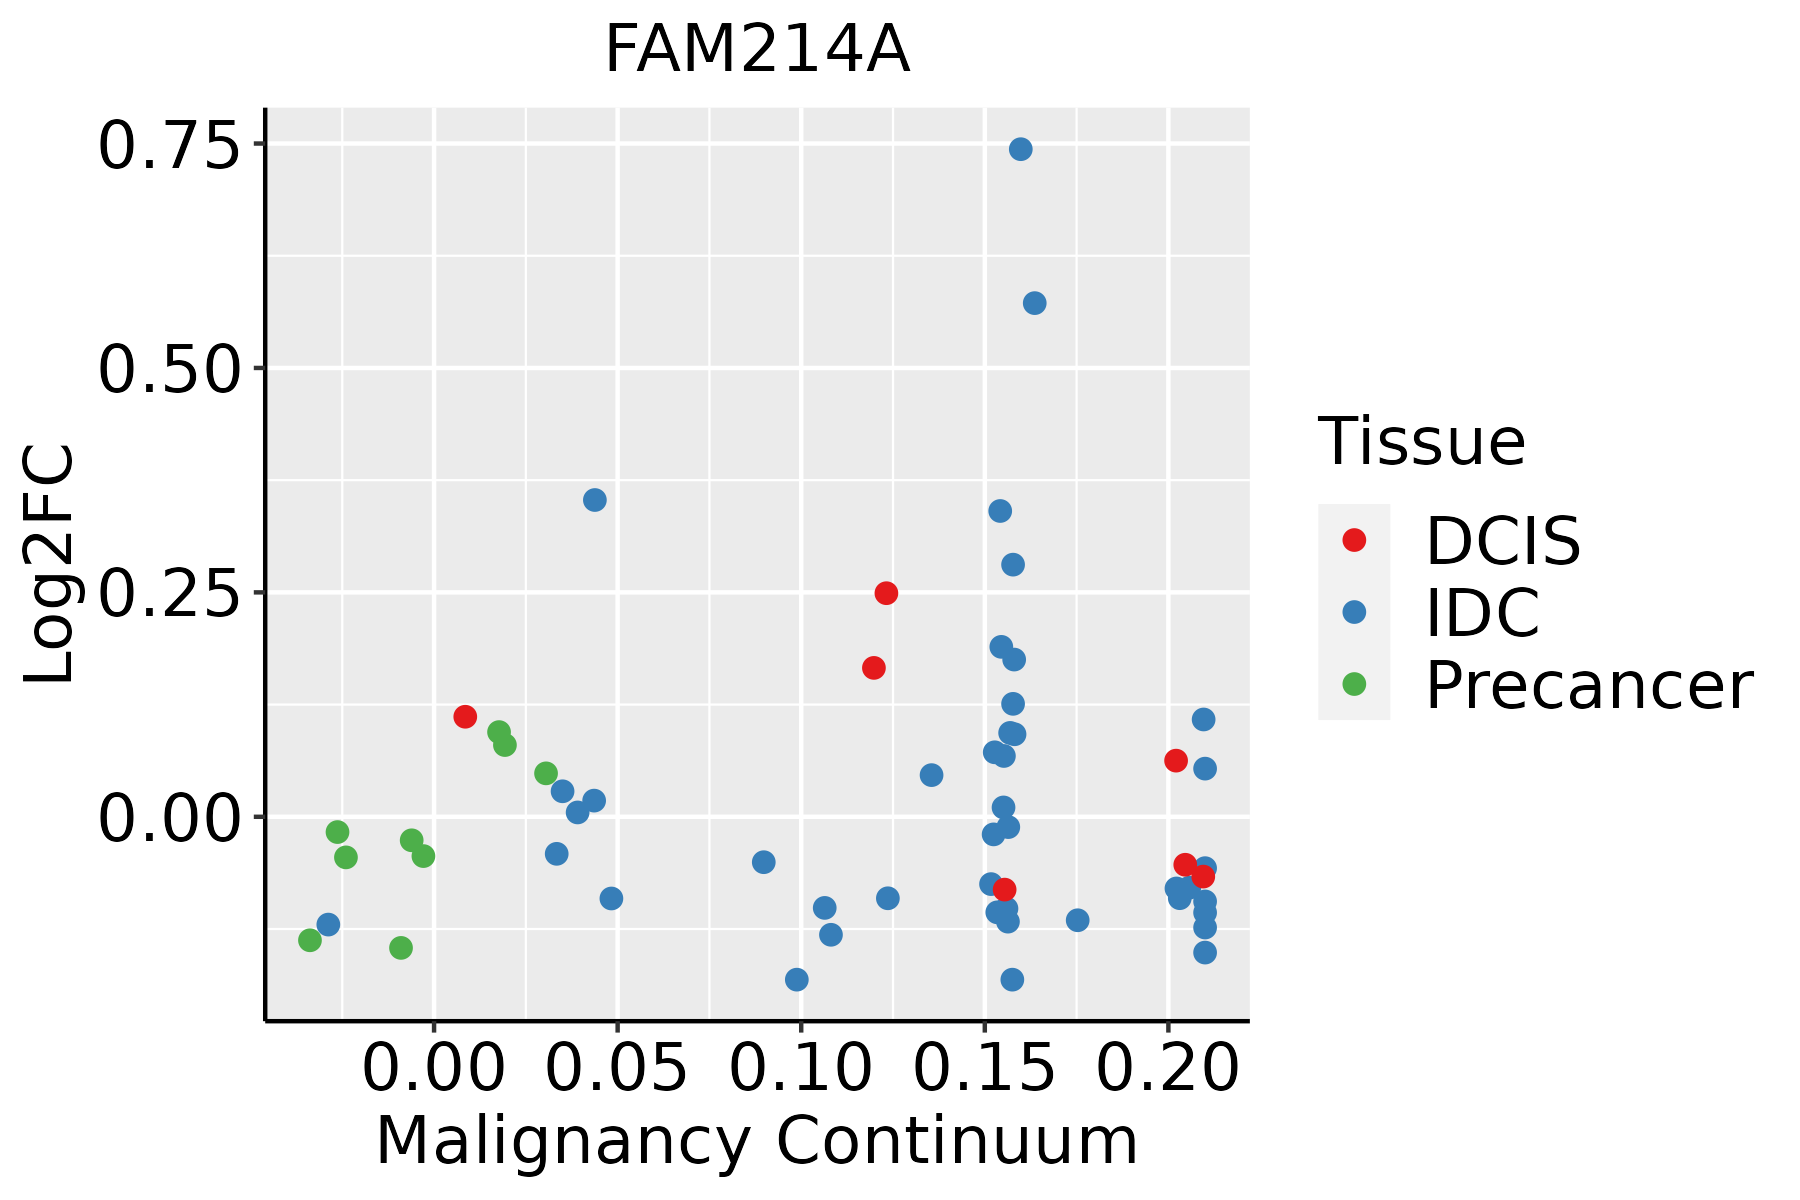 | IDC: Invasive ductal carcinoma |
| DCIS: Ductal carcinoma in situ | ||
| Precancer(BRCA1-mut): Precancerous lesion from BRCA1 mutation carriers | ||
| Cervix |  | CC: Cervix cancer |
| HSIL_HPV: HPV-infected high-grade squamous intraepithelial lesions | ||
| N_HPV: HPV-infected normal cervix | ||
| Endometrium |  | AEH: Atypical endometrial hyperplasia |
| EEC: Endometrioid Cancer | ||
| Esophagus | 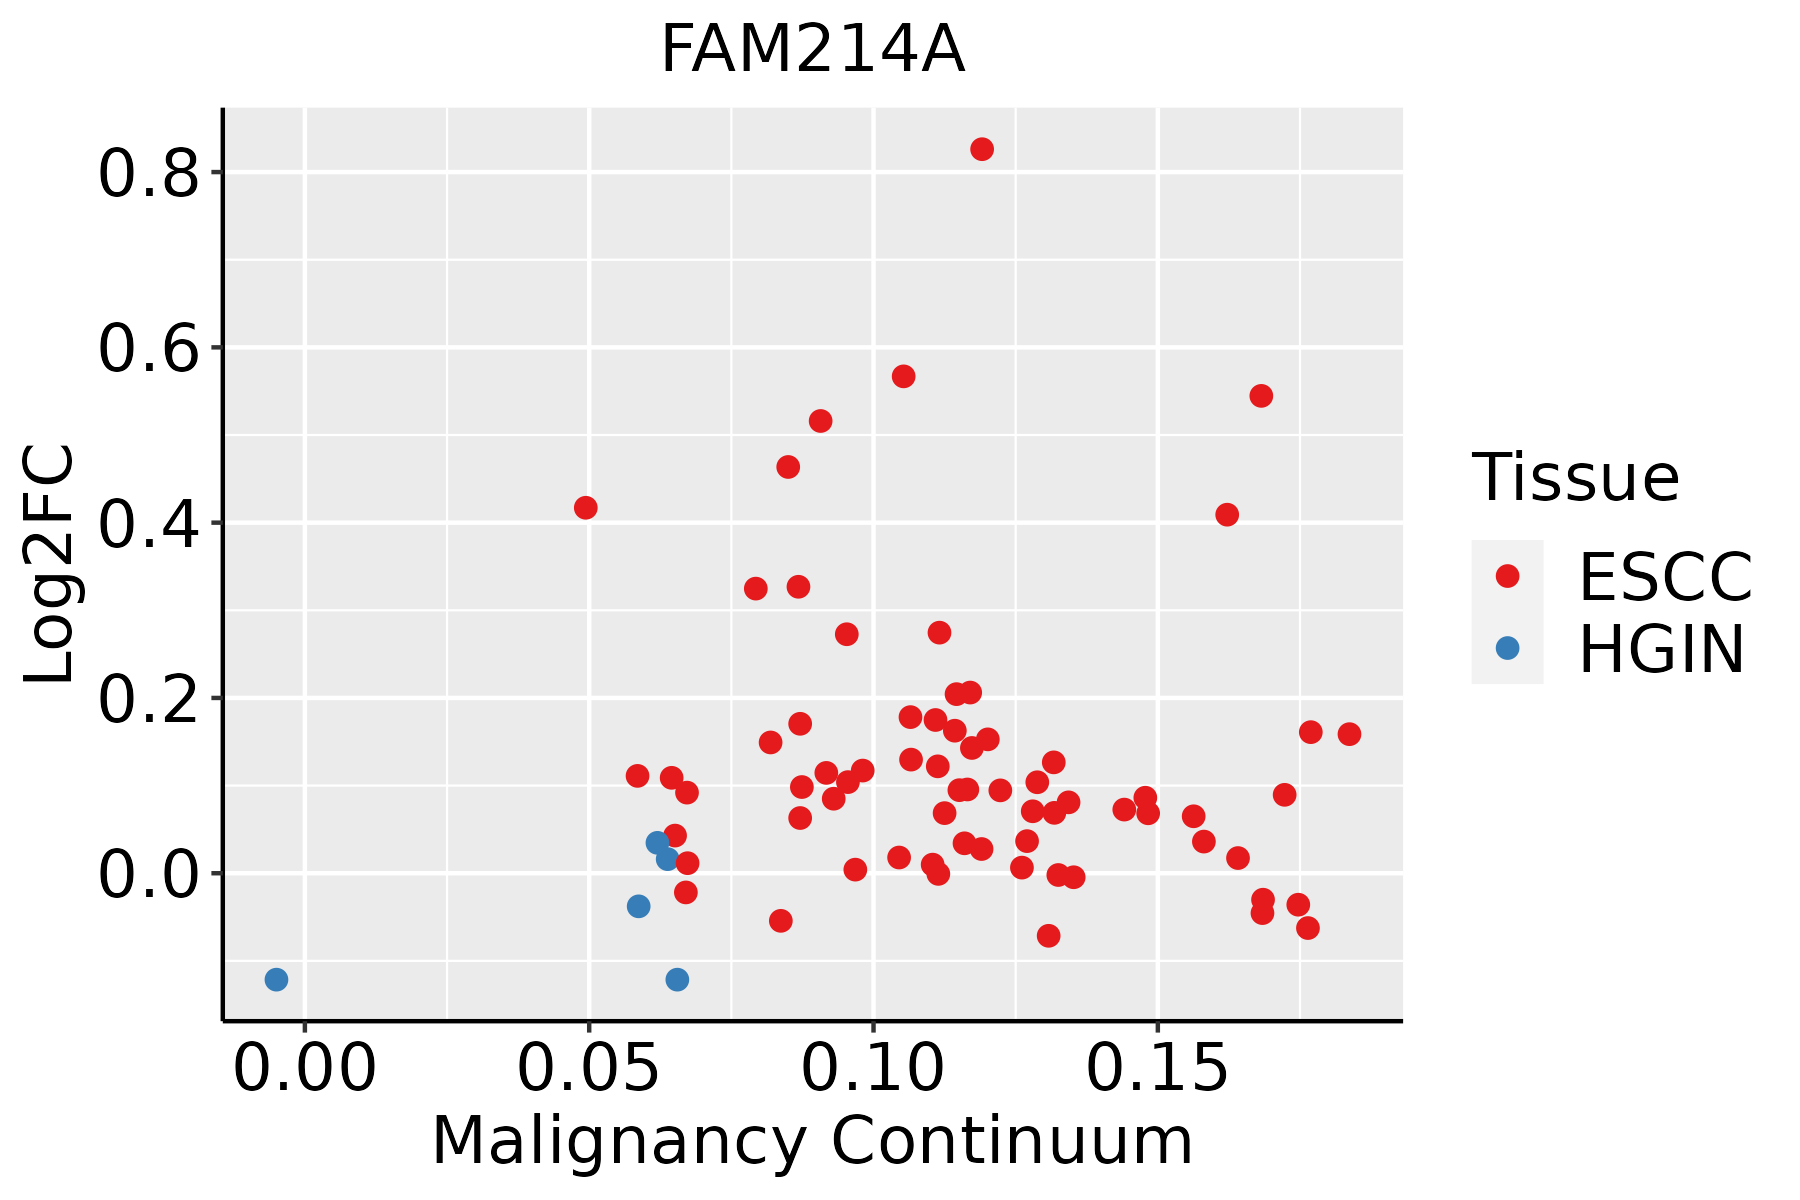 | ESCC: Esophageal squamous cell carcinoma |
| HGIN: High-grade intraepithelial neoplasias | ||
| LGIN: Low-grade intraepithelial neoplasias | ||
| Liver | 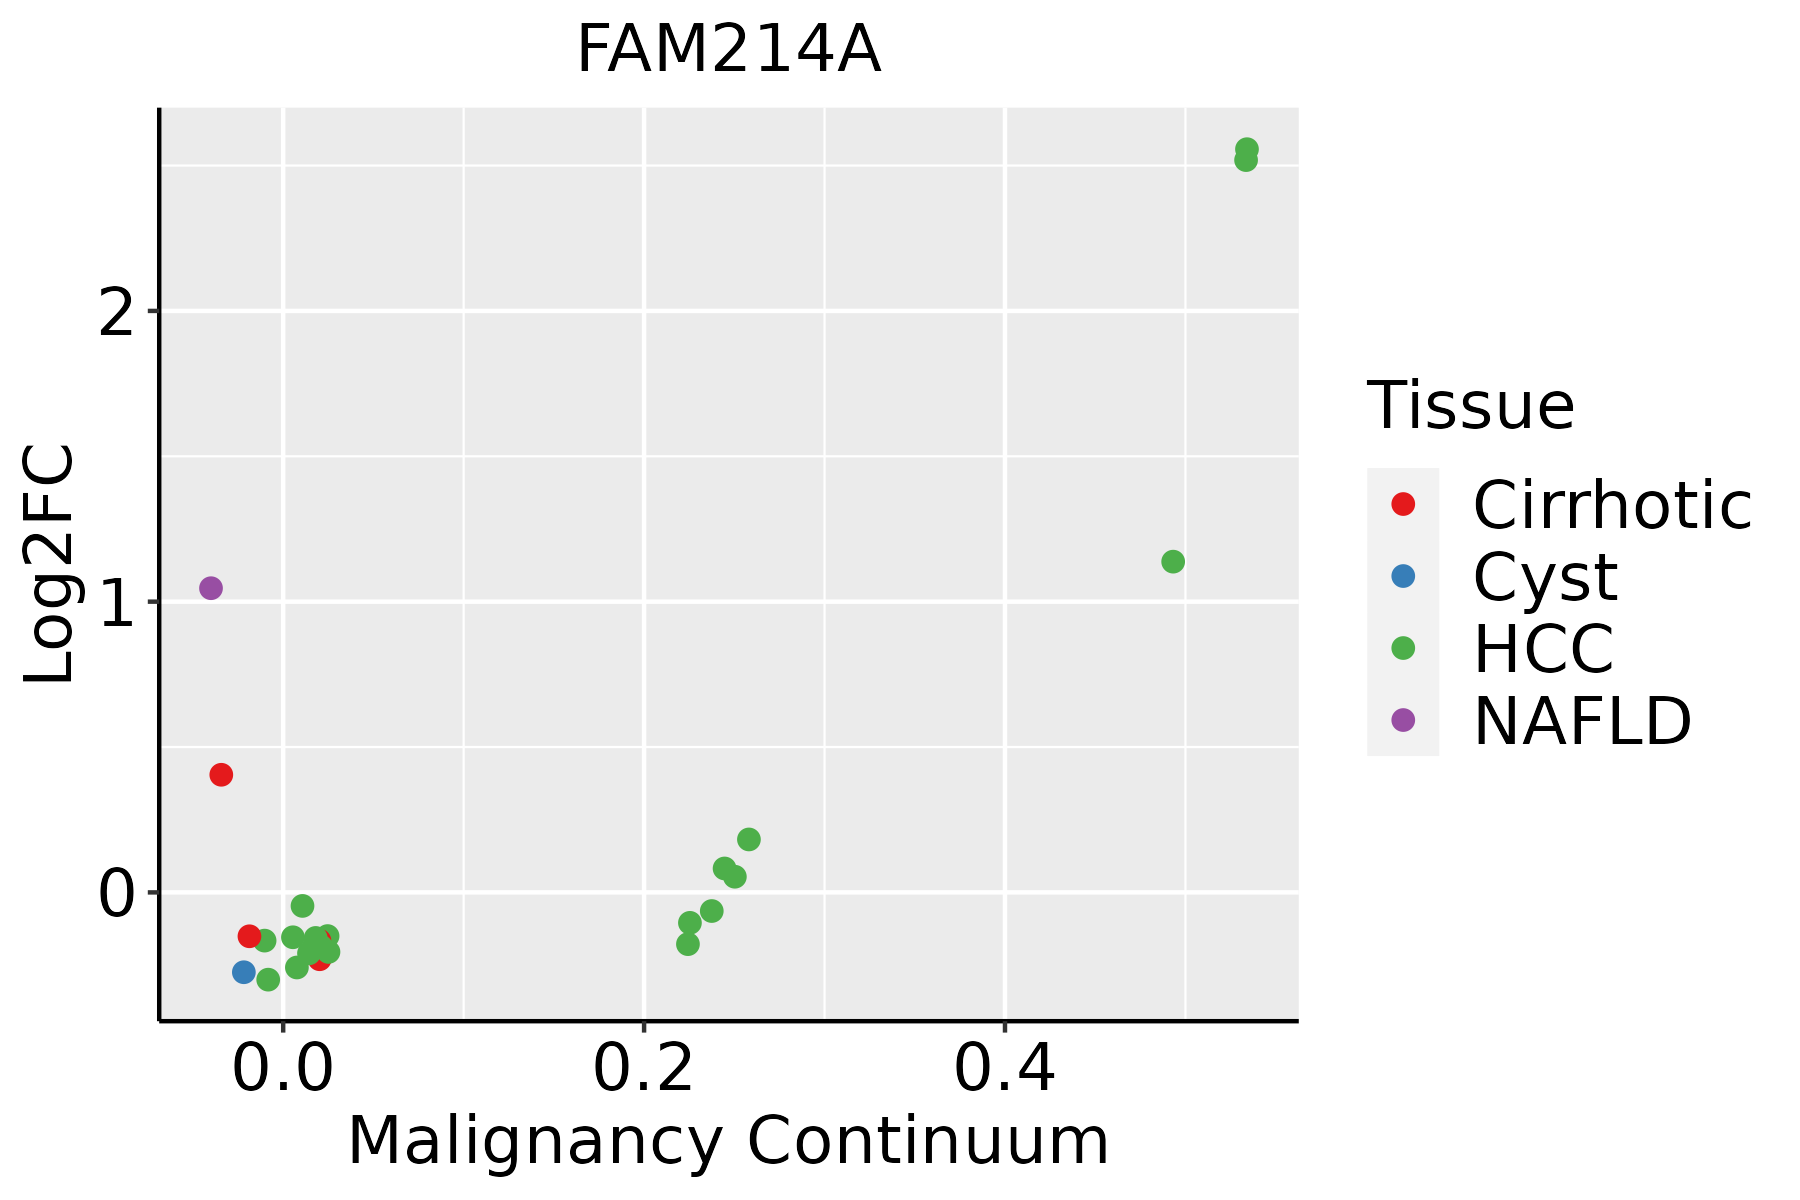 | HCC: Hepatocellular carcinoma |
| NAFLD: Non-alcoholic fatty liver disease | ||
| Prostate | 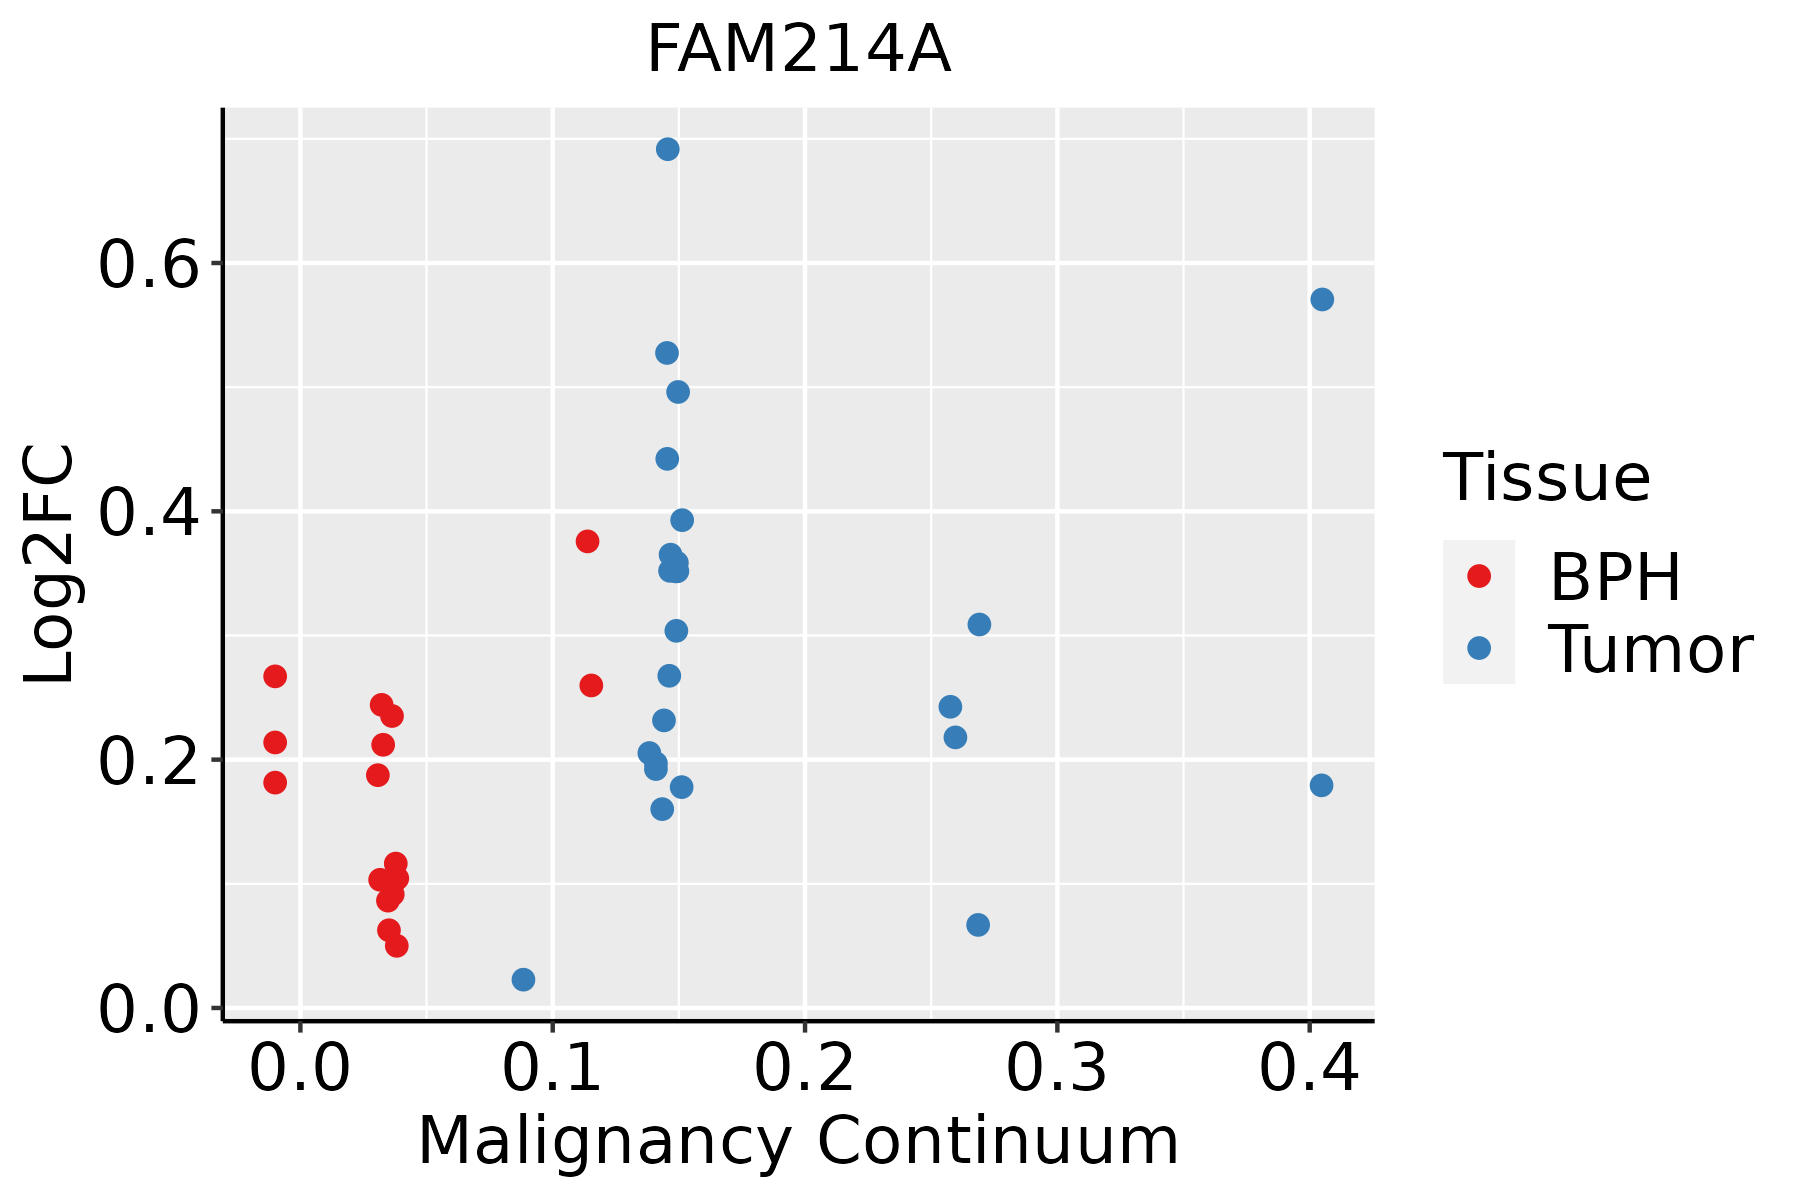 | BPH: Benign Prostatic Hyperplasia |
| Thyroid | 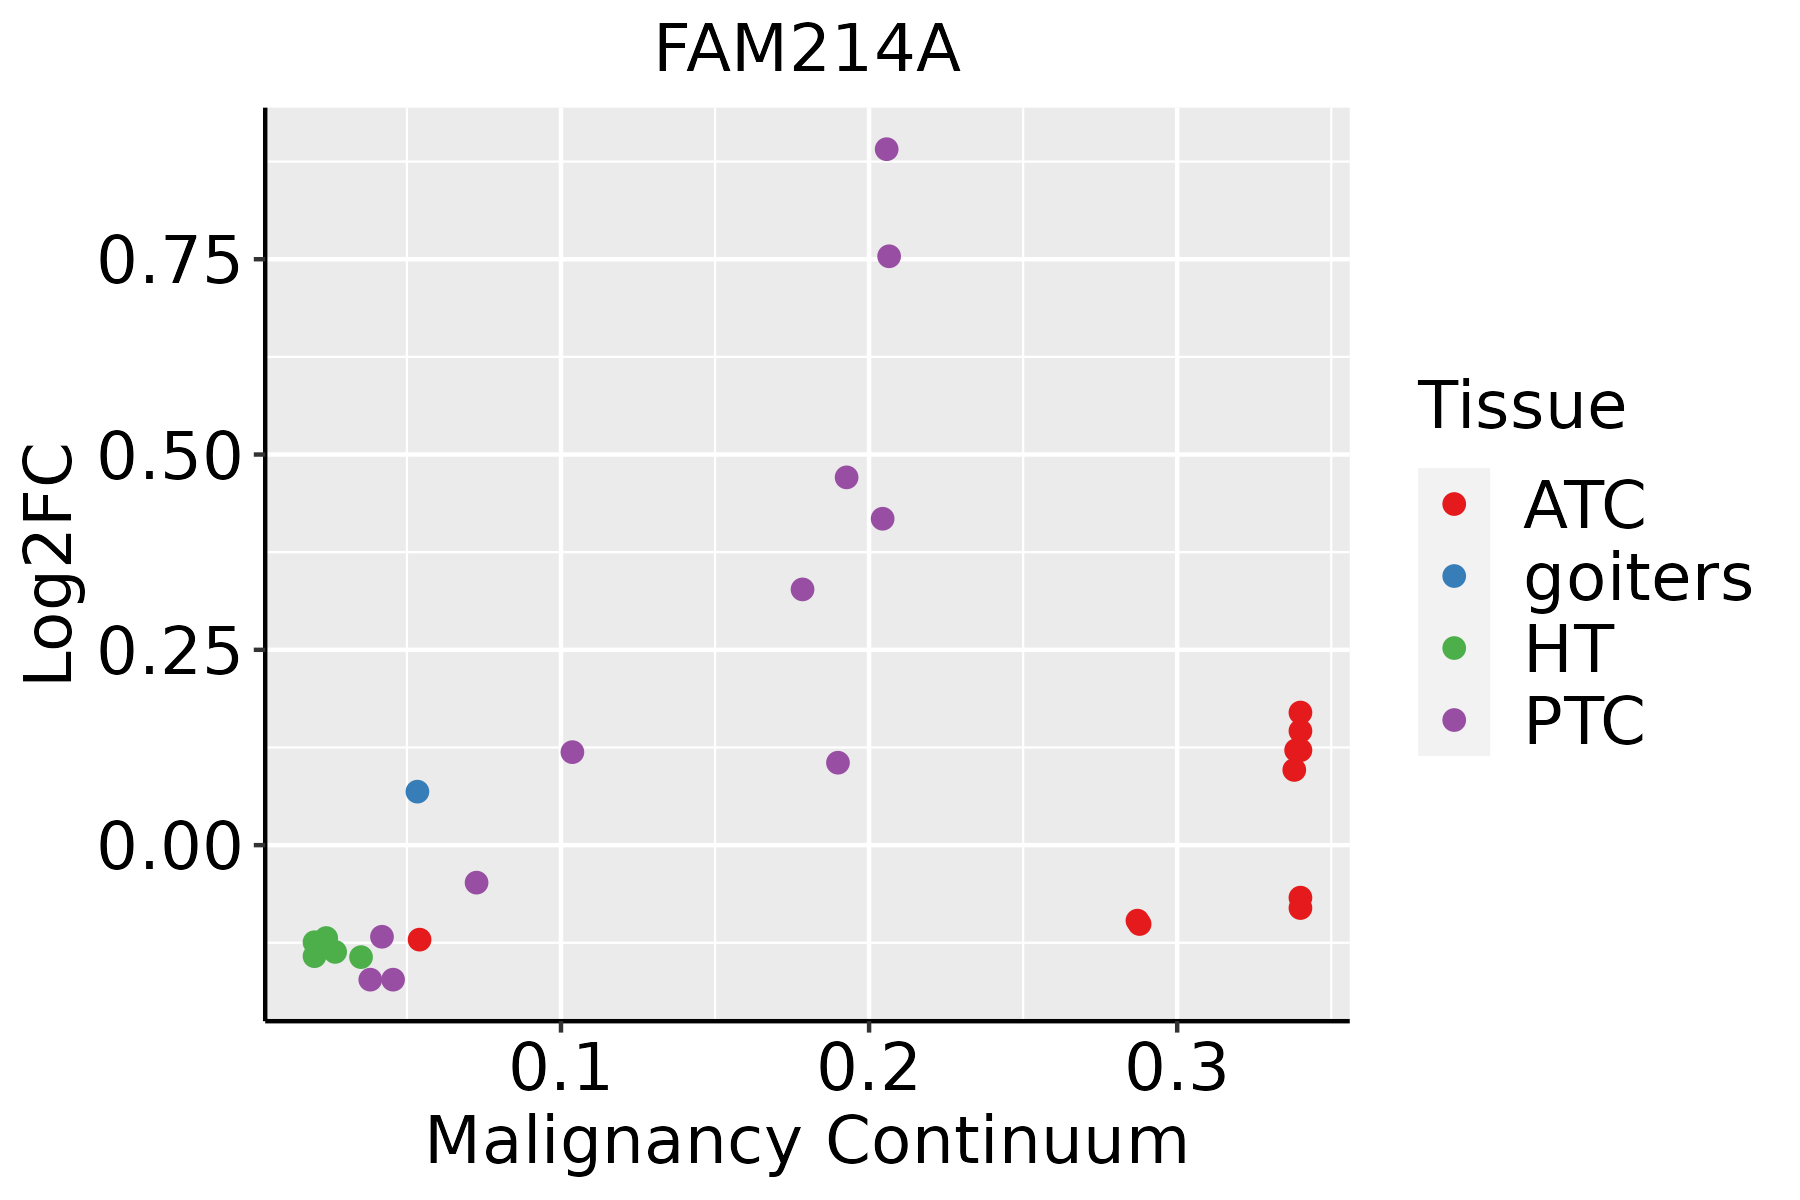 | ATC: Anaplastic thyroid cancer |
| HT: Hashimoto's thyroiditis | ||
| PTC: Papillary thyroid cancer |
| ∗log2FC in expression of this searched gene in stem-like cells from each diseased tissue sample relative to stem-like cells in normal samples in each tissue plotted against the malignancy continuum. Samples are colored based on if they are from different disease stage. |
Top |
Malignant transformation related pathway analysis |
| Find out the enriched GO biological processes and KEGG pathways involved in transition from healthy to precancer to cancer |
| Tissue | Disease Stage | Enriched GO biological Processes |
| Colorectum | AD |  |
| Colorectum | SER |  |
| Colorectum | MSS |  |
| Colorectum | MSI-H |  |
| Colorectum | FAP |  |
| ∗Top 15 enriched GO BP terms are showed in the bar plot of each disease state in each tissue. Each row represents a significant GO biological process which is colored according to the -log10(p.adjust). |
| Page: 1 2 3 4 5 6 7 8 9 |
| GO ID | Tissue | Disease Stage | Description | Gene Ratio | Bg Ratio | pvalue | p.adjust | Count |
| Page: 1 |
| Pathway ID | Tissue | Disease Stage | Description | Gene Ratio | Bg Ratio | pvalue | p.adjust | qvalue | Count |
| Page: 1 |
Top |
Cell-cell communication analysis |
| Identification of potential cell-cell interactions between two cell types and their ligand-receptor pairs for different disease states |
| Ligand | Receptor | LRpair | Pathway | Tissue | Disease Stage |
| Page: 1 |
Top |
Single-cell gene regulatory network inference analysis |
| Find out the significant the regulons (TFs) and the target genes of each regulon across cell types for different disease states |
| TF | Cell Type | Tissue | Disease Stage | Target Gene | RSS | Regulon Activity |
| ∗The dot plots of a searched regulon are shown for all cell subpopulations in each disease state of each tissue based on the regulon specific score inferred using pySCENIC and by calculating the average expression. |
| Page: 1 |
Top |
Somatic mutation of malignant transformation related genes |
| Annotation of somatic variants for genes involved in malignant transformation |
| Hugo Symbol | Variant Class | Variant Classification | dbSNP RS | HGVSc | HGVSp | HGVSp Short | SWISSPROT | BIOTYPE | SIFT | PolyPhen | Tumor Sample Barcode | Tissue | Histology | Sex | Age | Stage | Therapy Types | Drugs | Outcome |
| FAM214A | SNV | Missense_Mutation | c.3094C>A | p.Leu1032Met | p.L1032M | Q32MH5 | protein_coding | deleterious(0) | probably_damaging(0.999) | TCGA-A2-A25A-01 | Breast | breast invasive carcinoma | Female | <65 | I/II | Unspecific | Cytoxan | SD | |
| FAM214A | SNV | Missense_Mutation | c.481N>T | p.Val161Leu | p.V161L | Q32MH5 | protein_coding | tolerated(0.25) | probably_damaging(0.996) | TCGA-A8-A09A-01 | Breast | breast invasive carcinoma | Female | <65 | I/II | Hormone Therapy | tamoxiphen | SD | |
| FAM214A | SNV | Missense_Mutation | novel | c.2010G>T | p.Glu670Asp | p.E670D | Q32MH5 | protein_coding | tolerated(0.17) | benign(0.013) | TCGA-AN-A046-01 | Breast | breast invasive carcinoma | Female | >=65 | I/II | Unknown | Unknown | SD |
| FAM214A | SNV | Missense_Mutation | c.1769N>C | p.Arg590Thr | p.R590T | Q32MH5 | protein_coding | deleterious(0) | possibly_damaging(0.485) | TCGA-AN-A0XW-01 | Breast | breast invasive carcinoma | Female | <65 | III/IV | Unknown | Unknown | SD | |
| FAM214A | SNV | Missense_Mutation | c.1552N>G | p.His518Asp | p.H518D | Q32MH5 | protein_coding | deleterious(0.04) | benign(0.178) | TCGA-AR-A1AT-01 | Breast | breast invasive carcinoma | Female | <65 | I/II | Hormone Therapy | anastrozole | SD | |
| FAM214A | SNV | Missense_Mutation | rs544403410 | c.1920G>A | p.Met640Ile | p.M640I | Q32MH5 | protein_coding | tolerated(0.94) | benign(0) | TCGA-B6-A0WZ-01 | Breast | breast invasive carcinoma | Female | <65 | I/II | Unknown | Unknown | PD |
| FAM214A | SNV | Missense_Mutation | c.2879C>T | p.Pro960Leu | p.P960L | Q32MH5 | protein_coding | deleterious(0.01) | possibly_damaging(0.664) | TCGA-D8-A1X6-01 | Breast | breast invasive carcinoma | Female | >=65 | III/IV | Hormone Therapy | tamoxiphen | SD | |
| FAM214A | SNV | Missense_Mutation | c.1597G>A | p.Glu533Lys | p.E533K | Q32MH5 | protein_coding | deleterious(0.02) | possibly_damaging(0.544) | TCGA-GM-A2D9-01 | Breast | breast invasive carcinoma | Female | >=65 | I/II | Hormone Therapy | arimidex | SD | |
| FAM214A | insertion | Nonsense_Mutation | novel | c.884_885insCATCACATATCCCCCGGCAGTCATTCAACATGCATGAC | p.Pro296IlefsTer12 | p.P296Ifs*12 | Q32MH5 | protein_coding | TCGA-A8-A09E-01 | Breast | breast invasive carcinoma | Female | >=65 | III/IV | Hormone Therapy | anastrozole | SD | ||
| FAM214A | deletion | Frame_Shift_Del | novel | c.3179delN | p.Asp1060ValfsTer28 | p.D1060Vfs*28 | Q32MH5 | protein_coding | TCGA-D8-A27V-01 | Breast | breast invasive carcinoma | Female | <65 | I/II | Hormone Therapy | tamoxiphen | SD |
| Page: 1 2 3 4 5 6 7 8 9 10 11 12 13 |
Top |
Related drugs of malignant transformation related genes |
| Identification of chemicals and drugs interact with genes involved in malignant transfromation |
| (DGIdb 4.0) |
| Entrez ID | Symbol | Category | Interaction Types | Drug Claim Name | Drug Name | PMIDs |
| Page: 1 |

Copyright 2023-Present -The University of Texas Health Science Center at Houston |