
|
|||||
|
 | |
| |
| |
| |
| |
| |
|
Gene: FAM20B |
Gene summary for FAM20B |
| Gene information | Species | Human | Gene symbol | FAM20B | Gene ID | 9917 |
| Gene name | FAM20B glycosaminoglycan xylosylkinase | |
| Gene Alias | gxk1 | |
| Cytomap | 1q25.2 | |
| Gene Type | protein-coding | GO ID | GO:0006029 | UniProtAcc | A0A024R918 |
Top |
Malignant transformation analysis |
| Identification of the aberrant gene expression in precancerous and cancerous lesions by comparing the gene expression of stem-like cells in diseased tissues with normal stem cells |
| Entrez ID | Symbol | Replicates | Species | Organ | Tissue | Adj P-value | Log2FC | Malignancy |
| 9917 | FAM20B | P75T-E | Human | Esophagus | ESCC | 7.50e-08 | 1.21e-01 | 0.1125 |
| 9917 | FAM20B | P76T-E | Human | Esophagus | ESCC | 1.55e-10 | 8.58e-02 | 0.1207 |
| 9917 | FAM20B | P79T-E | Human | Esophagus | ESCC | 1.08e-10 | 7.78e-02 | 0.1154 |
| 9917 | FAM20B | P80T-E | Human | Esophagus | ESCC | 7.79e-11 | 2.42e-01 | 0.155 |
| 9917 | FAM20B | P82T-E | Human | Esophagus | ESCC | 3.46e-02 | 1.78e-02 | 0.1072 |
| 9917 | FAM20B | P83T-E | Human | Esophagus | ESCC | 1.54e-06 | 1.24e-01 | 0.1738 |
| 9917 | FAM20B | P89T-E | Human | Esophagus | ESCC | 1.17e-06 | 2.12e-01 | 0.1752 |
| 9917 | FAM20B | P91T-E | Human | Esophagus | ESCC | 1.24e-03 | 2.53e-01 | 0.1828 |
| 9917 | FAM20B | P107T-E | Human | Esophagus | ESCC | 1.42e-09 | 1.30e-01 | 0.171 |
| 9917 | FAM20B | P126T-E | Human | Esophagus | ESCC | 7.68e-03 | 1.02e-01 | 0.1125 |
| 9917 | FAM20B | P127T-E | Human | Esophagus | ESCC | 5.57e-12 | 6.78e-02 | 0.0826 |
| 9917 | FAM20B | P128T-E | Human | Esophagus | ESCC | 2.28e-18 | 2.73e-01 | 0.1241 |
| 9917 | FAM20B | P130T-E | Human | Esophagus | ESCC | 2.03e-13 | 3.20e-01 | 0.1676 |
| 9917 | FAM20B | HCC1_Meng | Human | Liver | HCC | 3.60e-39 | 3.05e-02 | 0.0246 |
| 9917 | FAM20B | HCC2_Meng | Human | Liver | HCC | 1.58e-09 | 8.66e-02 | 0.0107 |
| 9917 | FAM20B | HCC1 | Human | Liver | HCC | 2.78e-13 | 2.64e+00 | 0.5336 |
| 9917 | FAM20B | HCC2 | Human | Liver | HCC | 2.37e-25 | 2.64e+00 | 0.5341 |
| 9917 | FAM20B | HCC5 | Human | Liver | HCC | 5.27e-06 | 9.58e-01 | 0.4932 |
| 9917 | FAM20B | S014 | Human | Liver | HCC | 8.41e-04 | 2.39e-01 | 0.2254 |
| 9917 | FAM20B | S015 | Human | Liver | HCC | 6.41e-07 | 3.67e-01 | 0.2375 |
| Page: 1 2 3 4 |
| Tissue | Expression Dynamics | Abbreviation |
| Esophagus | 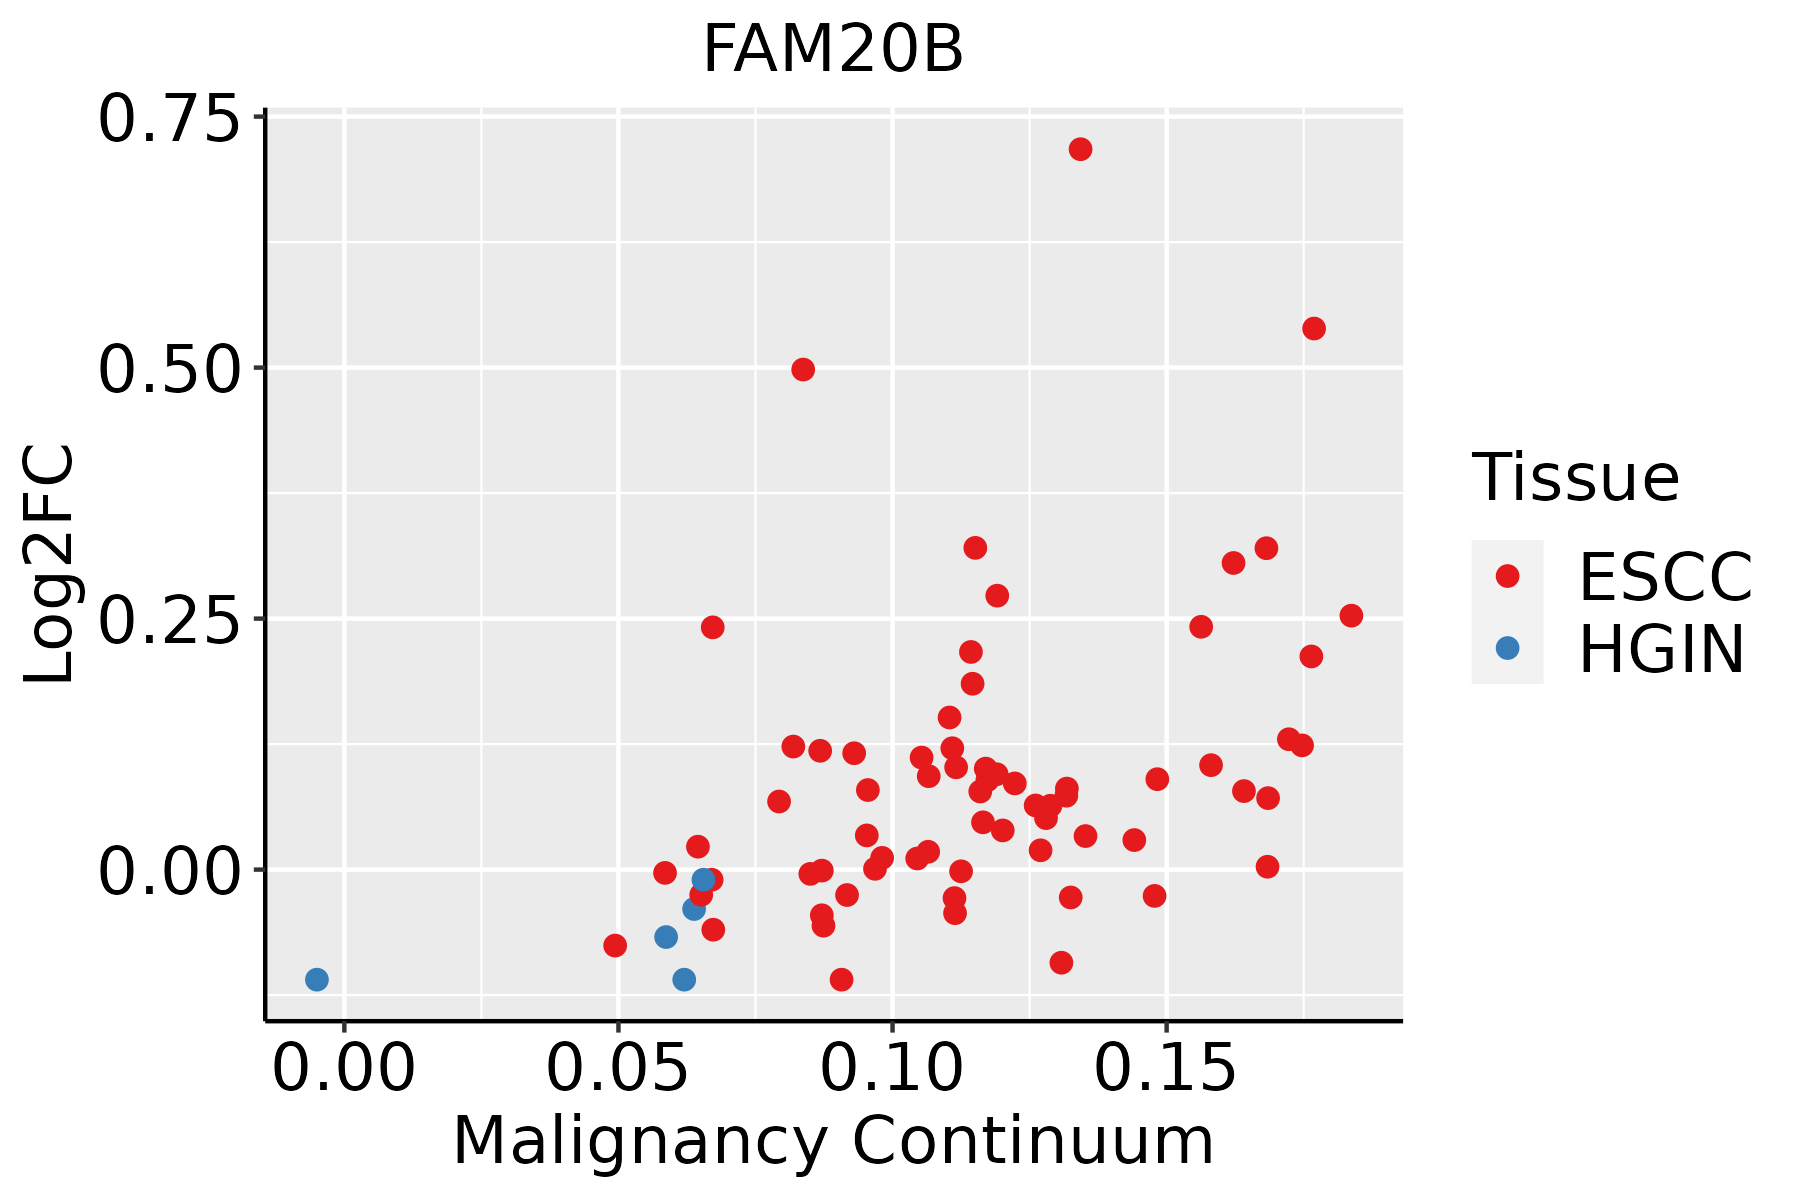 | ESCC: Esophageal squamous cell carcinoma |
| HGIN: High-grade intraepithelial neoplasias | ||
| LGIN: Low-grade intraepithelial neoplasias | ||
| Liver | 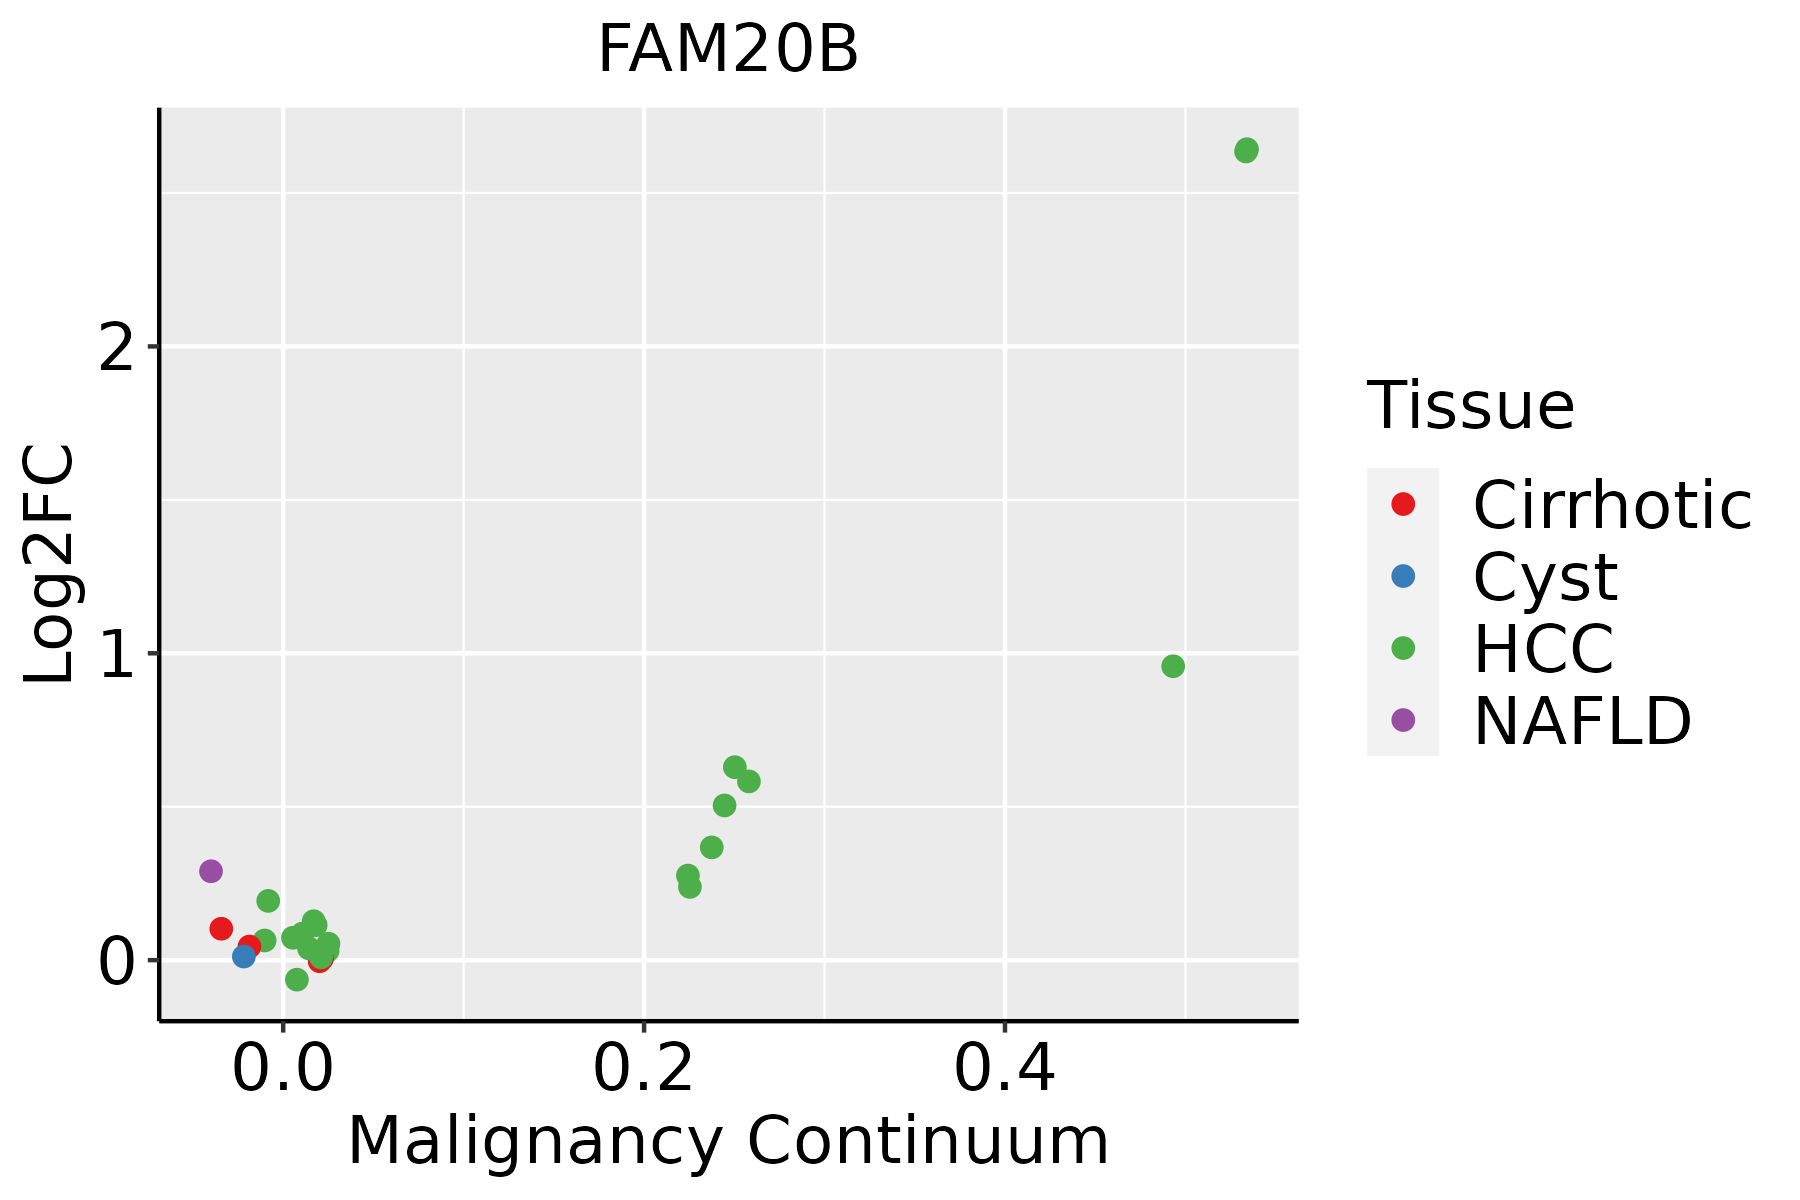 | HCC: Hepatocellular carcinoma |
| NAFLD: Non-alcoholic fatty liver disease |
| ∗log2FC in expression of this searched gene in stem-like cells from each diseased tissue sample relative to stem-like cells in normal samples in each tissue plotted against the malignancy continuum. Samples are colored based on if they are from different disease stage. |
Top |
Malignant transformation related pathway analysis |
| Find out the enriched GO biological processes and KEGG pathways involved in transition from healthy to precancer to cancer |
| Tissue | Disease Stage | Enriched GO biological Processes |
| Colorectum | AD |  |
| Colorectum | SER |  |
| Colorectum | MSS |  |
| Colorectum | MSI-H |  |
| Colorectum | FAP |  |
| ∗Top 15 enriched GO BP terms are showed in the bar plot of each disease state in each tissue. Each row represents a significant GO biological process which is colored according to the -log10(p.adjust). |
| Page: 1 2 3 4 5 6 7 8 9 |
| GO ID | Tissue | Disease Stage | Description | Gene Ratio | Bg Ratio | pvalue | p.adjust | Count |
| GO:00091002 | Esophagus | ESCC | glycoprotein metabolic process | 226/8552 | 387/18723 | 2.64e-07 | 3.94e-06 | 226 |
| GO:00091012 | Esophagus | ESCC | glycoprotein biosynthetic process | 181/8552 | 317/18723 | 2.54e-05 | 2.15e-04 | 181 |
| GO:0006029 | Esophagus | ESCC | proteoglycan metabolic process | 48/8552 | 79/18723 | 4.93e-03 | 1.89e-02 | 48 |
| GO:0030166 | Esophagus | ESCC | proteoglycan biosynthetic process | 35/8552 | 56/18723 | 8.30e-03 | 2.94e-02 | 35 |
| GO:0009100 | Liver | HCC | glycoprotein metabolic process | 193/7958 | 387/18723 | 1.89e-03 | 9.62e-03 | 193 |
| Page: 1 |
| Pathway ID | Tissue | Disease Stage | Description | Gene Ratio | Bg Ratio | pvalue | p.adjust | qvalue | Count |
| Page: 1 |
Top |
Cell-cell communication analysis |
| Identification of potential cell-cell interactions between two cell types and their ligand-receptor pairs for different disease states |
| Ligand | Receptor | LRpair | Pathway | Tissue | Disease Stage |
| Page: 1 |
Top |
Single-cell gene regulatory network inference analysis |
| Find out the significant the regulons (TFs) and the target genes of each regulon across cell types for different disease states |
| TF | Cell Type | Tissue | Disease Stage | Target Gene | RSS | Regulon Activity |
| ∗The dot plots of a searched regulon are shown for all cell subpopulations in each disease state of each tissue based on the regulon specific score inferred using pySCENIC and by calculating the average expression. |
| Page: 1 |
Top |
Somatic mutation of malignant transformation related genes |
| Annotation of somatic variants for genes involved in malignant transformation |
| Hugo Symbol | Variant Class | Variant Classification | dbSNP RS | HGVSc | HGVSp | HGVSp Short | SWISSPROT | BIOTYPE | SIFT | PolyPhen | Tumor Sample Barcode | Tissue | Histology | Sex | Age | Stage | Therapy Types | Drugs | Outcome |
| FAM20B | SNV | Missense_Mutation | c.592N>A | p.Tyr198Asn | p.Y198N | O75063 | protein_coding | deleterious(0) | probably_damaging(0.988) | TCGA-A2-A0YG-01 | Breast | breast invasive carcinoma | Female | <65 | III/IV | Chemotherapy | cytoxan | SD | |
| FAM20B | SNV | Missense_Mutation | rs745360443 | c.386N>A | p.Arg129Gln | p.R129Q | O75063 | protein_coding | deleterious(0.01) | probably_damaging(0.953) | TCGA-AR-A255-01 | Breast | breast invasive carcinoma | Female | <65 | I/II | Targeted Molecular therapy | trastuzumab | SD |
| FAM20B | SNV | Missense_Mutation | c.22G>C | p.Val8Leu | p.V8L | O75063 | protein_coding | tolerated(0.05) | benign(0.156) | TCGA-BH-A8FZ-01 | Breast | breast invasive carcinoma | Female | <65 | I/II | Unknown | Unknown | SD | |
| FAM20B | deletion | Frame_Shift_Del | novel | c.1086delC | p.Ile363SerfsTer18 | p.I363Sfs*18 | O75063 | protein_coding | TCGA-D8-A27V-01 | Breast | breast invasive carcinoma | Female | <65 | I/II | Hormone Therapy | tamoxiphen | SD | ||
| FAM20B | SNV | Missense_Mutation | rs752917401 | c.953N>T | p.Ser318Leu | p.S318L | O75063 | protein_coding | tolerated(0.64) | benign(0) | TCGA-EA-A3HS-01 | Cervix | cervical & endocervical cancer | Female | <65 | I/II | Unknown | Unknown | SD |
| FAM20B | SNV | Missense_Mutation | rs772062570 | c.811C>T | p.Arg271Cys | p.R271C | O75063 | protein_coding | deleterious(0.01) | probably_damaging(0.998) | TCGA-A6-5665-01 | Colorectum | colon adenocarcinoma | Female | >=65 | I/II | Unknown | Unknown | PD |
| FAM20B | SNV | Missense_Mutation | c.233C>A | p.Pro78His | p.P78H | O75063 | protein_coding | deleterious(0) | probably_damaging(0.99) | TCGA-A6-6781-01 | Colorectum | colon adenocarcinoma | Male | <65 | III/IV | Chemotherapy | oxaliplatin | SD | |
| FAM20B | SNV | Missense_Mutation | rs764933820 | c.728G>A | p.Arg243Gln | p.R243Q | O75063 | protein_coding | tolerated(0.26) | benign(0.42) | TCGA-AA-3510-01 | Colorectum | colon adenocarcinoma | Male | >=65 | I/II | Unknown | Unknown | SD |
| FAM20B | SNV | Missense_Mutation | c.869G>A | p.Arg290His | p.R290H | O75063 | protein_coding | deleterious(0) | probably_damaging(0.997) | TCGA-AA-A00N-01 | Colorectum | colon adenocarcinoma | Male | >=65 | I/II | Unknown | Unknown | PD | |
| FAM20B | SNV | Missense_Mutation | c.274N>A | p.Ala92Thr | p.A92T | O75063 | protein_coding | tolerated(0.31) | benign(0) | TCGA-AD-6889-01 | Colorectum | colon adenocarcinoma | Male | >=65 | I/II | Chemotherapy | xeloda | PD |
| Page: 1 2 3 4 5 6 |
Top |
Related drugs of malignant transformation related genes |
| Identification of chemicals and drugs interact with genes involved in malignant transfromation |
| (DGIdb 4.0) |
| Entrez ID | Symbol | Category | Interaction Types | Drug Claim Name | Drug Name | PMIDs |
| Page: 1 |

Copyright 2023-Present -The University of Texas Health Science Center at Houston |