
|
|||||
|
 | |
| |
| |
| |
| |
| |
|
Gene: ENDOD1 |
Gene summary for ENDOD1 |
| Gene information | Species | Human | Gene symbol | ENDOD1 | Gene ID | 23052 |
| Gene name | endonuclease domain containing 1 | |
| Gene Alias | ENDOD1 | |
| Cytomap | 11q21 | |
| Gene Type | protein-coding | GO ID | GO:0006139 | UniProtAcc | O94919 |
Top |
Malignant transformation analysis |
| Identification of the aberrant gene expression in precancerous and cancerous lesions by comparing the gene expression of stem-like cells in diseased tissues with normal stem cells |
| Entrez ID | Symbol | Replicates | Species | Organ | Tissue | Adj P-value | Log2FC | Malignancy |
| 23052 | ENDOD1 | P74T-E | Human | Esophagus | ESCC | 2.62e-27 | 8.00e-01 | 0.1479 |
| 23052 | ENDOD1 | P75T-E | Human | Esophagus | ESCC | 2.07e-22 | 2.35e-01 | 0.1125 |
| 23052 | ENDOD1 | P76T-E | Human | Esophagus | ESCC | 1.02e-32 | 5.46e-01 | 0.1207 |
| 23052 | ENDOD1 | P79T-E | Human | Esophagus | ESCC | 9.33e-44 | 8.70e-01 | 0.1154 |
| 23052 | ENDOD1 | P80T-E | Human | Esophagus | ESCC | 7.73e-11 | 2.39e-01 | 0.155 |
| 23052 | ENDOD1 | P82T-E | Human | Esophagus | ESCC | 3.70e-06 | 6.09e-01 | 0.1072 |
| 23052 | ENDOD1 | P83T-E | Human | Esophagus | ESCC | 8.59e-24 | 6.25e-01 | 0.1738 |
| 23052 | ENDOD1 | P89T-E | Human | Esophagus | ESCC | 4.95e-11 | 5.80e-01 | 0.1752 |
| 23052 | ENDOD1 | P107T-E | Human | Esophagus | ESCC | 2.76e-40 | 9.47e-01 | 0.171 |
| 23052 | ENDOD1 | P128T-E | Human | Esophagus | ESCC | 1.49e-26 | 8.10e-01 | 0.1241 |
| 23052 | ENDOD1 | P130T-E | Human | Esophagus | ESCC | 8.48e-39 | 8.33e-01 | 0.1676 |
| 23052 | ENDOD1 | C04 | Human | Oral cavity | OSCC | 1.04e-08 | 4.42e-01 | 0.2633 |
| 23052 | ENDOD1 | C21 | Human | Oral cavity | OSCC | 2.06e-41 | 1.27e+00 | 0.2678 |
| 23052 | ENDOD1 | C30 | Human | Oral cavity | OSCC | 3.58e-38 | 1.32e+00 | 0.3055 |
| 23052 | ENDOD1 | C51 | Human | Oral cavity | OSCC | 3.47e-06 | 2.70e-01 | 0.2674 |
| 23052 | ENDOD1 | C08 | Human | Oral cavity | OSCC | 1.10e-03 | 1.26e-01 | 0.1919 |
| 23052 | ENDOD1 | C09 | Human | Oral cavity | OSCC | 1.10e-06 | 3.16e-01 | 0.1431 |
| 23052 | ENDOD1 | LP15 | Human | Oral cavity | LP | 3.05e-02 | 3.16e-01 | 0.2174 |
| 23052 | ENDOD1 | SYSMH1 | Human | Oral cavity | OSCC | 2.43e-55 | 1.14e+00 | 0.1127 |
| 23052 | ENDOD1 | SYSMH2 | Human | Oral cavity | OSCC | 3.47e-05 | 1.82e-01 | 0.2326 |
| Page: 1 2 3 4 5 |
| Tissue | Expression Dynamics | Abbreviation |
| Esophagus | 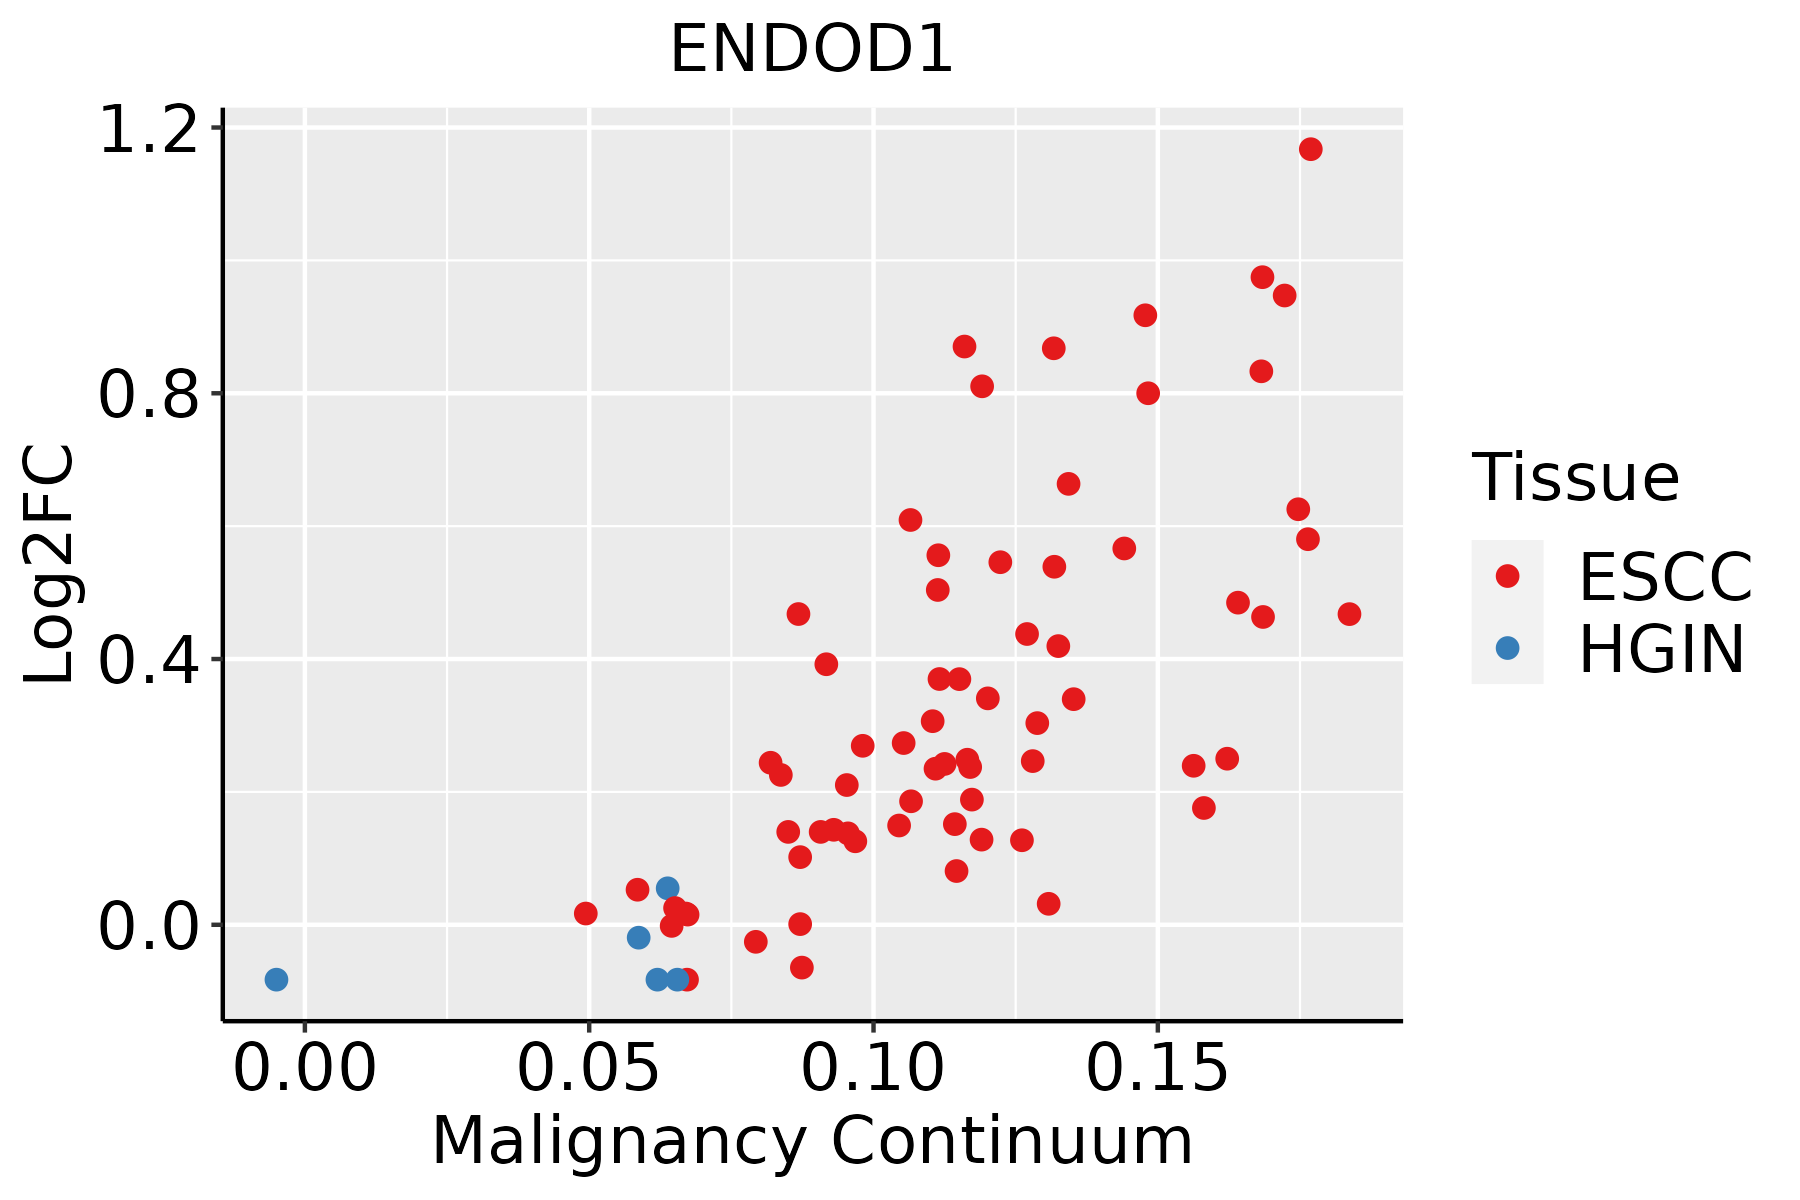 | ESCC: Esophageal squamous cell carcinoma |
| HGIN: High-grade intraepithelial neoplasias | ||
| LGIN: Low-grade intraepithelial neoplasias | ||
| Oral Cavity | 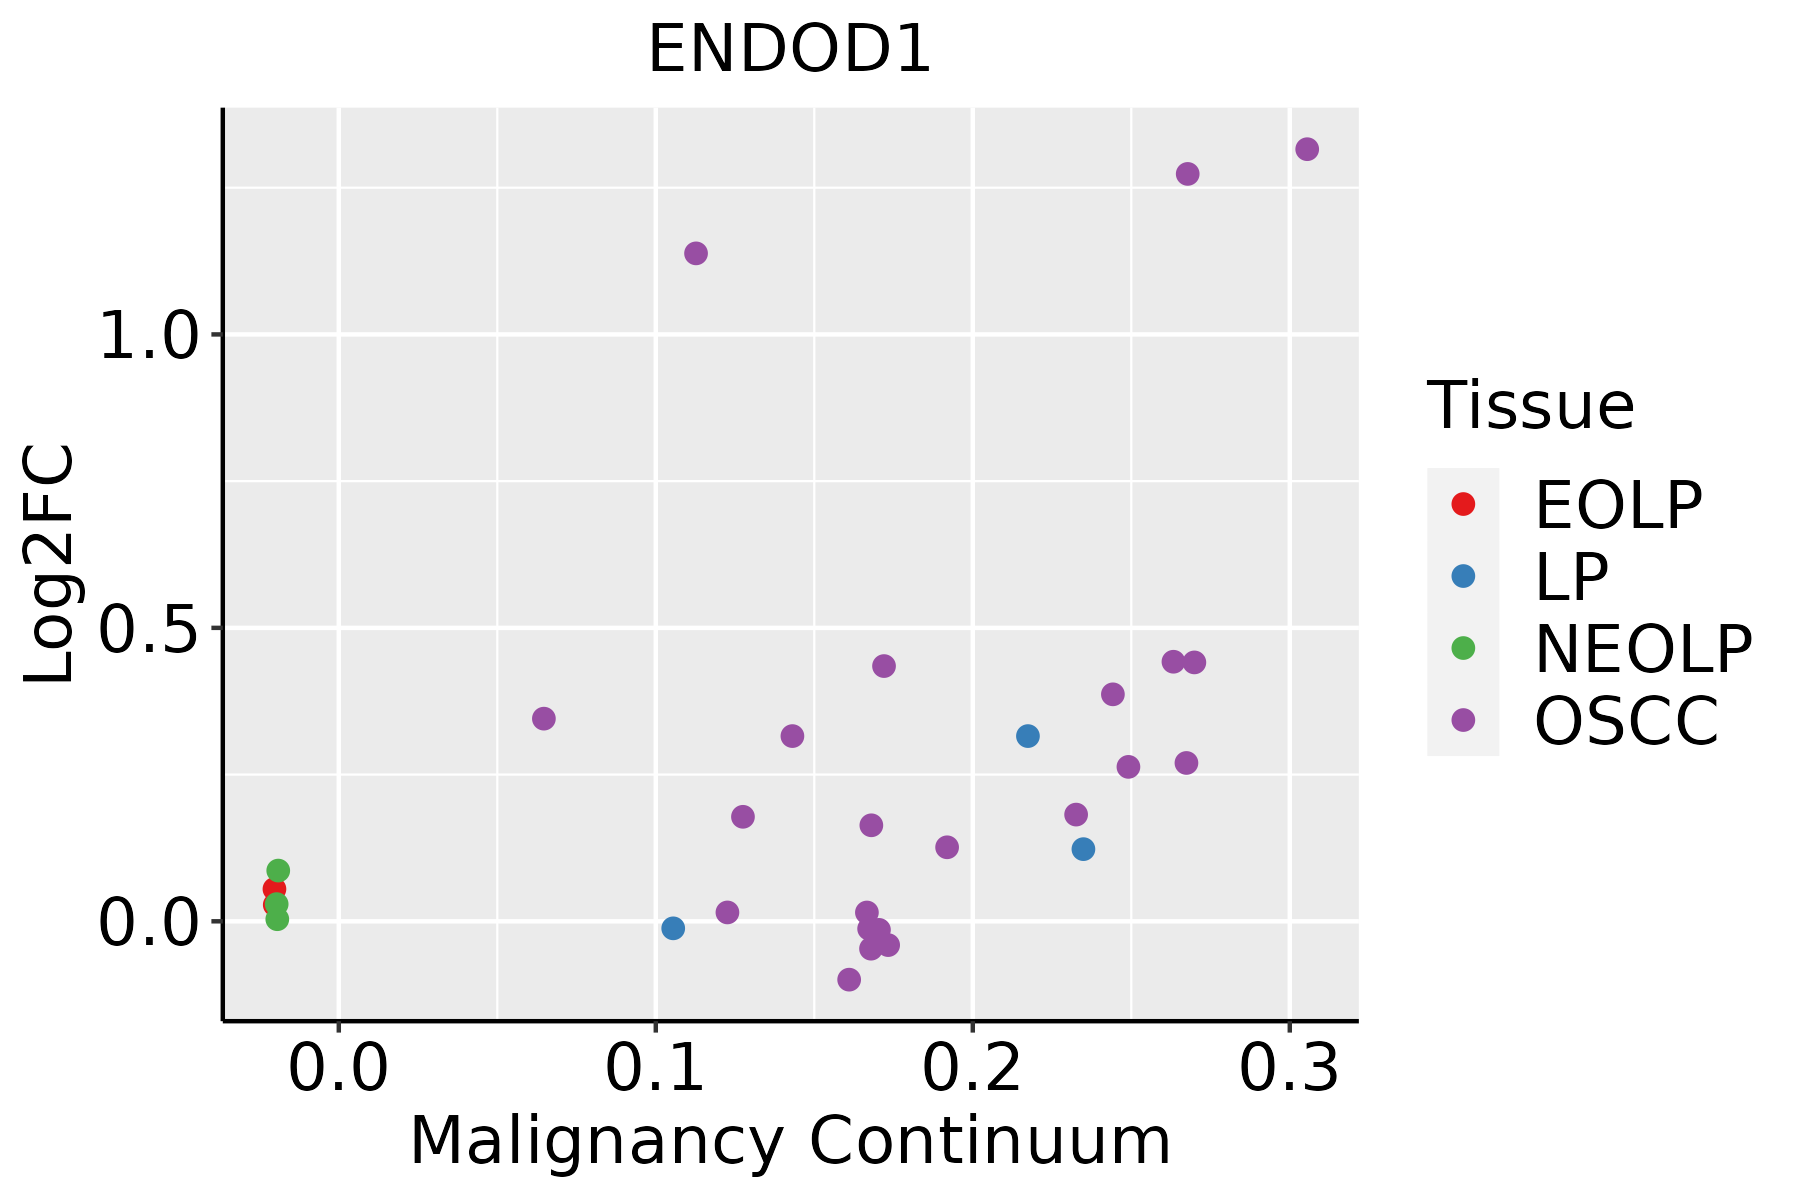 | EOLP: Erosive Oral lichen planus |
| LP: leukoplakia | ||
| NEOLP: Non-erosive oral lichen planus | ||
| OSCC: Oral squamous cell carcinoma | ||
| Prostate | 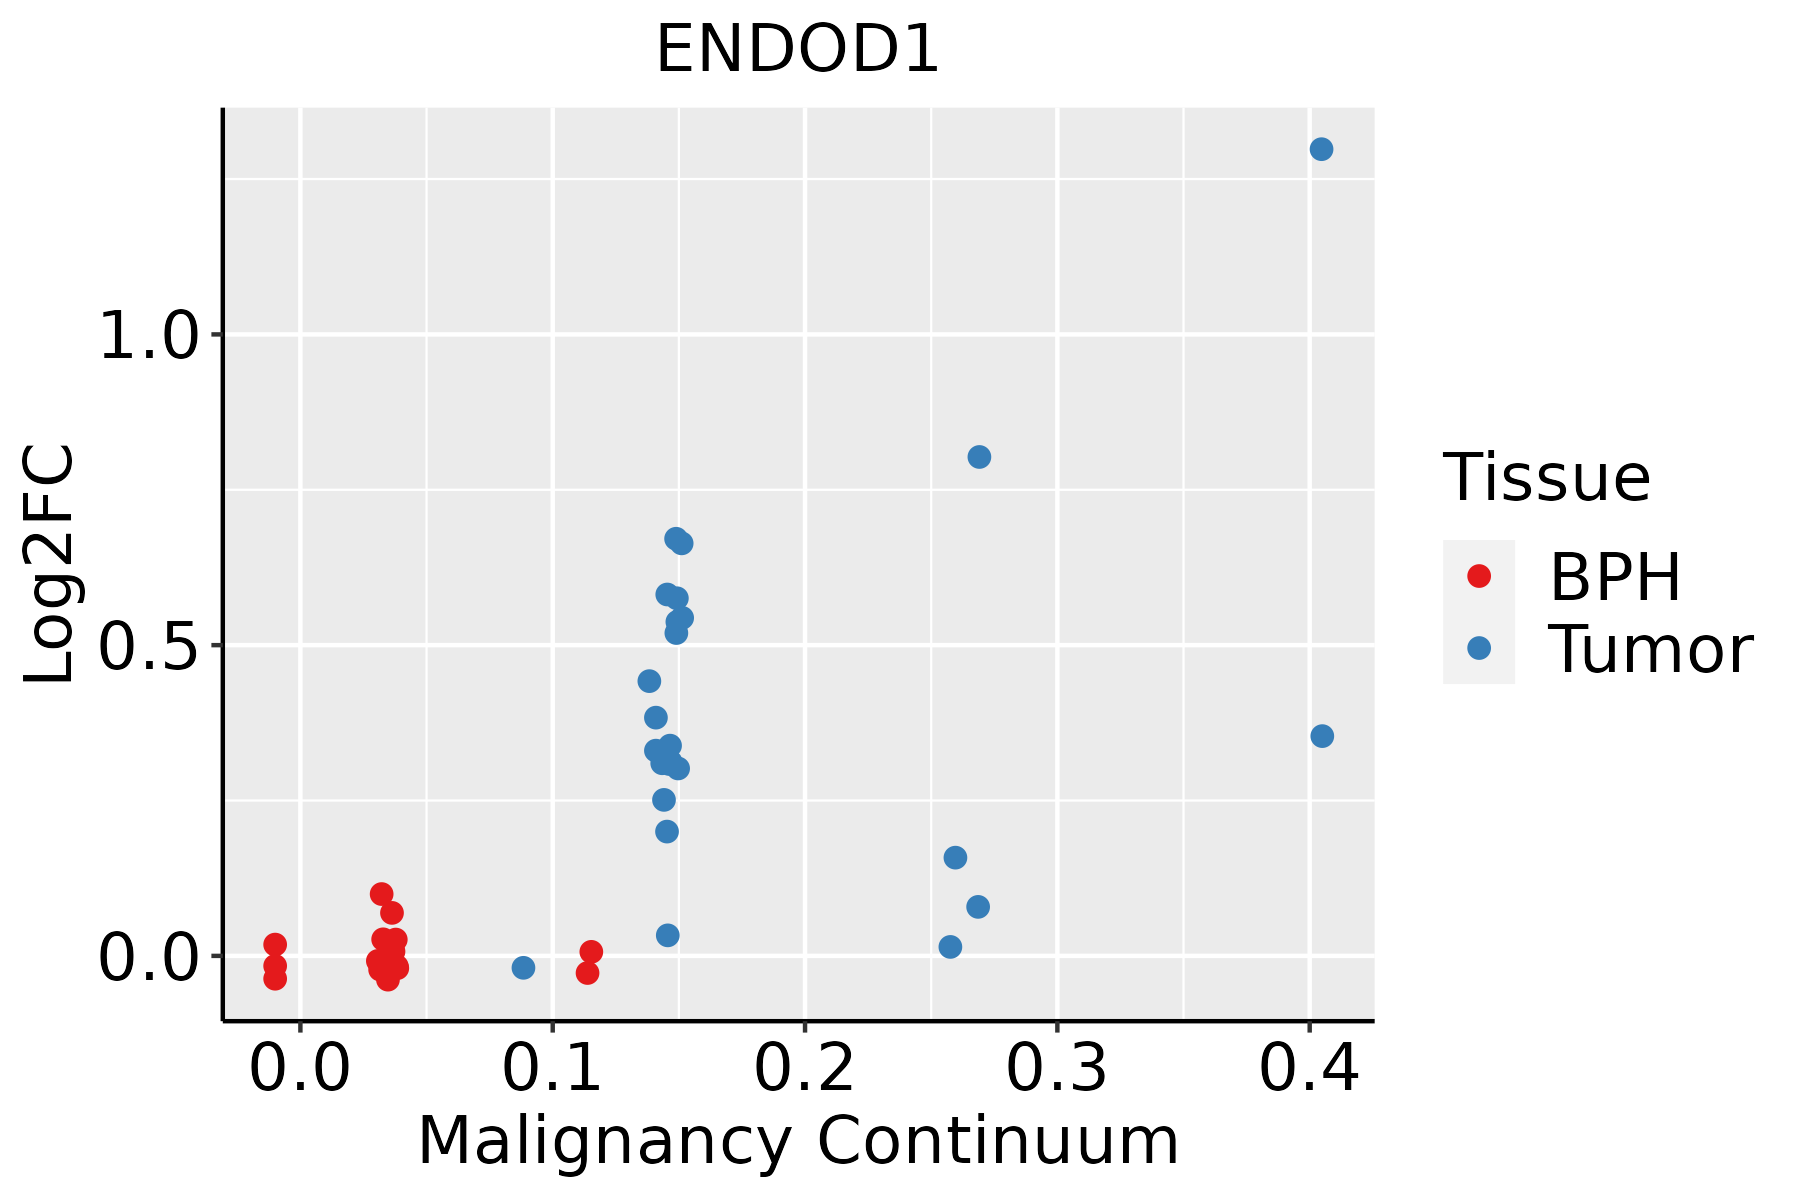 | BPH: Benign Prostatic Hyperplasia |
| Skin | 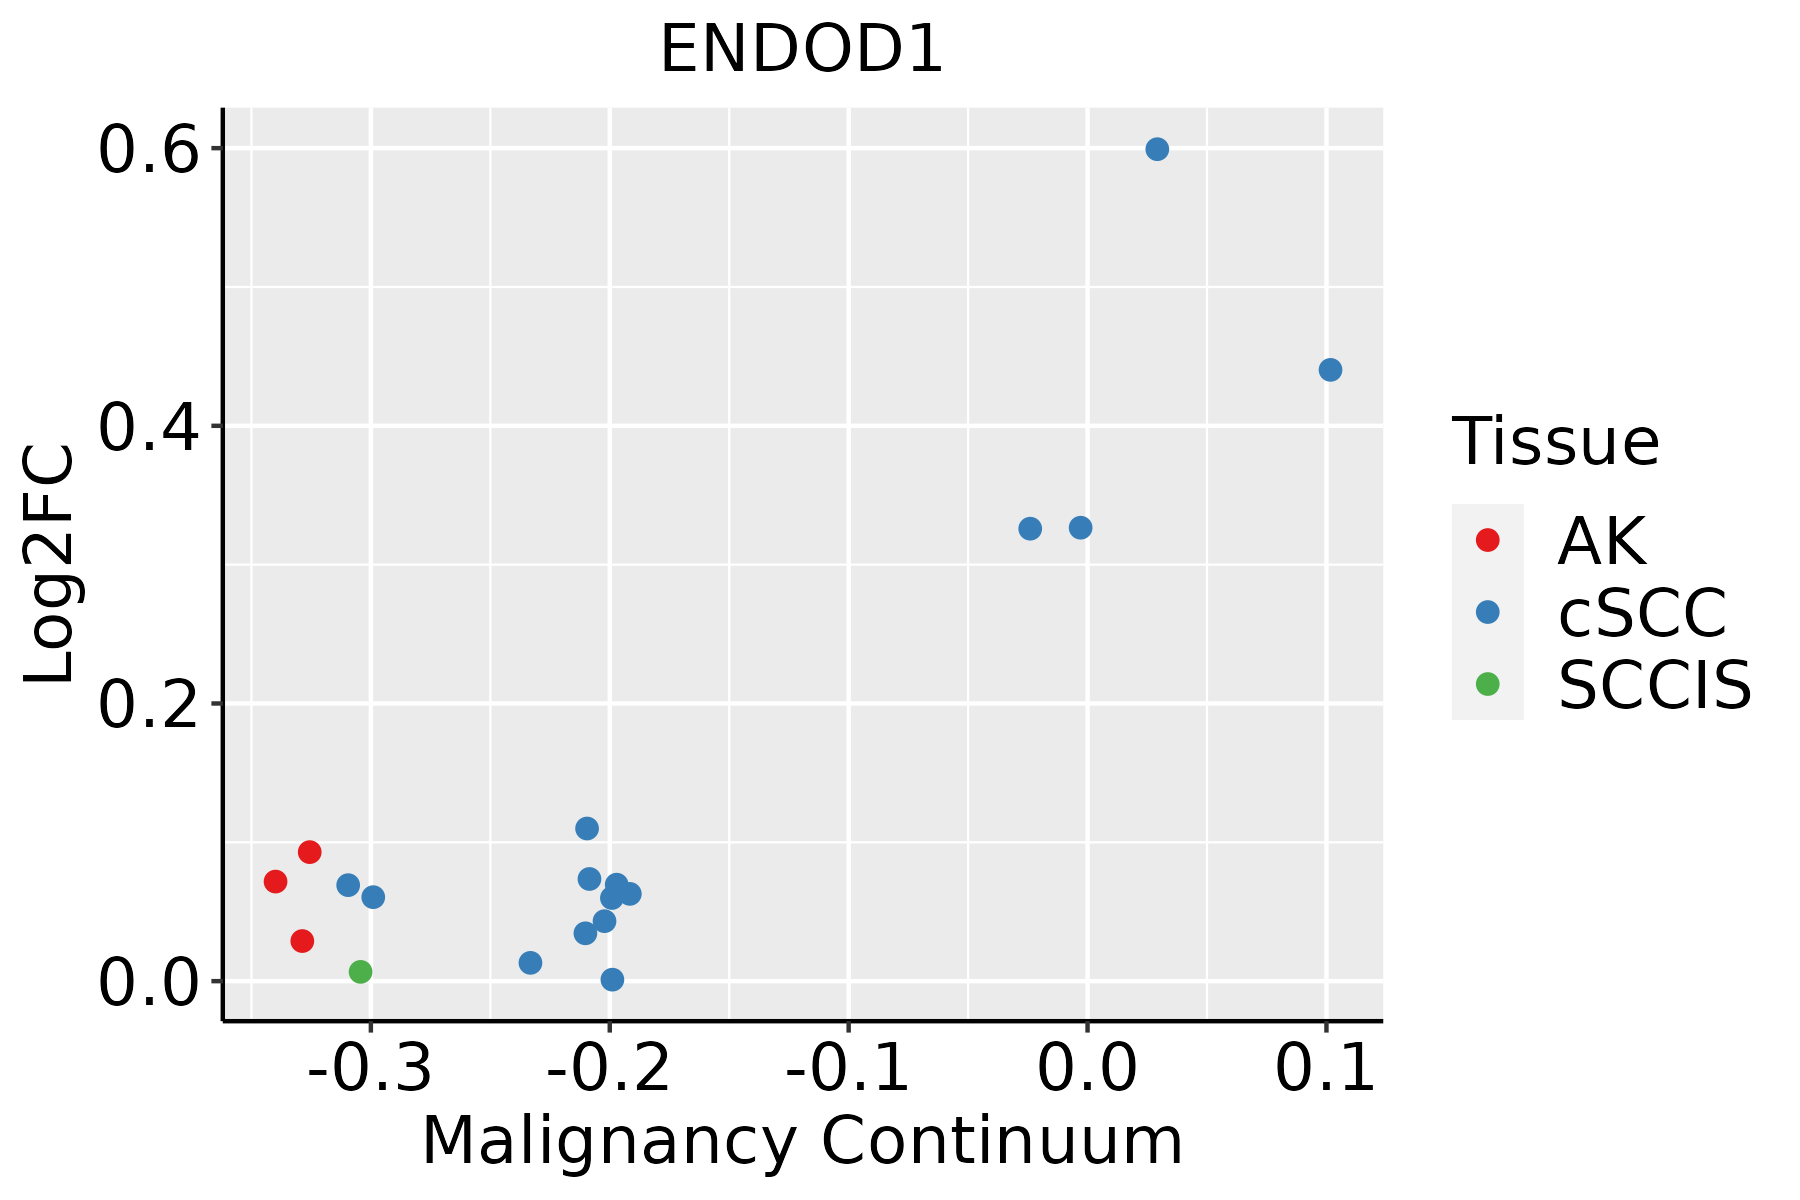 | AK: Actinic keratosis |
| cSCC: Cutaneous squamous cell carcinoma | ||
| SCCIS:squamous cell carcinoma in situ | ||
| Thyroid |  | ATC: Anaplastic thyroid cancer |
| HT: Hashimoto's thyroiditis | ||
| PTC: Papillary thyroid cancer |
| ∗log2FC in expression of this searched gene in stem-like cells from each diseased tissue sample relative to stem-like cells in normal samples in each tissue plotted against the malignancy continuum. Samples are colored based on if they are from different disease stage. |
Top |
Malignant transformation related pathway analysis |
| Find out the enriched GO biological processes and KEGG pathways involved in transition from healthy to precancer to cancer |
| Tissue | Disease Stage | Enriched GO biological Processes |
| Colorectum | AD |  |
| Colorectum | SER |  |
| Colorectum | MSS |  |
| Colorectum | MSI-H |  |
| Colorectum | FAP |  |
| ∗Top 15 enriched GO BP terms are showed in the bar plot of each disease state in each tissue. Each row represents a significant GO biological process which is colored according to the -log10(p.adjust). |
| Page: 1 2 3 4 5 6 7 8 9 |
| GO ID | Tissue | Disease Stage | Description | Gene Ratio | Bg Ratio | pvalue | p.adjust | Count |
| GO:00903053 | Esophagus | ESCC | nucleic acid phosphodiester bond hydrolysis | 163/8552 | 261/18723 | 3.07e-08 | 5.73e-07 | 163 |
| GO:00903052 | Oral cavity | OSCC | nucleic acid phosphodiester bond hydrolysis | 142/7305 | 261/18723 | 2.90e-07 | 4.43e-06 | 142 |
| GO:00903051 | Oral cavity | LP | nucleic acid phosphodiester bond hydrolysis | 92/4623 | 261/18723 | 8.07e-05 | 1.04e-03 | 92 |
| GO:00903054 | Skin | cSCC | nucleic acid phosphodiester bond hydrolysis | 97/4864 | 261/18723 | 4.08e-05 | 4.34e-04 | 97 |
| GO:00903055 | Thyroid | PTC | nucleic acid phosphodiester bond hydrolysis | 105/5968 | 261/18723 | 2.53e-03 | 1.31e-02 | 105 |
| GO:009030511 | Thyroid | ATC | nucleic acid phosphodiester bond hydrolysis | 107/6293 | 261/18723 | 7.21e-03 | 2.84e-02 | 107 |
| Page: 1 |
| Pathway ID | Tissue | Disease Stage | Description | Gene Ratio | Bg Ratio | pvalue | p.adjust | qvalue | Count |
| Page: 1 |
Top |
Cell-cell communication analysis |
| Identification of potential cell-cell interactions between two cell types and their ligand-receptor pairs for different disease states |
| Ligand | Receptor | LRpair | Pathway | Tissue | Disease Stage |
| Page: 1 |
Top |
Single-cell gene regulatory network inference analysis |
| Find out the significant the regulons (TFs) and the target genes of each regulon across cell types for different disease states |
| TF | Cell Type | Tissue | Disease Stage | Target Gene | RSS | Regulon Activity |
| ∗The dot plots of a searched regulon are shown for all cell subpopulations in each disease state of each tissue based on the regulon specific score inferred using pySCENIC and by calculating the average expression. |
| Page: 1 |
Top |
Somatic mutation of malignant transformation related genes |
| Annotation of somatic variants for genes involved in malignant transformation |
| Hugo Symbol | Variant Class | Variant Classification | dbSNP RS | HGVSc | HGVSp | HGVSp Short | SWISSPROT | BIOTYPE | SIFT | PolyPhen | Tumor Sample Barcode | Tissue | Histology | Sex | Age | Stage | Therapy Types | Drugs | Outcome |
| ENDOD1 | SNV | Missense_Mutation | novel | c.1188N>A | p.Ser396Arg | p.S396R | O94919 | protein_coding | deleterious(0) | possibly_damaging(0.795) | TCGA-A8-A085-01 | Breast | breast invasive carcinoma | Male | <65 | I/II | Hormone Therapy | tamoxiphen | SD |
| ENDOD1 | SNV | Missense_Mutation | novel | c.184N>A | p.Ala62Thr | p.A62T | O94919 | protein_coding | tolerated(0.5) | benign(0.138) | TCGA-LD-A9QF-01 | Breast | breast invasive carcinoma | Female | >=65 | I/II | Chemotherapy | taxol | SD |
| ENDOD1 | insertion | In_Frame_Ins | novel | c.914_915insGGGGACTTCTCCAGAGTCTGGGCAGGATGA | p.Leu305_Ser306insGlyThrSerProGluSerGlyGlnAspAsp | p.L305_S306insGTSPESGQDD | O94919 | protein_coding | TCGA-A2-A04Y-01 | Breast | breast invasive carcinoma | Female | <65 | I/II | Chemotherapy | cytoxan | SD | ||
| ENDOD1 | insertion | Frame_Shift_Ins | novel | c.1223_1224insGG | p.Ile409AlafsTer13 | p.I409Afs*13 | O94919 | protein_coding | TCGA-B6-A0I5-01 | Breast | breast invasive carcinoma | Female | <65 | I/II | Unknown | Unknown | SD | ||
| ENDOD1 | insertion | Nonsense_Mutation | novel | c.1225_1226insGTCCCTGAGTTTGTTTGGCTGGCAGCC | p.Ile409delinsSerProTerValCysLeuAlaGlySerLeu | p.I409delinsSP*VCLAGSL | O94919 | protein_coding | TCGA-B6-A0I5-01 | Breast | breast invasive carcinoma | Female | <65 | I/II | Unknown | Unknown | SD | ||
| ENDOD1 | SNV | Missense_Mutation | novel | c.478N>G | p.Leu160Val | p.L160V | O94919 | protein_coding | deleterious(0) | probably_damaging(0.998) | TCGA-C5-A1ME-01 | Cervix | cervical & endocervical cancer | Female | <65 | I/II | Unknown | Unknown | SD |
| ENDOD1 | SNV | Missense_Mutation | c.1152N>G | p.Ile384Met | p.I384M | O94919 | protein_coding | tolerated(0.18) | benign(0.1) | TCGA-EK-A3GK-01 | Cervix | cervical & endocervical cancer | Female | <65 | I/II | Unknown | Unknown | SD | |
| ENDOD1 | SNV | Missense_Mutation | novel | c.1055C>T | p.Ala352Val | p.A352V | O94919 | protein_coding | tolerated(0.24) | benign(0.107) | TCGA-VS-A9V1-01 | Cervix | cervical & endocervical cancer | Female | <65 | I/II | Chemotherapy | cisplatin | PD |
| ENDOD1 | SNV | Missense_Mutation | novel | c.1385N>T | p.Thr462Ile | p.T462I | O94919 | protein_coding | tolerated(0.15) | benign(0.005) | TCGA-AA-3950-01 | Colorectum | colon adenocarcinoma | Female | >=65 | I/II | Unknown | Unknown | SD |
| ENDOD1 | SNV | Missense_Mutation | novel | c.841N>C | p.Lys281Gln | p.K281Q | O94919 | protein_coding | tolerated(0.15) | probably_damaging(0.939) | TCGA-AA-3984-01 | Colorectum | colon adenocarcinoma | Female | <65 | I/II | Unknown | Unknown | SD |
| Page: 1 2 3 4 5 |
Top |
Related drugs of malignant transformation related genes |
| Identification of chemicals and drugs interact with genes involved in malignant transfromation |
| (DGIdb 4.0) |
| Entrez ID | Symbol | Category | Interaction Types | Drug Claim Name | Drug Name | PMIDs |
| Page: 1 |

Copyright 2023-Present -The University of Texas Health Science Center at Houston |