
|
|||||
|
 | |
| |
| |
| |
| |
| |
|
Gene: EIF4EBP3 |
Gene summary for EIF4EBP3 |
| Gene information | Species | Human | Gene symbol | EIF4EBP3 | Gene ID | 8637 |
| Gene name | eukaryotic translation initiation factor 4E binding protein 3 | |
| Gene Alias | 4E-BP3 | |
| Cytomap | 5q31.3 | |
| Gene Type | protein-coding | GO ID | GO:0006412 | UniProtAcc | O60516 |
Top |
Malignant transformation analysis |
| Identification of the aberrant gene expression in precancerous and cancerous lesions by comparing the gene expression of stem-like cells in diseased tissues with normal stem cells |
| Entrez ID | Symbol | Replicates | Species | Organ | Tissue | Adj P-value | Log2FC | Malignancy |
| 8637 | EIF4EBP3 | P57T-E | Human | Esophagus | ESCC | 8.93e-30 | 7.20e-01 | 0.0926 |
| 8637 | EIF4EBP3 | P62T-E | Human | Esophagus | ESCC | 2.84e-41 | 6.22e-01 | 0.1302 |
| 8637 | EIF4EBP3 | P65T-E | Human | Esophagus | ESCC | 4.01e-21 | 4.04e-01 | 0.0978 |
| 8637 | EIF4EBP3 | P74T-E | Human | Esophagus | ESCC | 8.34e-46 | 1.03e+00 | 0.1479 |
| 8637 | EIF4EBP3 | P75T-E | Human | Esophagus | ESCC | 1.24e-22 | 5.27e-01 | 0.1125 |
| 8637 | EIF4EBP3 | P76T-E | Human | Esophagus | ESCC | 5.20e-16 | 3.38e-01 | 0.1207 |
| 8637 | EIF4EBP3 | P79T-E | Human | Esophagus | ESCC | 2.59e-03 | 2.19e-01 | 0.1154 |
| 8637 | EIF4EBP3 | P80T-E | Human | Esophagus | ESCC | 1.85e-57 | 1.43e+00 | 0.155 |
| 8637 | EIF4EBP3 | P82T-E | Human | Esophagus | ESCC | 9.00e-20 | 8.69e-01 | 0.1072 |
| 8637 | EIF4EBP3 | P84T-E | Human | Esophagus | ESCC | 2.04e-06 | 3.80e-01 | 0.0933 |
| 8637 | EIF4EBP3 | P89T-E | Human | Esophagus | ESCC | 2.44e-18 | 8.59e-01 | 0.1752 |
| 8637 | EIF4EBP3 | P94T-E | Human | Esophagus | ESCC | 6.05e-03 | 4.32e-01 | 0.0879 |
| 8637 | EIF4EBP3 | P104T-E | Human | Esophagus | ESCC | 9.44e-05 | 2.29e-01 | 0.0931 |
| 8637 | EIF4EBP3 | P107T-E | Human | Esophagus | ESCC | 4.39e-33 | 6.31e-01 | 0.171 |
| 8637 | EIF4EBP3 | P126T-E | Human | Esophagus | ESCC | 4.04e-08 | 7.37e-01 | 0.1125 |
| 8637 | EIF4EBP3 | P127T-E | Human | Esophagus | ESCC | 2.06e-46 | 7.26e-01 | 0.0826 |
| 8637 | EIF4EBP3 | P128T-E | Human | Esophagus | ESCC | 2.93e-68 | 1.76e+00 | 0.1241 |
| 8637 | EIF4EBP3 | P130T-E | Human | Esophagus | ESCC | 1.38e-54 | 1.03e+00 | 0.1676 |
| 8637 | EIF4EBP3 | HCC1_Meng | Human | Liver | HCC | 3.89e-24 | 3.95e-02 | 0.0246 |
| 8637 | EIF4EBP3 | S014 | Human | Liver | HCC | 2.55e-15 | 6.21e-01 | 0.2254 |
| Page: 1 2 3 4 |
| Tissue | Expression Dynamics | Abbreviation |
| Esophagus | 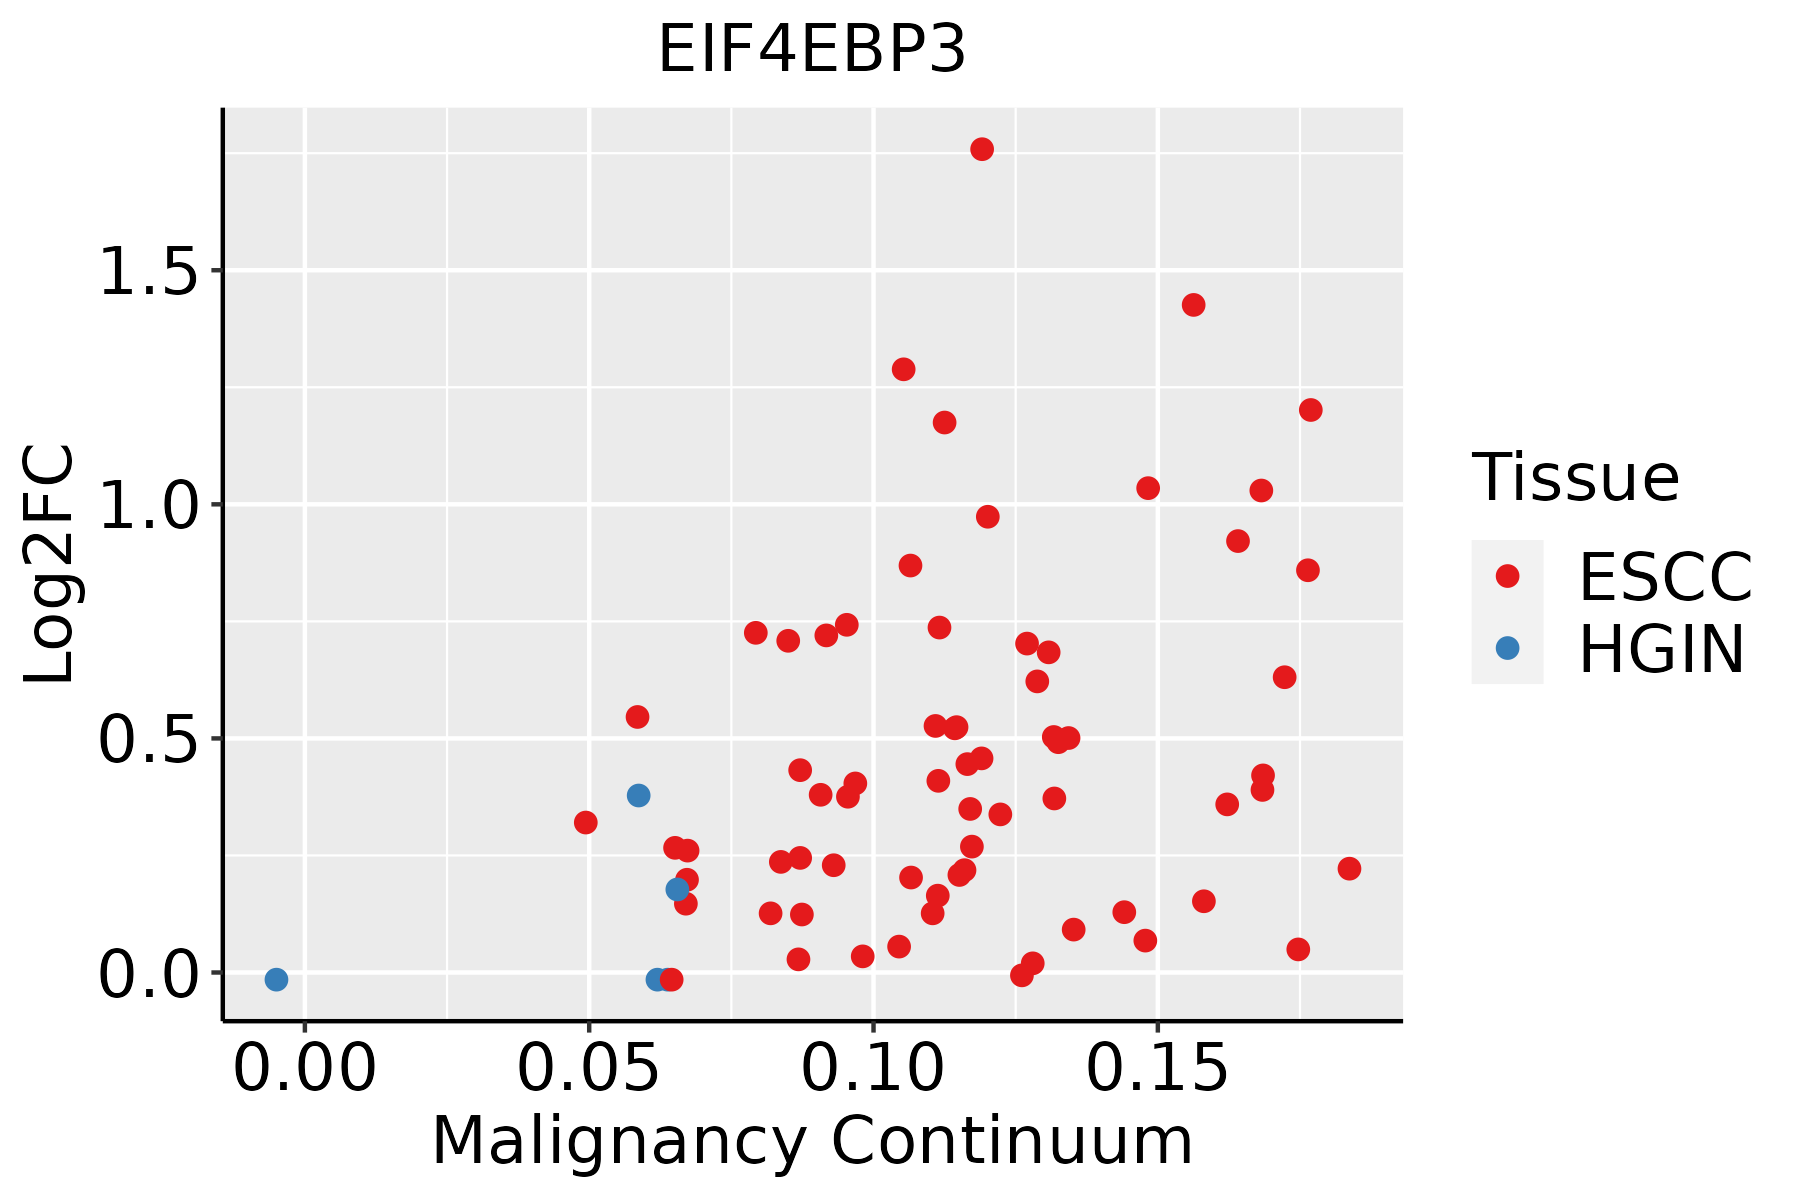 | ESCC: Esophageal squamous cell carcinoma |
| HGIN: High-grade intraepithelial neoplasias | ||
| LGIN: Low-grade intraepithelial neoplasias | ||
| Liver |  | HCC: Hepatocellular carcinoma |
| NAFLD: Non-alcoholic fatty liver disease |
| ∗log2FC in expression of this searched gene in stem-like cells from each diseased tissue sample relative to stem-like cells in normal samples in each tissue plotted against the malignancy continuum. Samples are colored based on if they are from different disease stage. |
Top |
Malignant transformation related pathway analysis |
| Find out the enriched GO biological processes and KEGG pathways involved in transition from healthy to precancer to cancer |
| Tissue | Disease Stage | Enriched GO biological Processes |
| Colorectum | AD |  |
| Colorectum | SER |  |
| Colorectum | MSS |  |
| Colorectum | MSI-H |  |
| Colorectum | FAP |  |
| ∗Top 15 enriched GO BP terms are showed in the bar plot of each disease state in each tissue. Each row represents a significant GO biological process which is colored according to the -log10(p.adjust). |
| Page: 1 2 3 4 5 6 7 8 9 |
| GO ID | Tissue | Disease Stage | Description | Gene Ratio | Bg Ratio | pvalue | p.adjust | Count |
| GO:000641727 | Esophagus | HGIN | regulation of translation | 139/2587 | 468/18723 | 1.46e-19 | 7.98e-17 | 139 |
| GO:000641320 | Esophagus | HGIN | translational initiation | 55/2587 | 118/18723 | 7.33e-18 | 2.31e-15 | 55 |
| GO:000644610 | Esophagus | HGIN | regulation of translational initiation | 34/2587 | 79/18723 | 2.09e-10 | 1.97e-08 | 34 |
| GO:00342496 | Esophagus | HGIN | negative regulation of cellular amide metabolic process | 66/2587 | 273/18723 | 2.74e-06 | 9.60e-05 | 66 |
| GO:00171486 | Esophagus | HGIN | negative regulation of translation | 59/2587 | 245/18723 | 1.03e-05 | 2.96e-04 | 59 |
| GO:00459475 | Esophagus | HGIN | negative regulation of translational initiation | 10/2587 | 19/18723 | 6.97e-05 | 1.59e-03 | 10 |
| GO:0006413110 | Esophagus | ESCC | translational initiation | 100/8552 | 118/18723 | 1.16e-18 | 1.25e-16 | 100 |
| GO:0006417111 | Esophagus | ESCC | regulation of translation | 304/8552 | 468/18723 | 1.53e-17 | 1.33e-15 | 304 |
| GO:000644617 | Esophagus | ESCC | regulation of translational initiation | 65/8552 | 79/18723 | 2.04e-11 | 7.07e-10 | 65 |
| GO:004594714 | Esophagus | ESCC | negative regulation of translational initiation | 16/8552 | 19/18723 | 6.45e-04 | 3.43e-03 | 16 |
| GO:003424914 | Esophagus | ESCC | negative regulation of cellular amide metabolic process | 144/8552 | 273/18723 | 1.08e-02 | 3.67e-02 | 144 |
| GO:000641722 | Liver | HCC | regulation of translation | 287/7958 | 468/18723 | 8.79e-17 | 8.08e-15 | 287 |
| GO:000641322 | Liver | HCC | translational initiation | 94/7958 | 118/18723 | 1.39e-16 | 1.24e-14 | 94 |
| GO:000644622 | Liver | HCC | regulation of translational initiation | 62/7958 | 79/18723 | 6.85e-11 | 2.48e-09 | 62 |
| GO:003424921 | Liver | HCC | negative regulation of cellular amide metabolic process | 144/7958 | 273/18723 | 3.80e-04 | 2.61e-03 | 144 |
| GO:001714821 | Liver | HCC | negative regulation of translation | 129/7958 | 245/18723 | 8.14e-04 | 4.87e-03 | 129 |
| GO:004594711 | Liver | HCC | negative regulation of translational initiation | 15/7958 | 19/18723 | 1.36e-03 | 7.28e-03 | 15 |
| Page: 1 |
| Pathway ID | Tissue | Disease Stage | Description | Gene Ratio | Bg Ratio | pvalue | p.adjust | qvalue | Count |
| Page: 1 |
Top |
Cell-cell communication analysis |
| Identification of potential cell-cell interactions between two cell types and their ligand-receptor pairs for different disease states |
| Ligand | Receptor | LRpair | Pathway | Tissue | Disease Stage |
| Page: 1 |
Top |
Single-cell gene regulatory network inference analysis |
| Find out the significant the regulons (TFs) and the target genes of each regulon across cell types for different disease states |
| TF | Cell Type | Tissue | Disease Stage | Target Gene | RSS | Regulon Activity |
| ∗The dot plots of a searched regulon are shown for all cell subpopulations in each disease state of each tissue based on the regulon specific score inferred using pySCENIC and by calculating the average expression. |
| Page: 1 |
Top |
Somatic mutation of malignant transformation related genes |
| Annotation of somatic variants for genes involved in malignant transformation |
| Hugo Symbol | Variant Class | Variant Classification | dbSNP RS | HGVSc | HGVSp | HGVSp Short | SWISSPROT | BIOTYPE | SIFT | PolyPhen | Tumor Sample Barcode | Tissue | Histology | Sex | Age | Stage | Therapy Types | Drugs | Outcome |
| EIF4EBP3 | SNV | Missense_Mutation | novel | c.269T>C | p.Ile90Thr | p.I90T | O60516 | protein_coding | tolerated(0.68) | benign(0.003) | TCGA-2W-A8YY-01 | Cervix | cervical & endocervical cancer | Female | <65 | I/II | Chemotherapy | cisplatin | CR |
| EIF4EBP3 | insertion | In_Frame_Ins | novel | c.235_243dupGAGGAGCTG | p.Glu79_Leu81dup | p.E79_L81dup | O60516 | protein_coding | TCGA-EA-A5ZF-01 | Cervix | cervical & endocervical cancer | Female | <65 | I/II | Unknown | Unknown | PD | ||
| EIF4EBP3 | SNV | Missense_Mutation | c.193N>T | p.Pro65Ser | p.P65S | O60516 | protein_coding | deleterious(0.01) | probably_damaging(0.999) | TCGA-AP-A1DV-01 | Endometrium | uterine corpus endometrioid carcinoma | Female | <65 | I/II | Unknown | Unknown | SD | |
| EIF4EBP3 | SNV | Missense_Mutation | rs368740046 | c.121G>A | p.Asp41Asn | p.D41N | O60516 | protein_coding | deleterious(0) | benign(0.033) | TCGA-BS-A0UF-01 | Endometrium | uterine corpus endometrioid carcinoma | Female | >=65 | I/II | Unknown | Unknown | SD |
| EIF4EBP3 | SNV | Missense_Mutation | novel | c.191T>A | p.Ile64Asn | p.I64N | O60516 | protein_coding | deleterious(0) | possibly_damaging(0.884) | TCGA-DF-A2KU-01 | Endometrium | uterine corpus endometrioid carcinoma | Female | Unknown | I/II | Unknown | Unknown | SD |
| Page: 1 |
Top |
Related drugs of malignant transformation related genes |
| Identification of chemicals and drugs interact with genes involved in malignant transfromation |
| (DGIdb 4.0) |
| Entrez ID | Symbol | Category | Interaction Types | Drug Claim Name | Drug Name | PMIDs |
| Page: 1 |

Copyright 2023-Present -The University of Texas Health Science Center at Houston |