Schematic overview of the cellular and molecular mechanisms involved in the cancer progression, including the proposed cellular and molecular mechanisms in cancer cells trajectory. AT1: alveolar type 1 cells; AT2: alveolar type 2 cells; AAH: atypical adenomatous hyperplasia; AIS: adenocarcinoma in situ; MIA: minimally invasive adenocarcinoma; IA: invasive adenocarcinoma; EMT: epithelial-mesenchymal transition

Home

Download

Statistics

Help

Contact

Center for Computational Systems Medicine
leaf

Gene summary

leaf

Malignant transformation analysis

leaf

Malignant transformation related pathway analysis

leaf

Cell-cell communication analysis

leaf

Single-cell gene regulatory network inference analysis

leaf

Somatic mutation of malignant transformation related genes

leaf

Related drugs of malignant transformation related genes

Gene: EIF3A

Gene summary for EIF3A

check button Gene summary.

Gene informationSpeciesHuman
Gene symbol

EIF3A

Gene ID

8661

Gene nameeukaryotic translation initiation factor 3 subunit A
Gene AliasEIF3
Cytomap10q26.11
Gene Typeprotein-coding
GO ID

GO:0000165

UniProtAcc

Q14152


Top

Malignant transformation analysis

check button Identification of the aberrant gene expression in precancerous and cancerous lesions by comparing the gene expression of stem-like cells in diseased tissues with normal stem cells
check button Malignant transformation involving gene list.
Entrez IDSymbolReplicatesSpeciesOrganTissueAdj P-valueLog2FCMalignancy
8661EIF3AP2T-EHumanEsophagusESCC1.52e-681.62e+000.1177
8661EIF3AP4T-EHumanEsophagusESCC2.12e-431.38e+000.1323
8661EIF3AP5T-EHumanEsophagusESCC1.57e-471.37e+000.1327
8661EIF3AP8T-EHumanEsophagusESCC7.26e-326.91e-010.0889
8661EIF3AP9T-EHumanEsophagusESCC3.85e-207.30e-010.1131
8661EIF3AP10T-EHumanEsophagusESCC1.01e-194.37e-010.116
8661EIF3AP11T-EHumanEsophagusESCC2.47e-181.03e+000.1426
8661EIF3AP12T-EHumanEsophagusESCC1.66e-471.23e+000.1122
8661EIF3AP15T-EHumanEsophagusESCC8.48e-451.51e+000.1149
8661EIF3AP16T-EHumanEsophagusESCC7.01e-701.69e+000.1153
8661EIF3AP17T-EHumanEsophagusESCC1.59e-119.92e-010.1278
8661EIF3AP19T-EHumanEsophagusESCC1.51e-049.60e-010.1662
8661EIF3AP20T-EHumanEsophagusESCC5.01e-257.82e-010.1124
8661EIF3AP21T-EHumanEsophagusESCC1.23e-451.08e+000.1617
8661EIF3AP22T-EHumanEsophagusESCC4.75e-226.13e-010.1236
8661EIF3AP23T-EHumanEsophagusESCC4.17e-491.68e+000.108
8661EIF3AP24T-EHumanEsophagusESCC1.83e-441.26e+000.1287
8661EIF3AP26T-EHumanEsophagusESCC1.26e-611.39e+000.1276
8661EIF3AP27T-EHumanEsophagusESCC4.45e-671.38e+000.1055
8661EIF3AP28T-EHumanEsophagusESCC1.43e-591.50e+000.1149
Page: 1 2 3 4 5 6 7 8 9 10 

check button Transcriptomic changes along malignancy continuum.
TissueExpression DynamicsAbbreviation
Colorectum (GSE201348)The image shows the transcriptomic changes along malignancy continuum.log2FC in expression of this searched gene in stem-like cells from each diseased tissue sample relative to stem-like cells in normal samples in each tissue plotted against the malignancy continuum. Samples are colored based on if they are from different disease stage.FAP: Familial adenomatous polyposis
CRC: Colorectal cancer
Colorectum (HTA11)The image shows the transcriptomic changes along malignancy continuum.log2FC in expression of this searched gene in stem-like cells from each diseased tissue sample relative to stem-like cells in normal samples in each tissue plotted against the malignancy continuum. Samples are colored based on if they are from different disease stage.AD: Adenomas
SER: Sessile serrated lesions
MSI-H: Microsatellite-high colorectal cancer
MSS: Microsatellite stable colorectal cancer
EsophagusThe image shows the transcriptomic changes along malignancy continuum.log2FC in expression of this searched gene in stem-like cells from each diseased tissue sample relative to stem-like cells in normal samples in each tissue plotted against the malignancy continuum. Samples are colored based on if they are from different disease stage.
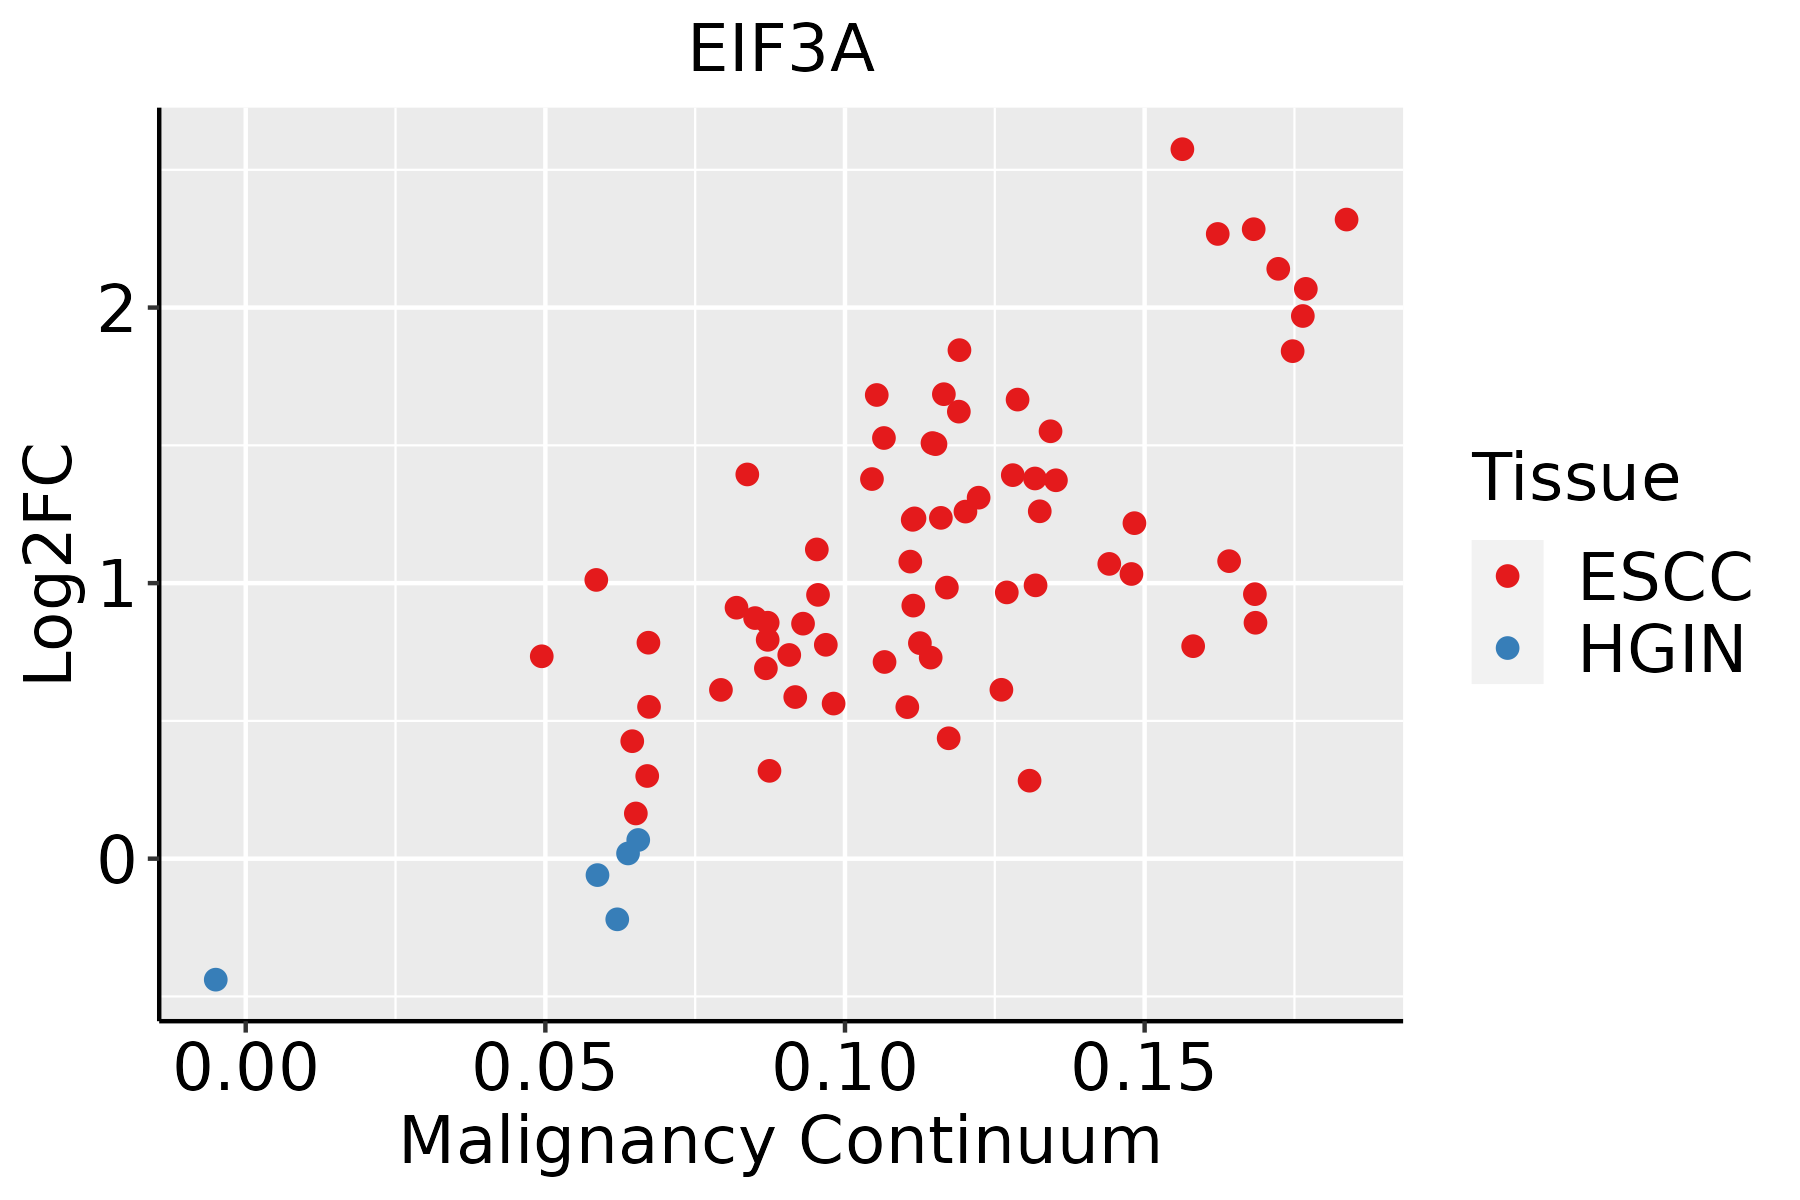
ESCC: Esophageal squamous cell carcinoma
HGIN: High-grade intraepithelial neoplasias
LGIN: Low-grade intraepithelial neoplasias
LiverThe image shows the transcriptomic changes along malignancy continuum.log2FC in expression of this searched gene in stem-like cells from each diseased tissue sample relative to stem-like cells in normal samples in each tissue plotted against the malignancy continuum. Samples are colored based on if they are from different disease stage.
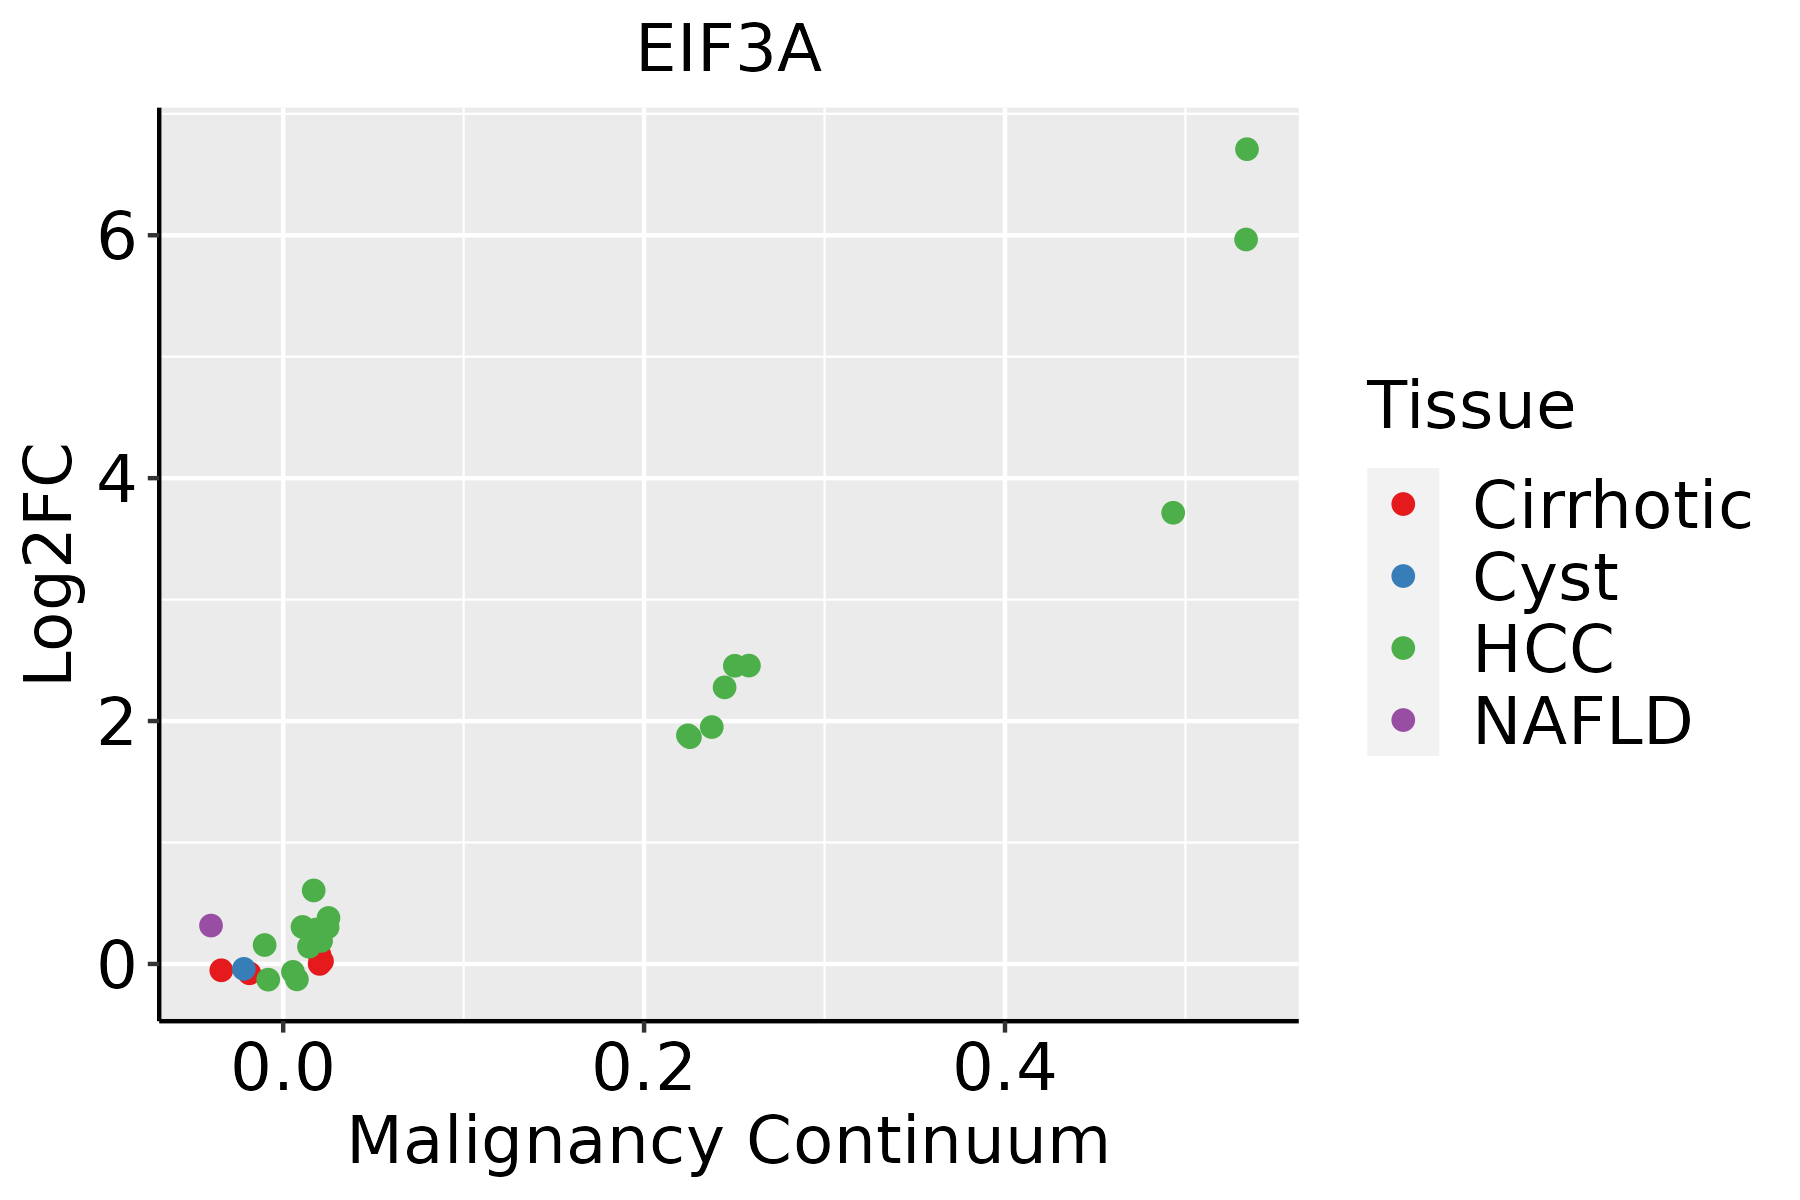
HCC: Hepatocellular carcinoma
NAFLD: Non-alcoholic fatty liver disease
LungThe image shows the transcriptomic changes along malignancy continuum.log2FC in expression of this searched gene in stem-like cells from each diseased tissue sample relative to stem-like cells in normal samples in each tissue plotted against the malignancy continuum. Samples are colored based on if they are from different disease stage.
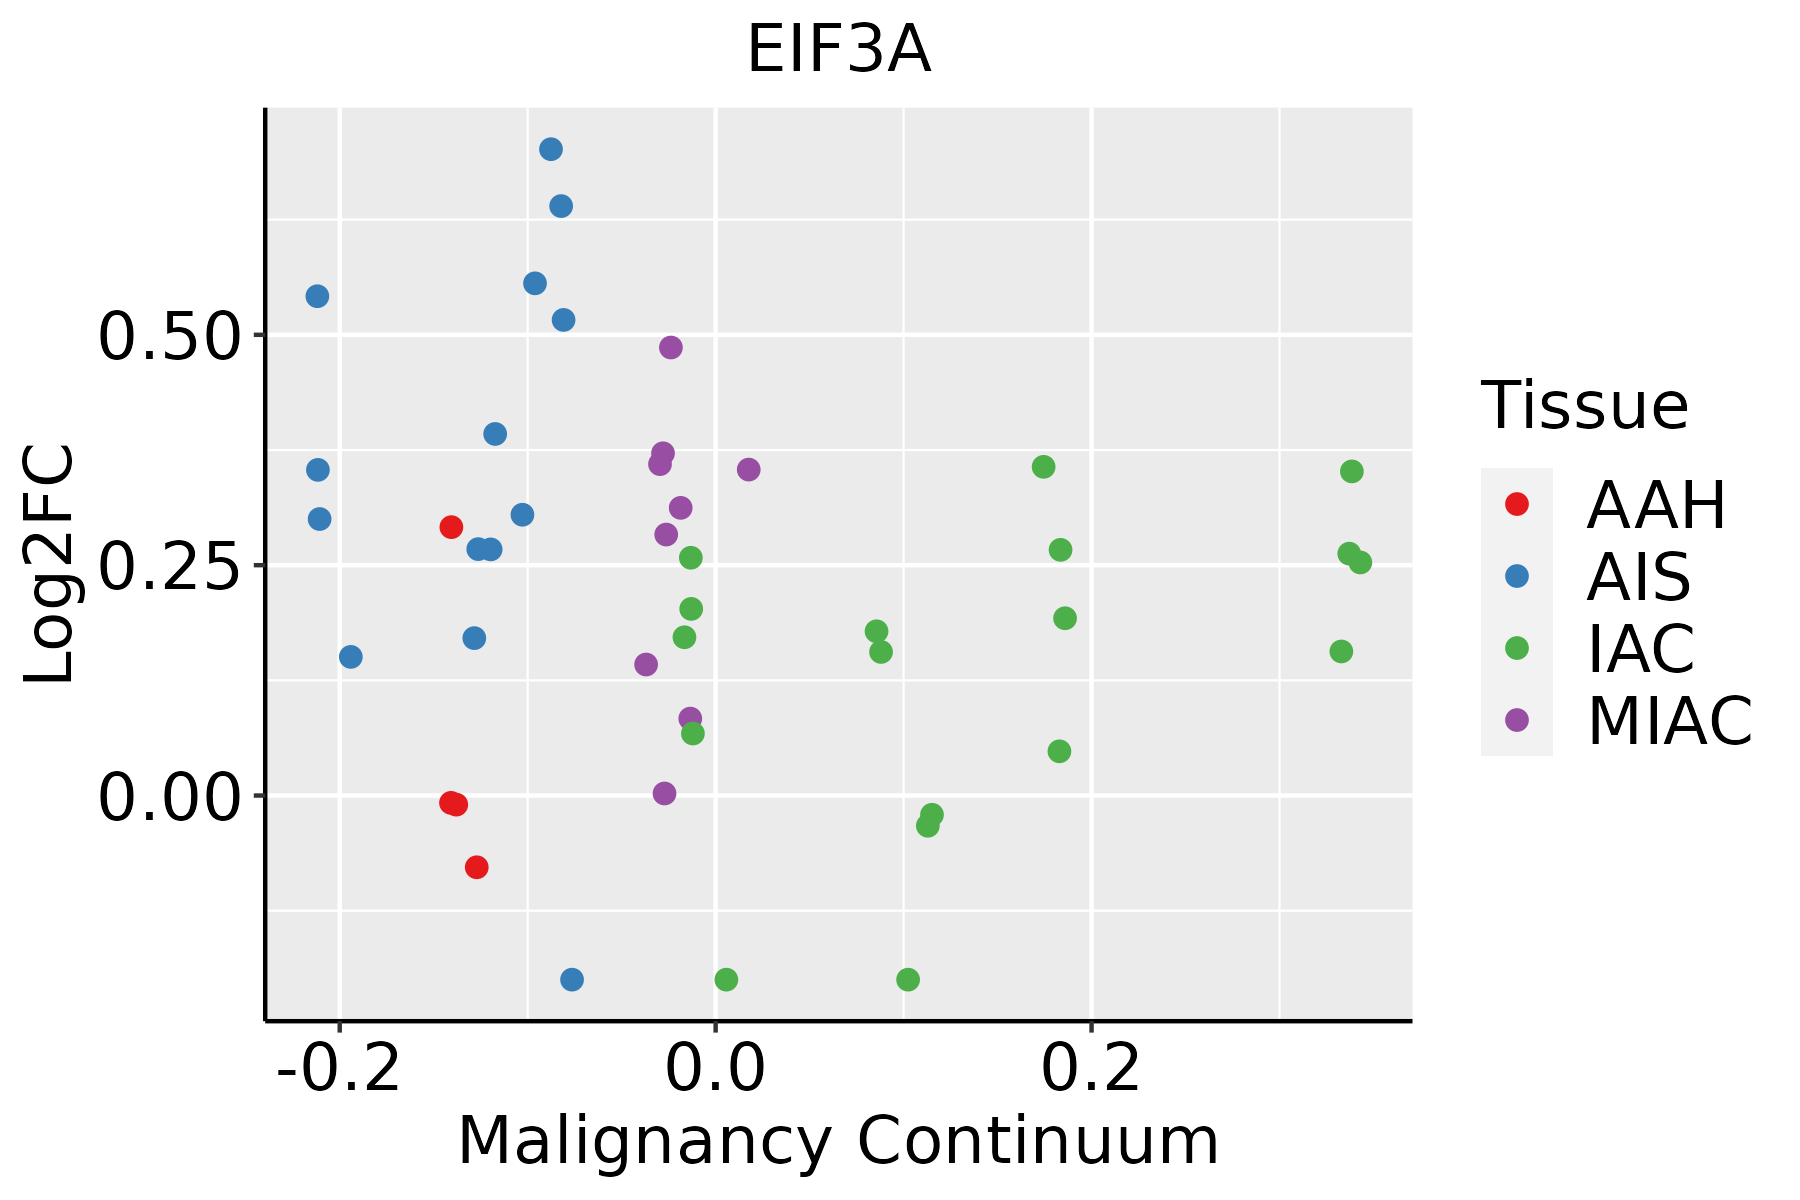
AAH: Atypical adenomatous hyperplasia
AIS: Adenocarcinoma in situ
IAC: Invasive lung adenocarcinoma
MIA: Minimally invasive adenocarcinoma
Oral CavityThe image shows the transcriptomic changes along malignancy continuum.log2FC in expression of this searched gene in stem-like cells from each diseased tissue sample relative to stem-like cells in normal samples in each tissue plotted against the malignancy continuum. Samples are colored based on if they are from different disease stage.
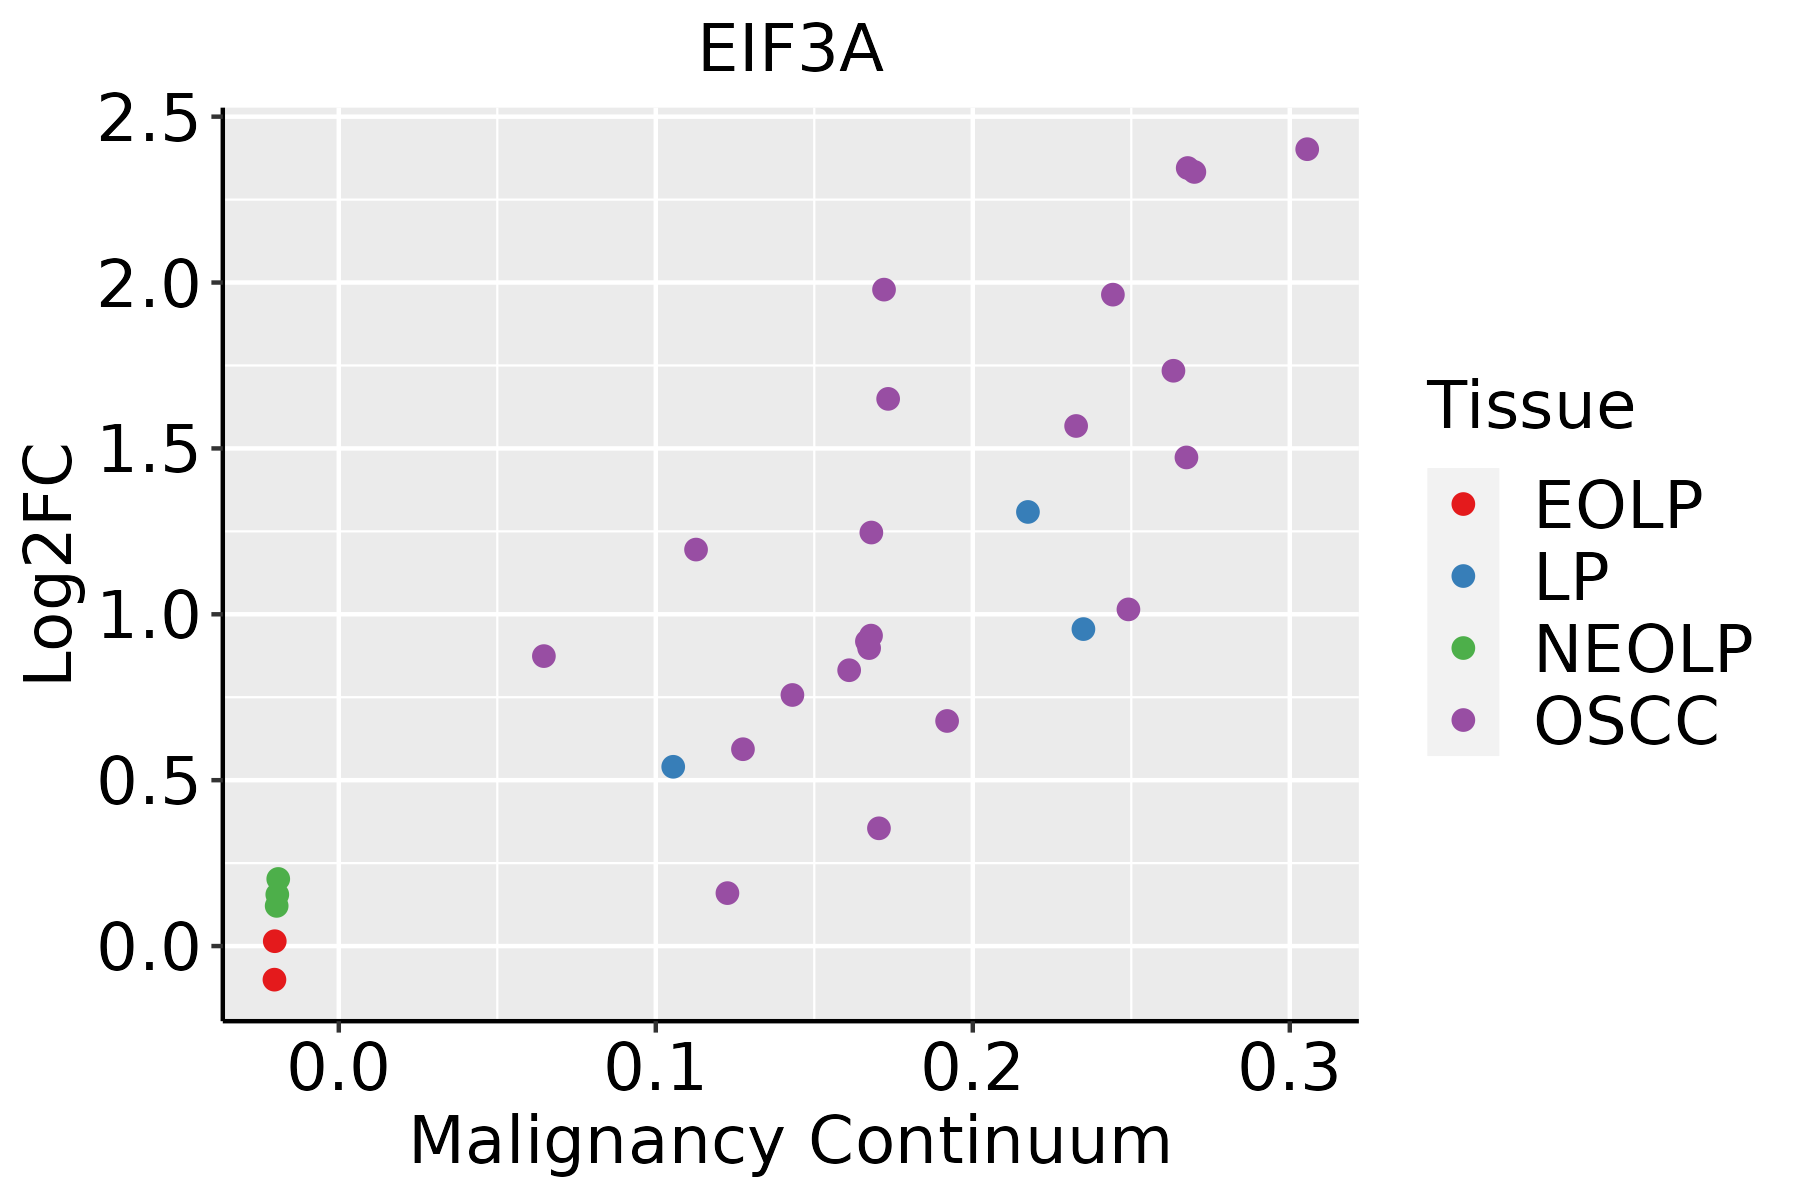
EOLP: Erosive Oral lichen planus
LP: leukoplakia
NEOLP: Non-erosive oral lichen planus
OSCC: Oral squamous cell carcinoma
ProstateThe image shows the transcriptomic changes along malignancy continuum.log2FC in expression of this searched gene in stem-like cells from each diseased tissue sample relative to stem-like cells in normal samples in each tissue plotted against the malignancy continuum. Samples are colored based on if they are from different disease stage.
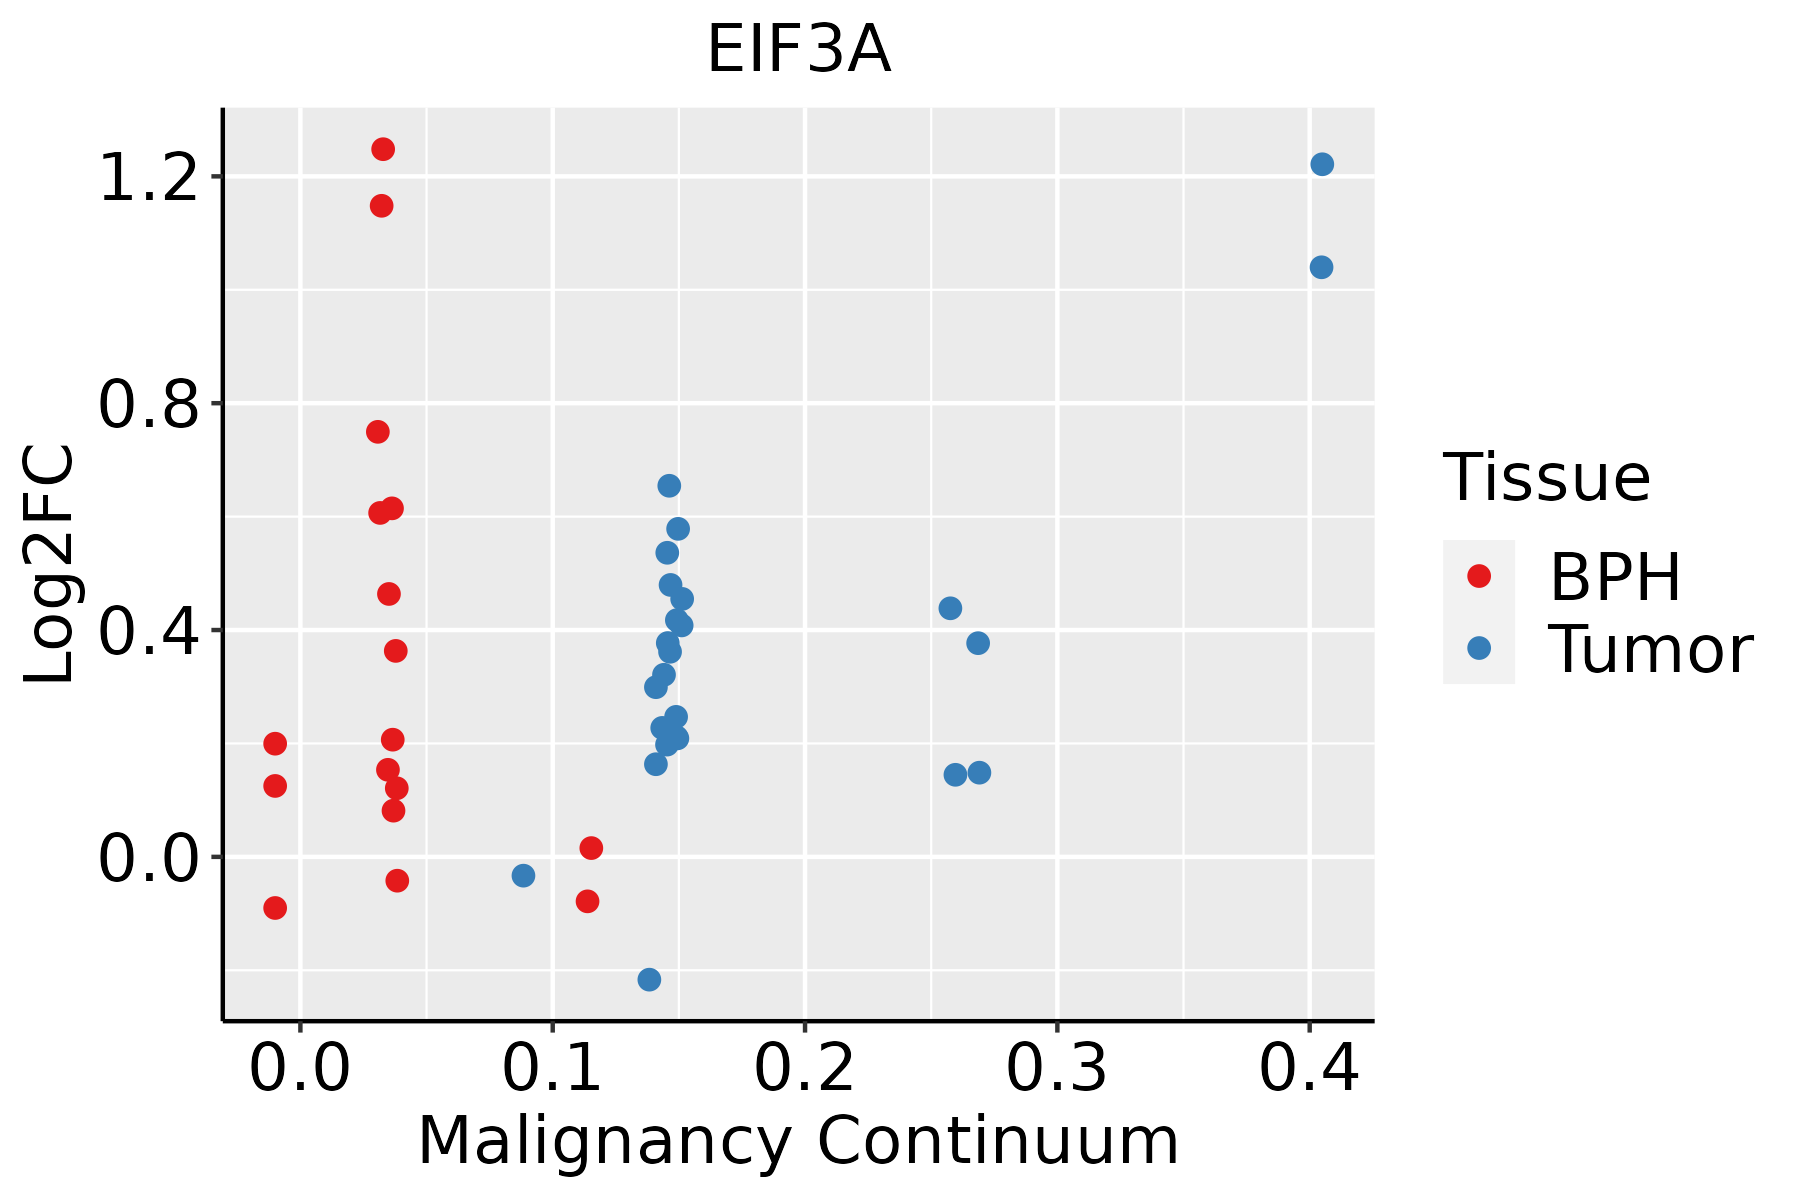
BPH: Benign Prostatic Hyperplasia
SkinThe image shows the transcriptomic changes along malignancy continuum.log2FC in expression of this searched gene in stem-like cells from each diseased tissue sample relative to stem-like cells in normal samples in each tissue plotted against the malignancy continuum. Samples are colored based on if they are from different disease stage.AK: Actinic keratosis
cSCC: Cutaneous squamous cell carcinoma
SCCIS:squamous cell carcinoma in situ
ThyroidThe image shows the transcriptomic changes along malignancy continuum.log2FC in expression of this searched gene in stem-like cells from each diseased tissue sample relative to stem-like cells in normal samples in each tissue plotted against the malignancy continuum. Samples are colored based on if they are from different disease stage.ATC: Anaplastic thyroid cancer
HT: Hashimoto's thyroiditis
PTC: Papillary thyroid cancer
∗log2FC in expression of this searched gene in stem-like cells from each diseased tissue sample relative to stem-like cells in normal samples in each tissue plotted against the malignancy continuum. Samples are colored based on if they are from different disease stage.

Top

Malignant transformation related pathway analysis

check buttonFind out the enriched GO biological processes and KEGG pathways involved in transition from healthy to precancer to cancer
check button Figure of enriched GO biological processes.
TissueDisease StageEnriched GO biological Processes
ColorectumADGO analysis - Figure of enriched GO biological processes: Top 15 enriched GO BP terms are showed in the bar plot of each disease state in each tissue. Each row represents a significant GO biological process which is colored according to the -log10(p.adjust).
ColorectumSERGO analysis - Figure of enriched GO biological processes: Top 15 enriched GO BP terms are showed in the bar plot of each disease state in each tissue. Each row represents a significant GO biological process which is colored according to the -log10(p.adjust).
ColorectumMSSGO analysis - Figure of enriched GO biological processes: Top 15 enriched GO BP terms are showed in the bar plot of each disease state in each tissue. Each row represents a significant GO biological process which is colored according to the -log10(p.adjust).
ColorectumMSI-HGO analysis - Figure of enriched GO biological processes: Top 15 enriched GO BP terms are showed in the bar plot of each disease state in each tissue. Each row represents a significant GO biological process which is colored according to the -log10(p.adjust).
ColorectumFAPGO analysis - Figure of enriched GO biological processes: Top 15 enriched GO BP terms are showed in the bar plot of each disease state in each tissue. Each row represents a significant GO biological process which is colored according to the -log10(p.adjust).
∗Top 15 enriched GO BP terms are showed in the bar plot of each disease state in each tissue. Each row represents a significant GO biological process which is colored according to the -log10(p.adjust).
Page: 1 2 3 4 5 6 7 8 9 

check button Enriched GO biological processes.
GO IDTissueDisease StageDescriptionGene RatioBg Ratiopvaluep.adjustCount
GO:0002181ColorectumADcytoplasmic translation109/3918148/187233.40e-432.13e-39109
GO:0016032ColorectumADviral process168/3918415/187234.67e-203.66e-17168
GO:0022618ColorectumADribonucleoprotein complex assembly92/3918220/187231.49e-122.60e-1092
GO:0071826ColorectumADribonucleoprotein complex subunit organization94/3918227/187231.70e-122.87e-1094
GO:0022613ColorectumADribonucleoprotein complex biogenesis151/3918463/187231.96e-091.39e-07151
GO:0019080ColorectumADviral gene expression42/391894/187231.90e-078.02e-0642
GO:0002183ColorectumADcytoplasmic translational initiation21/391834/187232.73e-071.09e-0521
GO:0001732ColorectumADformation of cytoplasmic translation initiation complex13/391816/187234.27e-071.64e-0513
GO:0006413ColorectumADtranslational initiation45/3918118/187231.35e-052.92e-0445
GO:0075522ColorectumADIRES-dependent viral translational initiation8/391811/187233.26e-043.85e-038
GO:0019081ColorectumADviral translation10/391816/187233.64e-044.22e-0310
GO:0043409ColorectumADnegative regulation of MAPK cascade57/3918180/187234.61e-045.14e-0357
GO:00021812ColorectumMSScytoplasmic translation108/3467148/187231.78e-471.11e-43108
GO:00160322ColorectumMSSviral process157/3467415/187237.94e-216.19e-18157
GO:00718262ColorectumMSSribonucleoprotein complex subunit organization90/3467227/187236.88e-141.78e-1190
GO:00226182ColorectumMSSribonucleoprotein complex assembly88/3467220/187237.12e-141.78e-1188
GO:00226132ColorectumMSSribonucleoprotein complex biogenesis144/3467463/187232.76e-113.67e-09144
GO:00190802ColorectumMSSviral gene expression41/346794/187231.74e-089.85e-0741
GO:00021832ColorectumMSScytoplasmic translational initiation21/346734/187232.99e-081.67e-0621
GO:00017322ColorectumMSSformation of cytoplasmic translation initiation complex13/346716/187239.42e-084.63e-0613
Page: 1 2 3 4 5 6 7 8 9 10 11 12 13 

check button Enriched KEGG pathways.
Pathway IDTissueDisease StageDescriptionGene RatioBg Ratiopvaluep.adjustqvalueCount
Page: 1 

Top

Cell-cell communication analysis

check buttonIdentification of potential cell-cell interactions between two cell types and their ligand-receptor pairs for different disease states
LigandReceptorLRpairPathwayTissueDisease Stage
Page: 1 

Top

Single-cell gene regulatory network inference analysis

check buttonFind out the significant the regulons (TFs) and the target genes of each regulon across cell types for different disease states
TFCell TypeTissueDisease StageTarget GeneRSSRegulon Activity
∗The dot plots of a searched regulon are shown for all cell subpopulations in each disease state of each tissue based on the regulon specific score inferred using pySCENIC and by calculating the average expression.
Page: 1 

Top

Somatic mutation of malignant transformation related genes

check buttonAnnotation of somatic variants for genes involved in malignant transformation
Hugo SymbolVariant ClassVariant ClassificationdbSNP RSHGVScHGVSpHGVSp ShortSWISSPROTBIOTYPESIFTPolyPhenTumor Sample BarcodeTissueHistologySexAgeStageTherapy TypesDrugsOutcome
EIF3ASNVMissense_Mutationnovelc.2263N>Ap.Glu755Lysp.E755KQ14152protein_codingtolerated(0.27)benign(0.19)TCGA-A2-A0CR-01Breastbreast invasive carcinomaFemale<65I/IIChemotherapyadriamycinCR
EIF3ASNVMissense_Mutationrs771425860c.3593N>Tp.Ser1198Leup.S1198LQ14152protein_codingtolerated_low_confidence(0.07)benign(0.011)TCGA-BH-A0AW-01Breastbreast invasive carcinomaFemale<65I/IIChemotherapycarboplatinSD
EIF3ASNVMissense_Mutationc.4145G>Ap.Arg1382Hisp.R1382HQ14152protein_codingdeleterious_low_confidence(0)probably_damaging(0.991)TCGA-BH-A18L-01Breastbreast invasive carcinomaFemale<65III/IVUnknownUnknownSD
EIF3ASNVMissense_Mutationnovelc.3472N>Gp.Pro1158Alap.P1158AQ14152protein_codingtolerated_low_confidence(0.2)benign(0.138)TCGA-C8-A3M7-01Breastbreast invasive carcinomaFemale<65III/IVUnknownUnknownPD
EIF3ASNVMissense_Mutationnovelc.1749G>Cp.Glu583Aspp.E583DQ14152protein_codingdeleterious(0.01)probably_damaging(0.97)TCGA-D8-A27V-01Breastbreast invasive carcinomaFemale<65I/IIHormone TherapytamoxiphenSD
EIF3ASNVMissense_Mutationnovelc.2906N>Cp.Arg969Thrp.R969TQ14152protein_codingdeleterious(0.02)possibly_damaging(0.628)TCGA-OL-A5RW-01Breastbreast invasive carcinomaFemale<65I/IIChemotherapyadriamycinCR
EIF3AinsertionIn_Frame_Insnovelc.1994_1995insAAATAATGCCGCTCCAGTTCCp.Asp665delinsGluAsnAsnAlaAlaProValProp.D665delinsENNAAPVPQ14152protein_codingTCGA-A2-A0EO-01Breastbreast invasive carcinomaFemale<65I/IIHormone TherapytamoxiphenSD
EIF3AinsertionFrame_Shift_Insnovelc.1617_1618insAAGAp.Ala540LysfsTer21p.A540Kfs*21Q14152protein_codingTCGA-A8-A07R-01Breastbreast invasive carcinomaFemale>=65III/IVAncillaryzoledronicSD
EIF3AinsertionFrame_Shift_Insnovelc.1615_1616insTGGGTGCp.Pro539LeufsTer23p.P539Lfs*23Q14152protein_codingTCGA-A8-A07R-01Breastbreast invasive carcinomaFemale>=65III/IVAncillaryzoledronicSD
EIF3AdeletionFrame_Shift_Delnovelc.2944delGp.Ala982GlnfsTer191p.A982Qfs*191Q14152protein_codingTCGA-D8-A27V-01Breastbreast invasive carcinomaFemale<65I/IIHormone TherapytamoxiphenSD
Page: 1 2 3 4 5 6 7 8 9 10 11 12 13 14 15 

Top

Related drugs of malignant transformation related genes

check buttonIdentification of chemicals and drugs interact with genes involved in malignant transfromation
(DGIdb 4.0)
Entrez IDSymbolCategoryInteraction TypesDrug Claim NameDrug NamePMIDs
8661EIF3ANAPlatinum compounds
8661EIF3ANAcarboplatinCARBOPLATIN23127338
8661EIF3ANAcisplatinCISPLATIN23127338
Page: 1