
|
|||||
|
 | |
| |
| |
| |
| |
| |
|
Gene: EDARADD |
Gene summary for EDARADD |
| Gene information | Species | Human | Gene symbol | EDARADD | Gene ID | 128178 |
| Gene name | EDAR associated death domain | |
| Gene Alias | ECTD11A | |
| Cytomap | 1q42.3-q43 | |
| Gene Type | protein-coding | GO ID | GO:0007154 | UniProtAcc | Q8WWZ3 |
Top |
Malignant transformation analysis |
| Identification of the aberrant gene expression in precancerous and cancerous lesions by comparing the gene expression of stem-like cells in diseased tissues with normal stem cells |
| Entrez ID | Symbol | Replicates | Species | Organ | Tissue | Adj P-value | Log2FC | Malignancy |
| 128178 | EDARADD | P61T-E | Human | Esophagus | ESCC | 8.11e-12 | 2.37e-01 | 0.099 |
| 128178 | EDARADD | P62T-E | Human | Esophagus | ESCC | 1.69e-25 | 3.97e-01 | 0.1302 |
| 128178 | EDARADD | P65T-E | Human | Esophagus | ESCC | 9.55e-23 | 3.76e-01 | 0.0978 |
| 128178 | EDARADD | P74T-E | Human | Esophagus | ESCC | 2.11e-10 | 2.99e-01 | 0.1479 |
| 128178 | EDARADD | P75T-E | Human | Esophagus | ESCC | 1.00e-16 | 3.70e-01 | 0.1125 |
| 128178 | EDARADD | P76T-E | Human | Esophagus | ESCC | 2.37e-02 | 1.09e-01 | 0.1207 |
| 128178 | EDARADD | P79T-E | Human | Esophagus | ESCC | 1.79e-11 | 3.21e-01 | 0.1154 |
| 128178 | EDARADD | P80T-E | Human | Esophagus | ESCC | 6.96e-12 | 3.19e-01 | 0.155 |
| 128178 | EDARADD | P83T-E | Human | Esophagus | ESCC | 1.82e-04 | 1.33e-01 | 0.1738 |
| 128178 | EDARADD | P84T-E | Human | Esophagus | ESCC | 1.34e-04 | 2.44e-01 | 0.0933 |
| 128178 | EDARADD | P89T-E | Human | Esophagus | ESCC | 2.44e-18 | 6.96e-01 | 0.1752 |
| 128178 | EDARADD | P127T-E | Human | Esophagus | ESCC | 8.30e-09 | 1.63e-01 | 0.0826 |
| 128178 | EDARADD | P128T-E | Human | Esophagus | ESCC | 7.89e-06 | 1.81e-01 | 0.1241 |
| 128178 | EDARADD | P130T-E | Human | Esophagus | ESCC | 1.25e-33 | 6.29e-01 | 0.1676 |
| 128178 | EDARADD | C04 | Human | Oral cavity | OSCC | 6.63e-05 | 3.19e-01 | 0.2633 |
| 128178 | EDARADD | C21 | Human | Oral cavity | OSCC | 1.55e-36 | 7.71e-01 | 0.2678 |
| 128178 | EDARADD | C30 | Human | Oral cavity | OSCC | 2.49e-20 | 7.02e-01 | 0.3055 |
| 128178 | EDARADD | C43 | Human | Oral cavity | OSCC | 8.90e-11 | 2.96e-01 | 0.1704 |
| 128178 | EDARADD | C46 | Human | Oral cavity | OSCC | 3.97e-22 | 5.01e-01 | 0.1673 |
| 128178 | EDARADD | C51 | Human | Oral cavity | OSCC | 5.07e-07 | 3.80e-01 | 0.2674 |
| Page: 1 2 3 4 |
| Tissue | Expression Dynamics | Abbreviation |
| Endometrium |  | AEH: Atypical endometrial hyperplasia |
| EEC: Endometrioid Cancer | ||
| Esophagus | 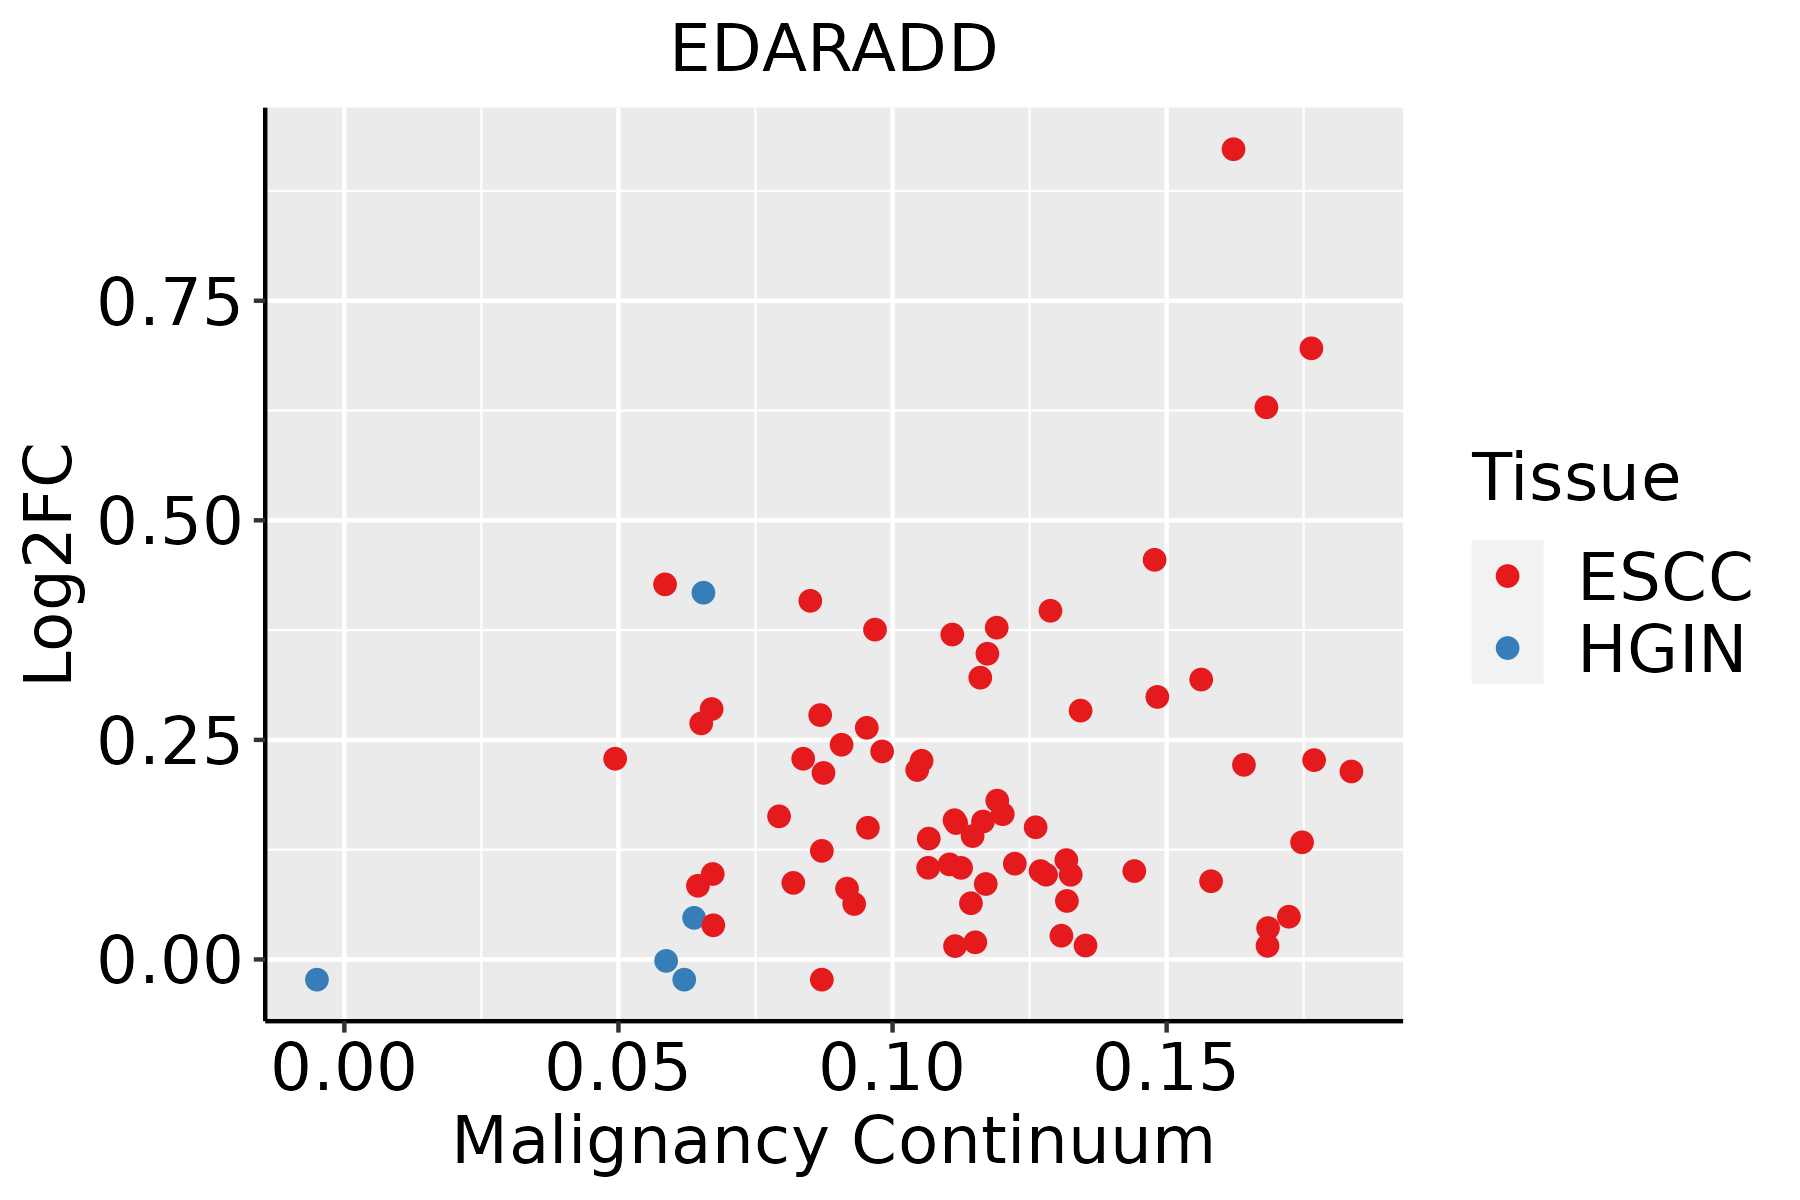 | ESCC: Esophageal squamous cell carcinoma |
| HGIN: High-grade intraepithelial neoplasias | ||
| LGIN: Low-grade intraepithelial neoplasias | ||
| Oral Cavity |  | EOLP: Erosive Oral lichen planus |
| LP: leukoplakia | ||
| NEOLP: Non-erosive oral lichen planus | ||
| OSCC: Oral squamous cell carcinoma |
| ∗log2FC in expression of this searched gene in stem-like cells from each diseased tissue sample relative to stem-like cells in normal samples in each tissue plotted against the malignancy continuum. Samples are colored based on if they are from different disease stage. |
Top |
Malignant transformation related pathway analysis |
| Find out the enriched GO biological processes and KEGG pathways involved in transition from healthy to precancer to cancer |
| Tissue | Disease Stage | Enriched GO biological Processes |
| Colorectum | AD |  |
| Colorectum | SER |  |
| Colorectum | MSS |  |
| Colorectum | MSI-H |  |
| Colorectum | FAP |  |
| ∗Top 15 enriched GO BP terms are showed in the bar plot of each disease state in each tissue. Each row represents a significant GO biological process which is colored according to the -log10(p.adjust). |
| Page: 1 2 3 4 5 6 7 8 9 |
| GO ID | Tissue | Disease Stage | Description | Gene Ratio | Bg Ratio | pvalue | p.adjust | Count |
| GO:190122411 | Endometrium | EEC | positive regulation of NIK/NF-kappaB signaling | 19/2168 | 69/18723 | 2.27e-04 | 2.70e-03 | 19 |
| GO:19012222 | Endometrium | EEC | regulation of NIK/NF-kappaB signaling | 24/2168 | 112/18723 | 2.00e-03 | 1.51e-02 | 24 |
| GO:00380612 | Endometrium | EEC | NIK/NF-kappaB signaling | 27/2168 | 143/18723 | 6.99e-03 | 4.01e-02 | 27 |
| GO:19012247 | Esophagus | HGIN | positive regulation of NIK/NF-kappaB signaling | 18/2587 | 69/18723 | 4.94e-03 | 4.18e-02 | 18 |
| GO:190122414 | Esophagus | ESCC | positive regulation of NIK/NF-kappaB signaling | 44/8552 | 69/18723 | 1.86e-03 | 8.42e-03 | 44 |
| GO:00380615 | Esophagus | ESCC | NIK/NF-kappaB signaling | 81/8552 | 143/18723 | 5.33e-03 | 2.00e-02 | 81 |
| GO:00380614 | Oral cavity | OSCC | NIK/NF-kappaB signaling | 78/7305 | 143/18723 | 1.14e-04 | 8.35e-04 | 78 |
| GO:19012246 | Oral cavity | OSCC | positive regulation of NIK/NF-kappaB signaling | 40/7305 | 69/18723 | 1.08e-03 | 5.56e-03 | 40 |
| GO:19012224 | Oral cavity | OSCC | regulation of NIK/NF-kappaB signaling | 59/7305 | 112/18723 | 2.25e-03 | 1.00e-02 | 59 |
| GO:190122212 | Oral cavity | LP | regulation of NIK/NF-kappaB signaling | 44/4623 | 112/18723 | 4.38e-04 | 4.19e-03 | 44 |
| GO:190122413 | Oral cavity | LP | positive regulation of NIK/NF-kappaB signaling | 29/4623 | 69/18723 | 1.15e-03 | 9.40e-03 | 29 |
| GO:003806112 | Oral cavity | LP | NIK/NF-kappaB signaling | 52/4623 | 143/18723 | 1.20e-03 | 9.66e-03 | 52 |
| Page: 1 |
| Pathway ID | Tissue | Disease Stage | Description | Gene Ratio | Bg Ratio | pvalue | p.adjust | qvalue | Count |
| hsa040645 | Esophagus | ESCC | NF-kappa B signaling pathway | 67/4205 | 104/8465 | 1.62e-03 | 4.89e-03 | 2.50e-03 | 67 |
| hsa0406412 | Esophagus | ESCC | NF-kappa B signaling pathway | 67/4205 | 104/8465 | 1.62e-03 | 4.89e-03 | 2.50e-03 | 67 |
| hsa040644 | Oral cavity | OSCC | NF-kappa B signaling pathway | 67/3704 | 104/8465 | 1.57e-05 | 6.75e-05 | 3.44e-05 | 67 |
| hsa0406411 | Oral cavity | OSCC | NF-kappa B signaling pathway | 67/3704 | 104/8465 | 1.57e-05 | 6.75e-05 | 3.44e-05 | 67 |
| Page: 1 |
Top |
Cell-cell communication analysis |
| Identification of potential cell-cell interactions between two cell types and their ligand-receptor pairs for different disease states |
| Ligand | Receptor | LRpair | Pathway | Tissue | Disease Stage |
| Page: 1 |
Top |
Single-cell gene regulatory network inference analysis |
| Find out the significant the regulons (TFs) and the target genes of each regulon across cell types for different disease states |
| TF | Cell Type | Tissue | Disease Stage | Target Gene | RSS | Regulon Activity |
| ∗The dot plots of a searched regulon are shown for all cell subpopulations in each disease state of each tissue based on the regulon specific score inferred using pySCENIC and by calculating the average expression. |
| Page: 1 |
Top |
Somatic mutation of malignant transformation related genes |
| Annotation of somatic variants for genes involved in malignant transformation |
| Hugo Symbol | Variant Class | Variant Classification | dbSNP RS | HGVSc | HGVSp | HGVSp Short | SWISSPROT | BIOTYPE | SIFT | PolyPhen | Tumor Sample Barcode | Tissue | Histology | Sex | Age | Stage | Therapy Types | Drugs | Outcome |
| EDARADD | SNV | Missense_Mutation | c.575N>G | p.Glu192Gly | p.E192G | Q8WWZ3 | protein_coding | tolerated(0.07) | probably_damaging(0.909) | TCGA-B6-A0RT-01 | Breast | breast invasive carcinoma | Female | <65 | III/IV | Unknown | Unknown | SD | |
| EDARADD | SNV | Missense_Mutation | novel | c.284N>T | p.Ser95Phe | p.S95F | Q8WWZ3 | protein_coding | deleterious(0.03) | benign(0.08) | TCGA-BH-A0HF-01 | Breast | breast invasive carcinoma | Female | >=65 | I/II | Hormone Therapy | arimidex | SD |
| EDARADD | insertion | Frame_Shift_Ins | novel | c.212_213insCTTTTCTGCC | p.Lys71AsnfsTer15 | p.K71Nfs*15 | Q8WWZ3 | protein_coding | TCGA-BH-A0HK-01 | Breast | breast invasive carcinoma | Female | >=65 | I/II | Hormone Therapy | arimidex | SD | ||
| EDARADD | insertion | Nonsense_Mutation | novel | c.213_214insTGAGGGTTTTCCTTAATTAATTAACT | p.Asn72Ter | p.N72* | Q8WWZ3 | protein_coding | TCGA-BH-A0HK-01 | Breast | breast invasive carcinoma | Female | >=65 | I/II | Hormone Therapy | arimidex | SD | ||
| EDARADD | SNV | Missense_Mutation | c.133N>T | p.Pro45Ser | p.P45S | Q8WWZ3 | protein_coding | deleterious(0.01) | possibly_damaging(0.491) | TCGA-Q1-A6DT-01 | Cervix | cervical & endocervical cancer | Female | <65 | I/II | Unknown | Unknown | PD | |
| EDARADD | SNV | Missense_Mutation | c.415T>C | p.Trp139Arg | p.W139R | Q8WWZ3 | protein_coding | deleterious(0) | probably_damaging(1) | TCGA-AA-A00N-01 | Colorectum | colon adenocarcinoma | Male | >=65 | I/II | Unknown | Unknown | PD | |
| EDARADD | SNV | Missense_Mutation | rs763414523 | c.586C>T | p.Arg196Cys | p.R196C | Q8WWZ3 | protein_coding | deleterious(0.01) | possibly_damaging(0.745) | TCGA-AZ-4614-01 | Colorectum | colon adenocarcinoma | Female | >=65 | I/II | Unknown | Unknown | PD |
| EDARADD | SNV | Missense_Mutation | c.178N>C | p.Ile60Leu | p.I60L | Q8WWZ3 | protein_coding | tolerated(0.14) | benign(0) | TCGA-CM-5863-01 | Colorectum | colon adenocarcinoma | Female | <65 | III/IV | Chemotherapy | oxaliplatin | SD | |
| EDARADD | SNV | Missense_Mutation | novel | c.202N>G | p.Ser68Ala | p.S68A | Q8WWZ3 | protein_coding | tolerated(0.13) | benign(0.04) | TCGA-EI-6917-01 | Colorectum | rectum adenocarcinoma | Male | <65 | III/IV | Chemotherapy | 5fluorouracil+oxaciplatina+l-folinian | SD |
| EDARADD | SNV | Missense_Mutation | novel | c.610N>T | p.Pro204Ser | p.P204S | Q8WWZ3 | protein_coding | deleterious(0) | probably_damaging(0.997) | TCGA-AP-A1DP-01 | Endometrium | uterine corpus endometrioid carcinoma | Female | >=65 | I/II | Chemotherapy | paclitaxel | PD |
| Page: 1 2 3 |
Top |
Related drugs of malignant transformation related genes |
| Identification of chemicals and drugs interact with genes involved in malignant transfromation |
| (DGIdb 4.0) |
| Entrez ID | Symbol | Category | Interaction Types | Drug Claim Name | Drug Name | PMIDs |
| Page: 1 |

Copyright 2023-Present -The University of Texas Health Science Center at Houston |