
|
|||||
|
 | |
| |
| |
| |
| |
| |
|
Gene: EBAG9 |
Gene summary for EBAG9 |
| Gene information | Species | Human | Gene symbol | EBAG9 | Gene ID | 9166 |
| Gene name | estrogen receptor binding site associated antigen 9 | |
| Gene Alias | EB9 | |
| Cytomap | 8q23.2 | |
| Gene Type | protein-coding | GO ID | GO:0001558 | UniProtAcc | A0A024R9E0 |
Top |
Malignant transformation analysis |
| Identification of the aberrant gene expression in precancerous and cancerous lesions by comparing the gene expression of stem-like cells in diseased tissues with normal stem cells |
| Entrez ID | Symbol | Replicates | Species | Organ | Tissue | Adj P-value | Log2FC | Malignancy |
| 9166 | EBAG9 | P48T-E | Human | Esophagus | ESCC | 1.23e-23 | 3.79e-01 | 0.0959 |
| 9166 | EBAG9 | P49T-E | Human | Esophagus | ESCC | 5.53e-19 | 1.99e+00 | 0.1768 |
| 9166 | EBAG9 | P52T-E | Human | Esophagus | ESCC | 1.28e-36 | 8.70e-01 | 0.1555 |
| 9166 | EBAG9 | P54T-E | Human | Esophagus | ESCC | 1.33e-35 | 8.39e-01 | 0.0975 |
| 9166 | EBAG9 | P56T-E | Human | Esophagus | ESCC | 9.54e-05 | 9.29e-01 | 0.1613 |
| 9166 | EBAG9 | P57T-E | Human | Esophagus | ESCC | 1.70e-27 | 6.10e-01 | 0.0926 |
| 9166 | EBAG9 | P61T-E | Human | Esophagus | ESCC | 1.56e-14 | 3.57e-01 | 0.099 |
| 9166 | EBAG9 | P62T-E | Human | Esophagus | ESCC | 2.82e-75 | 1.31e+00 | 0.1302 |
| 9166 | EBAG9 | P65T-E | Human | Esophagus | ESCC | 5.28e-25 | 5.14e-01 | 0.0978 |
| 9166 | EBAG9 | P74T-E | Human | Esophagus | ESCC | 8.24e-43 | 1.31e+00 | 0.1479 |
| 9166 | EBAG9 | P75T-E | Human | Esophagus | ESCC | 2.45e-76 | 1.45e+00 | 0.1125 |
| 9166 | EBAG9 | P76T-E | Human | Esophagus | ESCC | 4.05e-34 | 6.01e-01 | 0.1207 |
| 9166 | EBAG9 | P79T-E | Human | Esophagus | ESCC | 3.00e-39 | 7.16e-01 | 0.1154 |
| 9166 | EBAG9 | P80T-E | Human | Esophagus | ESCC | 2.46e-45 | 1.26e+00 | 0.155 |
| 9166 | EBAG9 | P82T-E | Human | Esophagus | ESCC | 1.20e-23 | 1.19e+00 | 0.1072 |
| 9166 | EBAG9 | P83T-E | Human | Esophagus | ESCC | 1.75e-65 | 2.03e+00 | 0.1738 |
| 9166 | EBAG9 | P84T-E | Human | Esophagus | ESCC | 2.21e-10 | 5.55e-01 | 0.0933 |
| 9166 | EBAG9 | P89T-E | Human | Esophagus | ESCC | 2.02e-21 | 1.61e+00 | 0.1752 |
| 9166 | EBAG9 | P91T-E | Human | Esophagus | ESCC | 3.87e-15 | 1.89e+00 | 0.1828 |
| 9166 | EBAG9 | P107T-E | Human | Esophagus | ESCC | 2.98e-38 | 8.20e-01 | 0.171 |
| Page: 1 2 3 4 5 6 7 |
| Tissue | Expression Dynamics | Abbreviation |
| Esophagus |  | ESCC: Esophageal squamous cell carcinoma |
| HGIN: High-grade intraepithelial neoplasias | ||
| LGIN: Low-grade intraepithelial neoplasias | ||
| Liver | 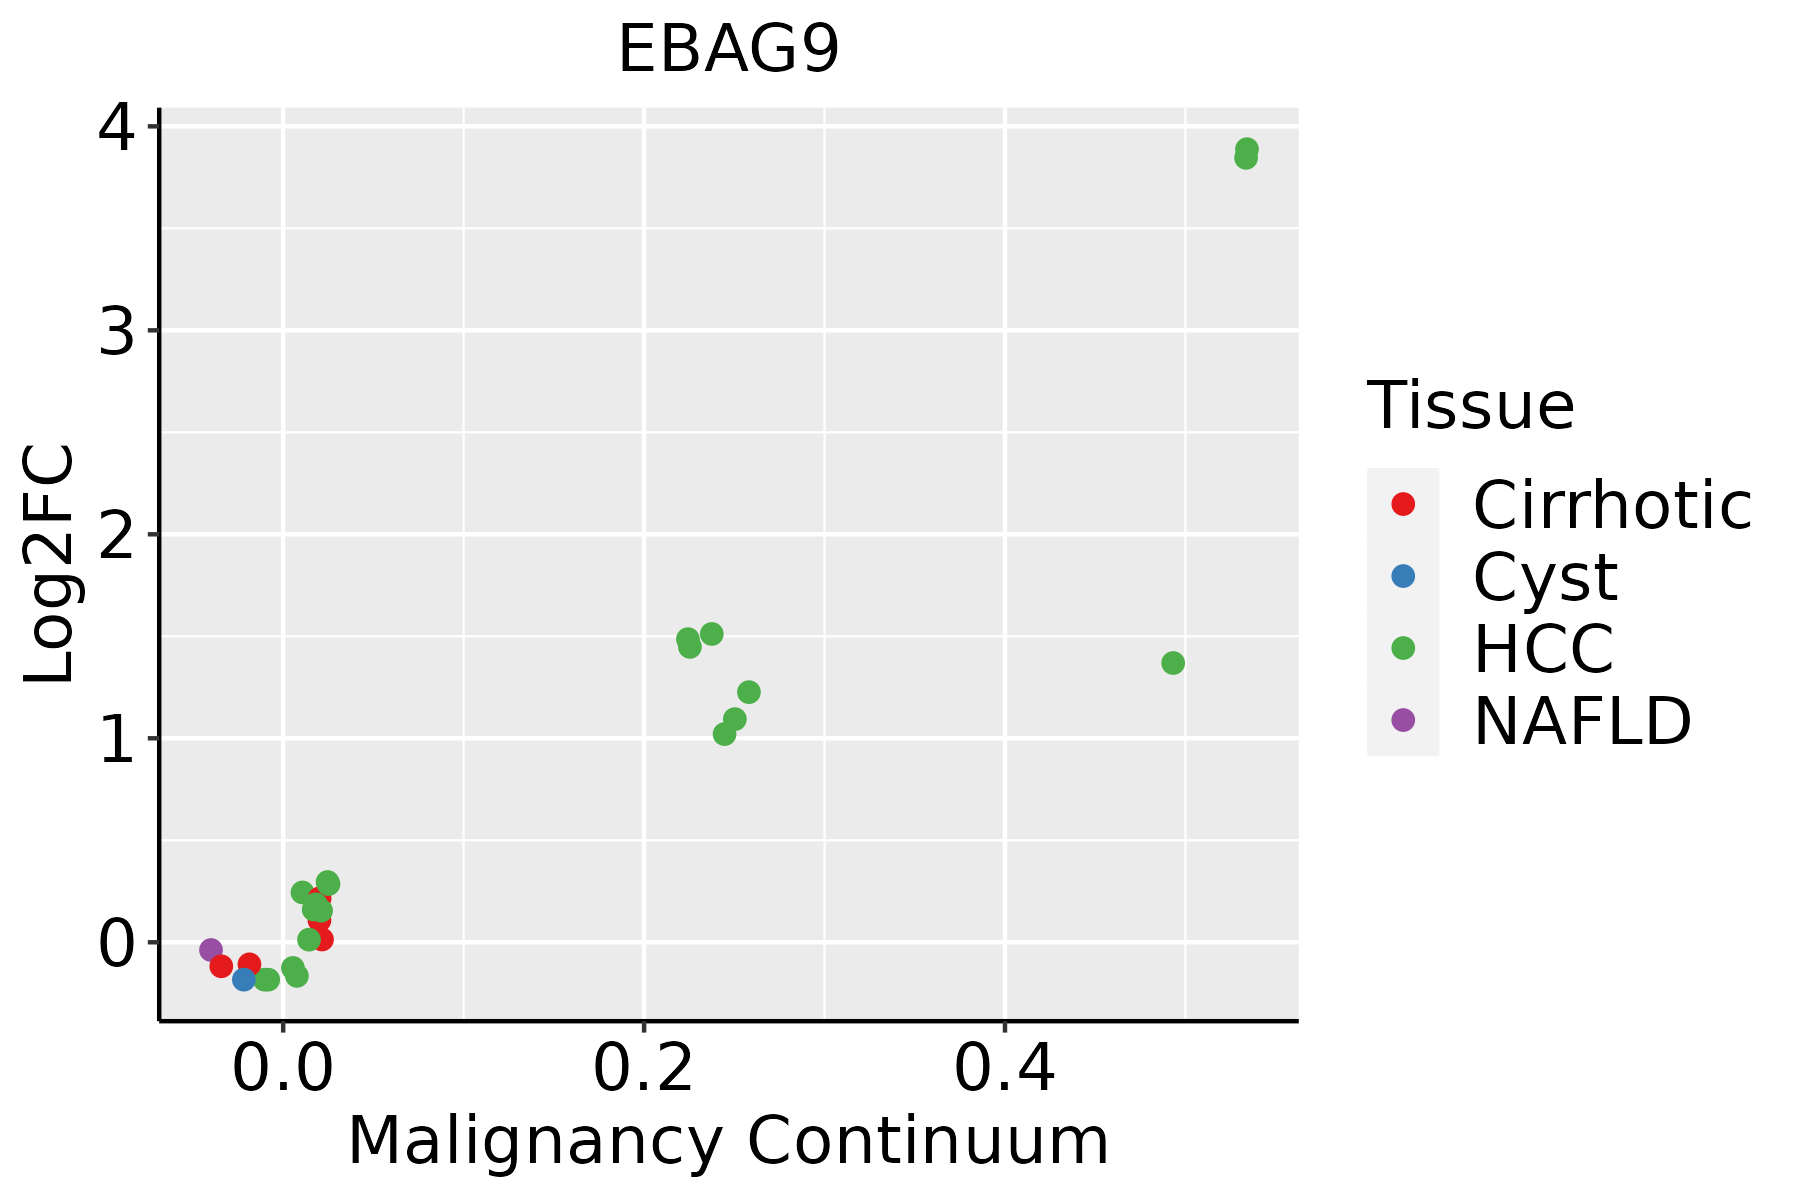 | HCC: Hepatocellular carcinoma |
| NAFLD: Non-alcoholic fatty liver disease | ||
| Oral Cavity | 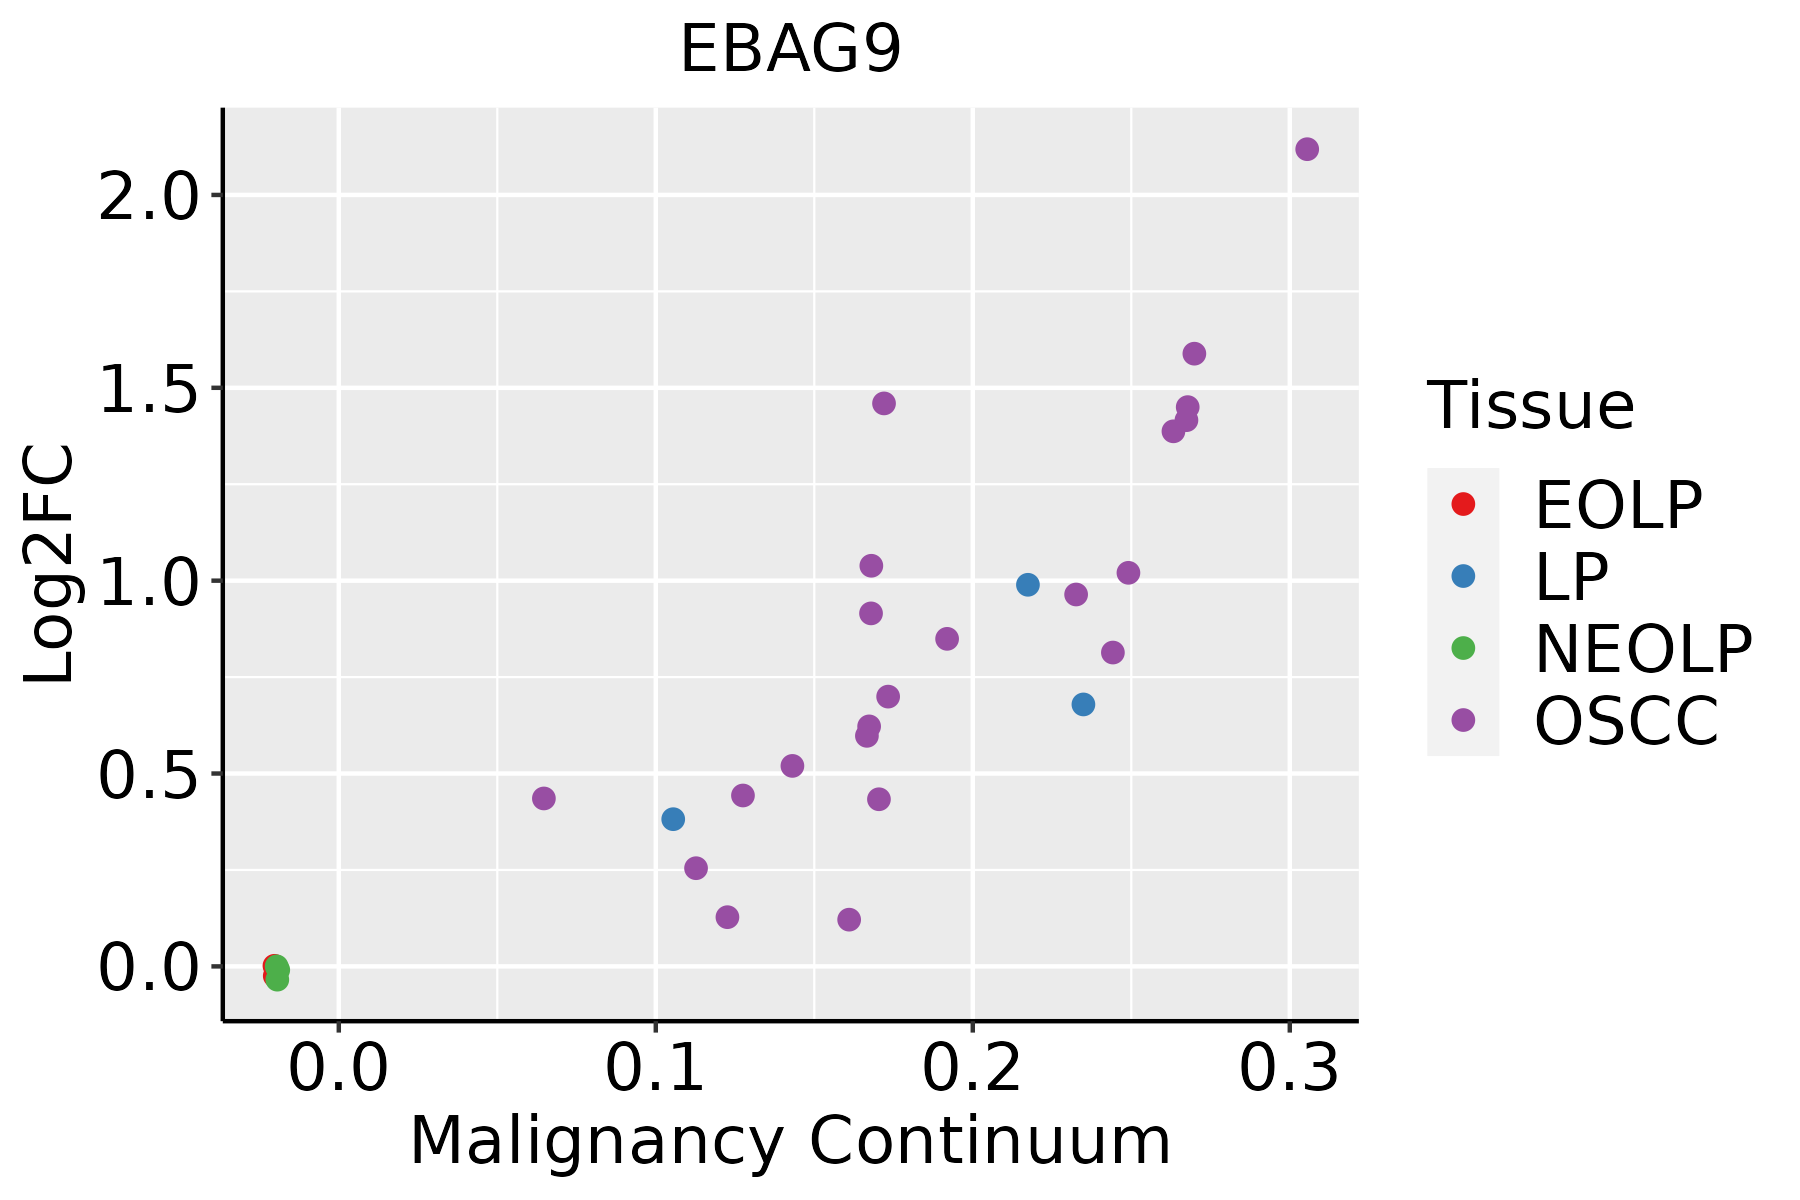 | EOLP: Erosive Oral lichen planus |
| LP: leukoplakia | ||
| NEOLP: Non-erosive oral lichen planus | ||
| OSCC: Oral squamous cell carcinoma | ||
| Skin |  | AK: Actinic keratosis |
| cSCC: Cutaneous squamous cell carcinoma | ||
| SCCIS:squamous cell carcinoma in situ | ||
| Thyroid | 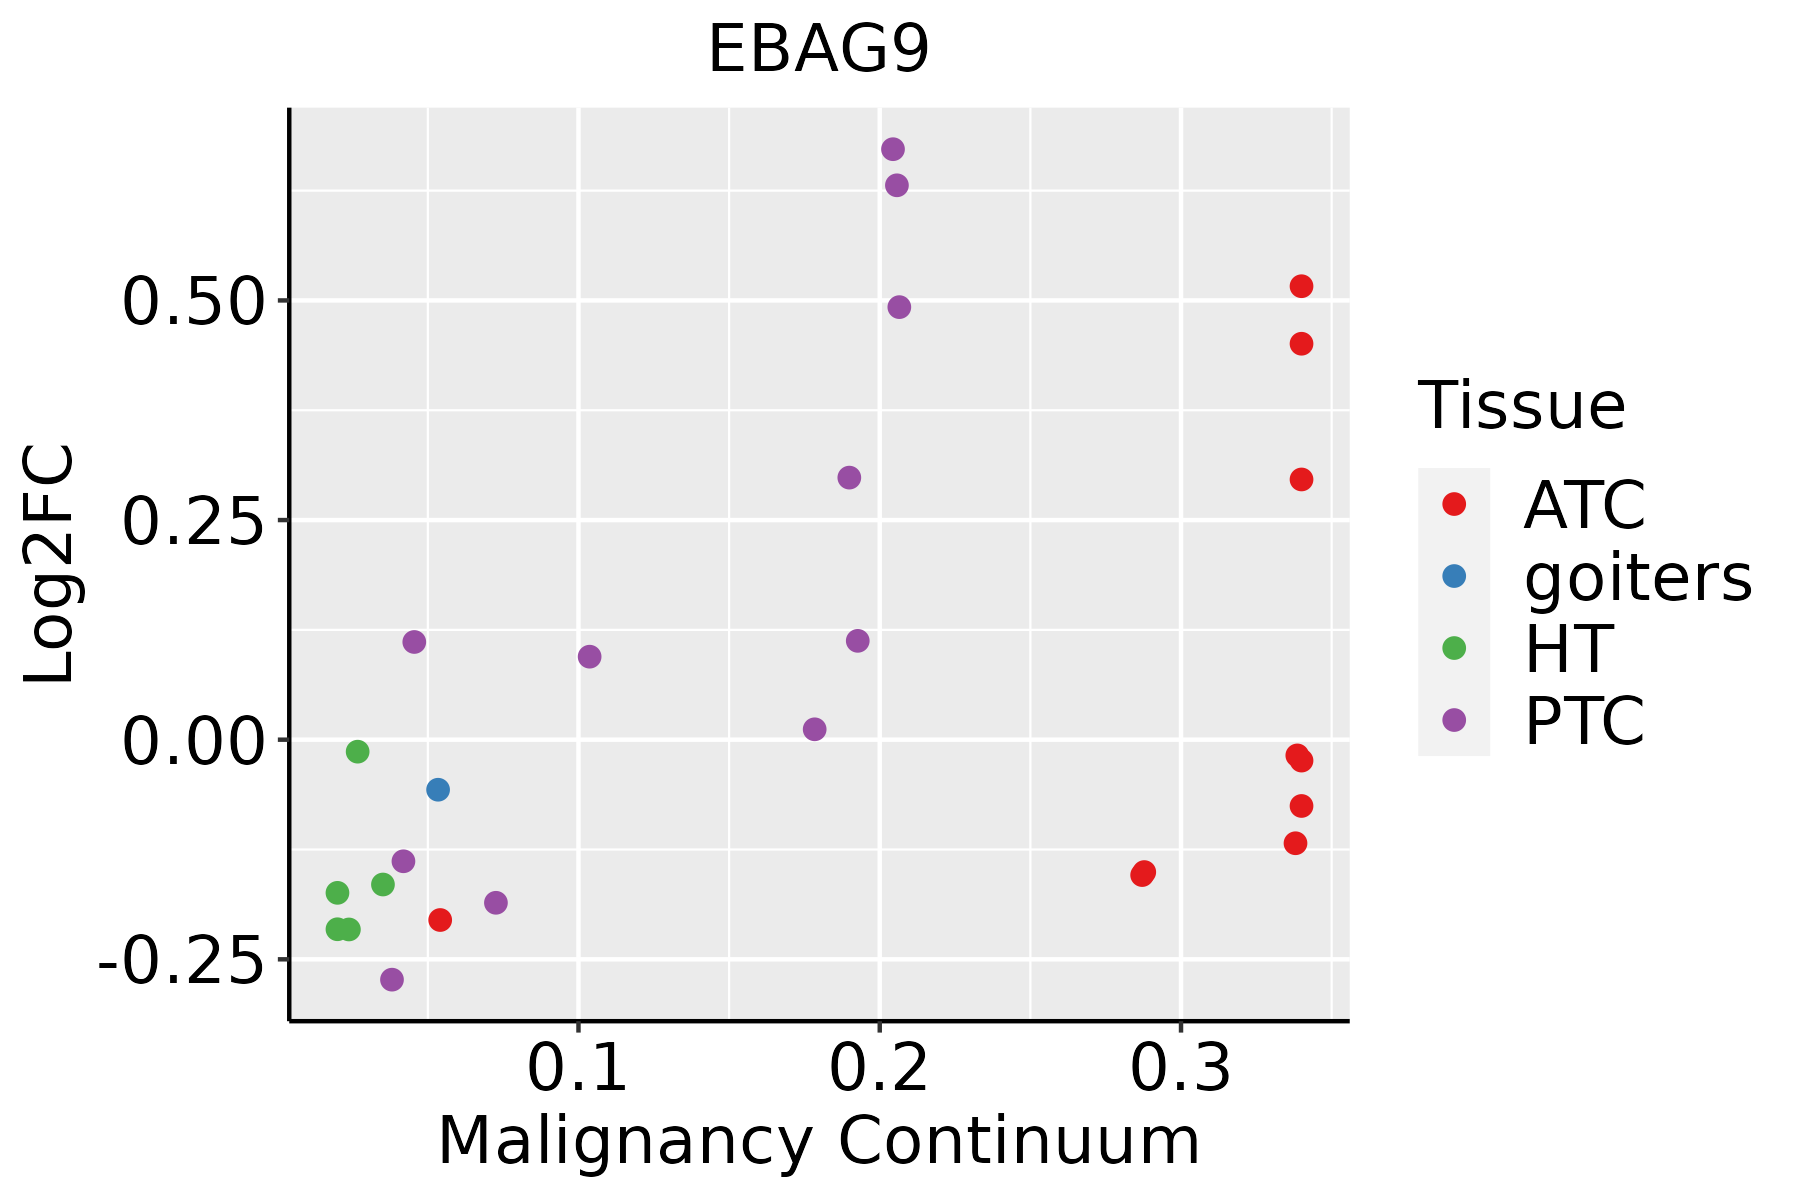 | ATC: Anaplastic thyroid cancer |
| HT: Hashimoto's thyroiditis | ||
| PTC: Papillary thyroid cancer |
| ∗log2FC in expression of this searched gene in stem-like cells from each diseased tissue sample relative to stem-like cells in normal samples in each tissue plotted against the malignancy continuum. Samples are colored based on if they are from different disease stage. |
Top |
Malignant transformation related pathway analysis |
| Find out the enriched GO biological processes and KEGG pathways involved in transition from healthy to precancer to cancer |
| Tissue | Disease Stage | Enriched GO biological Processes |
| Colorectum | AD |  |
| Colorectum | SER |  |
| Colorectum | MSS |  |
| Colorectum | MSI-H |  |
| Colorectum | FAP |  |
| ∗Top 15 enriched GO BP terms are showed in the bar plot of each disease state in each tissue. Each row represents a significant GO biological process which is colored according to the -log10(p.adjust). |
| Page: 1 2 3 4 5 6 7 8 9 |
| GO ID | Tissue | Disease Stage | Description | Gene Ratio | Bg Ratio | pvalue | p.adjust | Count |
| GO:0016049110 | Esophagus | ESCC | cell growth | 289/8552 | 482/18723 | 1.29e-10 | 3.77e-09 | 289 |
| GO:000155819 | Esophagus | ESCC | regulation of cell growth | 248/8552 | 414/18723 | 2.97e-09 | 6.45e-08 | 248 |
| GO:001604911 | Liver | Cirrhotic | cell growth | 160/4634 | 482/18723 | 1.50e-05 | 2.07e-04 | 160 |
| GO:000155811 | Liver | Cirrhotic | regulation of cell growth | 132/4634 | 414/18723 | 5.53e-04 | 4.36e-03 | 132 |
| GO:001604921 | Liver | HCC | cell growth | 269/7958 | 482/18723 | 1.84e-09 | 5.35e-08 | 269 |
| GO:000155821 | Liver | HCC | regulation of cell growth | 228/7958 | 414/18723 | 1.34e-07 | 2.55e-06 | 228 |
| GO:001604917 | Oral cavity | OSCC | cell growth | 268/7305 | 482/18723 | 6.55e-14 | 3.51e-12 | 268 |
| GO:000155816 | Oral cavity | OSCC | regulation of cell growth | 228/7305 | 414/18723 | 1.74e-11 | 6.09e-10 | 228 |
| GO:001604918 | Oral cavity | LP | cell growth | 155/4623 | 482/18723 | 1.08e-04 | 1.31e-03 | 155 |
| GO:000155817 | Oral cavity | LP | regulation of cell growth | 134/4623 | 414/18723 | 2.25e-04 | 2.41e-03 | 134 |
| GO:001604925 | Skin | cSCC | cell growth | 173/4864 | 482/18723 | 7.21e-07 | 1.34e-05 | 173 |
| GO:000155824 | Skin | cSCC | regulation of cell growth | 140/4864 | 414/18723 | 2.07e-04 | 1.72e-03 | 140 |
| GO:001604926 | Thyroid | HT | cell growth | 58/1272 | 482/18723 | 1.56e-05 | 3.82e-04 | 58 |
| GO:000155825 | Thyroid | HT | regulation of cell growth | 47/1272 | 414/18723 | 3.77e-04 | 4.76e-03 | 47 |
| GO:0016049112 | Thyroid | PTC | cell growth | 225/5968 | 482/18723 | 4.75e-12 | 2.07e-10 | 225 |
| GO:0001558111 | Thyroid | PTC | regulation of cell growth | 188/5968 | 414/18723 | 4.13e-09 | 1.09e-07 | 188 |
| GO:001604927 | Thyroid | ATC | cell growth | 241/6293 | 482/18723 | 4.27e-14 | 2.35e-12 | 241 |
| GO:000155826 | Thyroid | ATC | regulation of cell growth | 201/6293 | 414/18723 | 1.57e-10 | 4.76e-09 | 201 |
| Page: 1 |
| Pathway ID | Tissue | Disease Stage | Description | Gene Ratio | Bg Ratio | pvalue | p.adjust | qvalue | Count |
| Page: 1 |
Top |
Cell-cell communication analysis |
| Identification of potential cell-cell interactions between two cell types and their ligand-receptor pairs for different disease states |
| Ligand | Receptor | LRpair | Pathway | Tissue | Disease Stage |
| Page: 1 |
Top |
Single-cell gene regulatory network inference analysis |
| Find out the significant the regulons (TFs) and the target genes of each regulon across cell types for different disease states |
| TF | Cell Type | Tissue | Disease Stage | Target Gene | RSS | Regulon Activity |
| ∗The dot plots of a searched regulon are shown for all cell subpopulations in each disease state of each tissue based on the regulon specific score inferred using pySCENIC and by calculating the average expression. |
| Page: 1 |
Top |
Somatic mutation of malignant transformation related genes |
| Annotation of somatic variants for genes involved in malignant transformation |
| Hugo Symbol | Variant Class | Variant Classification | dbSNP RS | HGVSc | HGVSp | HGVSp Short | SWISSPROT | BIOTYPE | SIFT | PolyPhen | Tumor Sample Barcode | Tissue | Histology | Sex | Age | Stage | Therapy Types | Drugs | Outcome |
| EBAG9 | SNV | Missense_Mutation | c.139N>C | p.Asp47His | p.D47H | O00559 | protein_coding | deleterious(0.03) | probably_damaging(0.999) | TCGA-A7-A26G-01 | Breast | breast invasive carcinoma | Female | <65 | I/II | Chemotherapy | taxotere | SD | |
| EBAG9 | SNV | Missense_Mutation | c.232N>T | p.Gly78Trp | p.G78W | O00559 | protein_coding | deleterious(0.01) | probably_damaging(0.998) | TCGA-D8-A142-01 | Breast | breast invasive carcinoma | Female | >=65 | I/II | Chemotherapy | cyclophosphamid | SD | |
| EBAG9 | SNV | Missense_Mutation | c.364N>C | p.Asp122His | p.D122H | O00559 | protein_coding | deleterious(0.02) | possibly_damaging(0.551) | TCGA-DS-A0VM-01 | Cervix | cervical & endocervical cancer | Female | <65 | I/II | Chemotherapy | cisplatin | PD | |
| EBAG9 | SNV | Missense_Mutation | rs200319904 | c.559N>A | p.Glu187Lys | p.E187K | O00559 | protein_coding | deleterious(0) | probably_damaging(0.988) | TCGA-AA-3984-01 | Colorectum | colon adenocarcinoma | Female | <65 | I/II | Unknown | Unknown | SD |
| EBAG9 | SNV | Missense_Mutation | rs751442457 | c.19C>T | p.Arg7Trp | p.R7W | O00559 | protein_coding | deleterious(0.01) | probably_damaging(0.932) | TCGA-AA-A00N-01 | Colorectum | colon adenocarcinoma | Male | >=65 | I/II | Unknown | Unknown | PD |
| EBAG9 | SNV | Missense_Mutation | c.294G>T | p.Met98Ile | p.M98I | O00559 | protein_coding | deleterious(0.01) | probably_damaging(0.946) | TCGA-AA-A00N-01 | Colorectum | colon adenocarcinoma | Male | >=65 | I/II | Unknown | Unknown | PD | |
| EBAG9 | SNV | Missense_Mutation | rs200319904 | c.559G>A | p.Glu187Lys | p.E187K | O00559 | protein_coding | deleterious(0) | probably_damaging(0.988) | TCGA-AA-A00N-01 | Colorectum | colon adenocarcinoma | Male | >=65 | I/II | Unknown | Unknown | PD |
| EBAG9 | insertion | In_Frame_Ins | rs778693702 | c.614_615insTACTTTTACTTTTAG | p.Gln205delinsHisThrPheThrPheArg | p.Q205delinsHTFTFR | O00559 | protein_coding | TCGA-AM-5820-01 | Colorectum | colon adenocarcinoma | Female | <65 | I/II | Unknown | Unknown | SD | ||
| EBAG9 | SNV | Missense_Mutation | rs137981560 | c.20N>A | p.Arg7Gln | p.R7Q | O00559 | protein_coding | tolerated(0.11) | possibly_damaging(0.677) | TCGA-AP-A059-01 | Endometrium | uterine corpus endometrioid carcinoma | Female | >=65 | I/II | Unknown | Unknown | SD |
| EBAG9 | SNV | Missense_Mutation | novel | c.611N>G | p.Glu204Gly | p.E204G | O00559 | protein_coding | deleterious(0.02) | benign(0.168) | TCGA-AX-A06F-01 | Endometrium | uterine corpus endometrioid carcinoma | Female | <65 | III/IV | Chemotherapy | carboplatin | SD |
| Page: 1 2 3 |
Top |
Related drugs of malignant transformation related genes |
| Identification of chemicals and drugs interact with genes involved in malignant transfromation |
| (DGIdb 4.0) |
| Entrez ID | Symbol | Category | Interaction Types | Drug Claim Name | Drug Name | PMIDs |
| Page: 1 |

Copyright 2023-Present -The University of Texas Health Science Center at Houston |