
|
|||||
|
 | |
| |
| |
| |
| |
| |
|
Gene: DNAJC25 |
Gene summary for DNAJC25 |
| Gene information | Species | Human | Gene symbol | DNAJC25 | Gene ID | 548645 |
| Gene name | DnaJ heat shock protein family (Hsp40) member C25 | |
| Gene Alias | bA16L21.2.1 | |
| Cytomap | 9q31.3 | |
| Gene Type | protein-coding | GO ID | GO:0006457 | UniProtAcc | Q9H1X3 |
Top |
Malignant transformation analysis |
| Identification of the aberrant gene expression in precancerous and cancerous lesions by comparing the gene expression of stem-like cells in diseased tissues with normal stem cells |
| Entrez ID | Symbol | Replicates | Species | Organ | Tissue | Adj P-value | Log2FC | Malignancy |
| 548645 | DNAJC25 | P74T-E | Human | Esophagus | ESCC | 2.09e-08 | 2.36e-01 | 0.1479 |
| 548645 | DNAJC25 | P75T-E | Human | Esophagus | ESCC | 1.03e-24 | 4.65e-01 | 0.1125 |
| 548645 | DNAJC25 | P76T-E | Human | Esophagus | ESCC | 2.24e-09 | 2.13e-01 | 0.1207 |
| 548645 | DNAJC25 | P79T-E | Human | Esophagus | ESCC | 5.74e-08 | 1.06e-01 | 0.1154 |
| 548645 | DNAJC25 | P80T-E | Human | Esophagus | ESCC | 8.50e-17 | 4.51e-01 | 0.155 |
| 548645 | DNAJC25 | P82T-E | Human | Esophagus | ESCC | 1.31e-09 | 2.32e-01 | 0.1072 |
| 548645 | DNAJC25 | P83T-E | Human | Esophagus | ESCC | 2.57e-15 | 4.83e-01 | 0.1738 |
| 548645 | DNAJC25 | P89T-E | Human | Esophagus | ESCC | 4.59e-06 | 2.67e-01 | 0.1752 |
| 548645 | DNAJC25 | P91T-E | Human | Esophagus | ESCC | 1.80e-02 | 2.06e-01 | 0.1828 |
| 548645 | DNAJC25 | P107T-E | Human | Esophagus | ESCC | 1.13e-27 | 6.82e-01 | 0.171 |
| 548645 | DNAJC25 | P126T-E | Human | Esophagus | ESCC | 7.99e-03 | 1.81e-01 | 0.1125 |
| 548645 | DNAJC25 | P127T-E | Human | Esophagus | ESCC | 6.28e-04 | 1.16e-01 | 0.0826 |
| 548645 | DNAJC25 | P128T-E | Human | Esophagus | ESCC | 1.06e-10 | 3.81e-01 | 0.1241 |
| 548645 | DNAJC25 | P130T-E | Human | Esophagus | ESCC | 3.70e-21 | 3.68e-01 | 0.1676 |
| 548645 | DNAJC25 | C04 | Human | Oral cavity | OSCC | 4.53e-05 | 4.98e-01 | 0.2633 |
| 548645 | DNAJC25 | C21 | Human | Oral cavity | OSCC | 2.05e-15 | 6.19e-01 | 0.2678 |
| 548645 | DNAJC25 | C30 | Human | Oral cavity | OSCC | 2.54e-13 | 7.87e-01 | 0.3055 |
| 548645 | DNAJC25 | C46 | Human | Oral cavity | OSCC | 5.50e-05 | 1.72e-01 | 0.1673 |
| 548645 | DNAJC25 | C57 | Human | Oral cavity | OSCC | 3.18e-08 | 3.54e-01 | 0.1679 |
| 548645 | DNAJC25 | C08 | Human | Oral cavity | OSCC | 1.07e-02 | 9.20e-02 | 0.1919 |
| Page: 1 2 3 4 |
| Tissue | Expression Dynamics | Abbreviation |
| Esophagus | 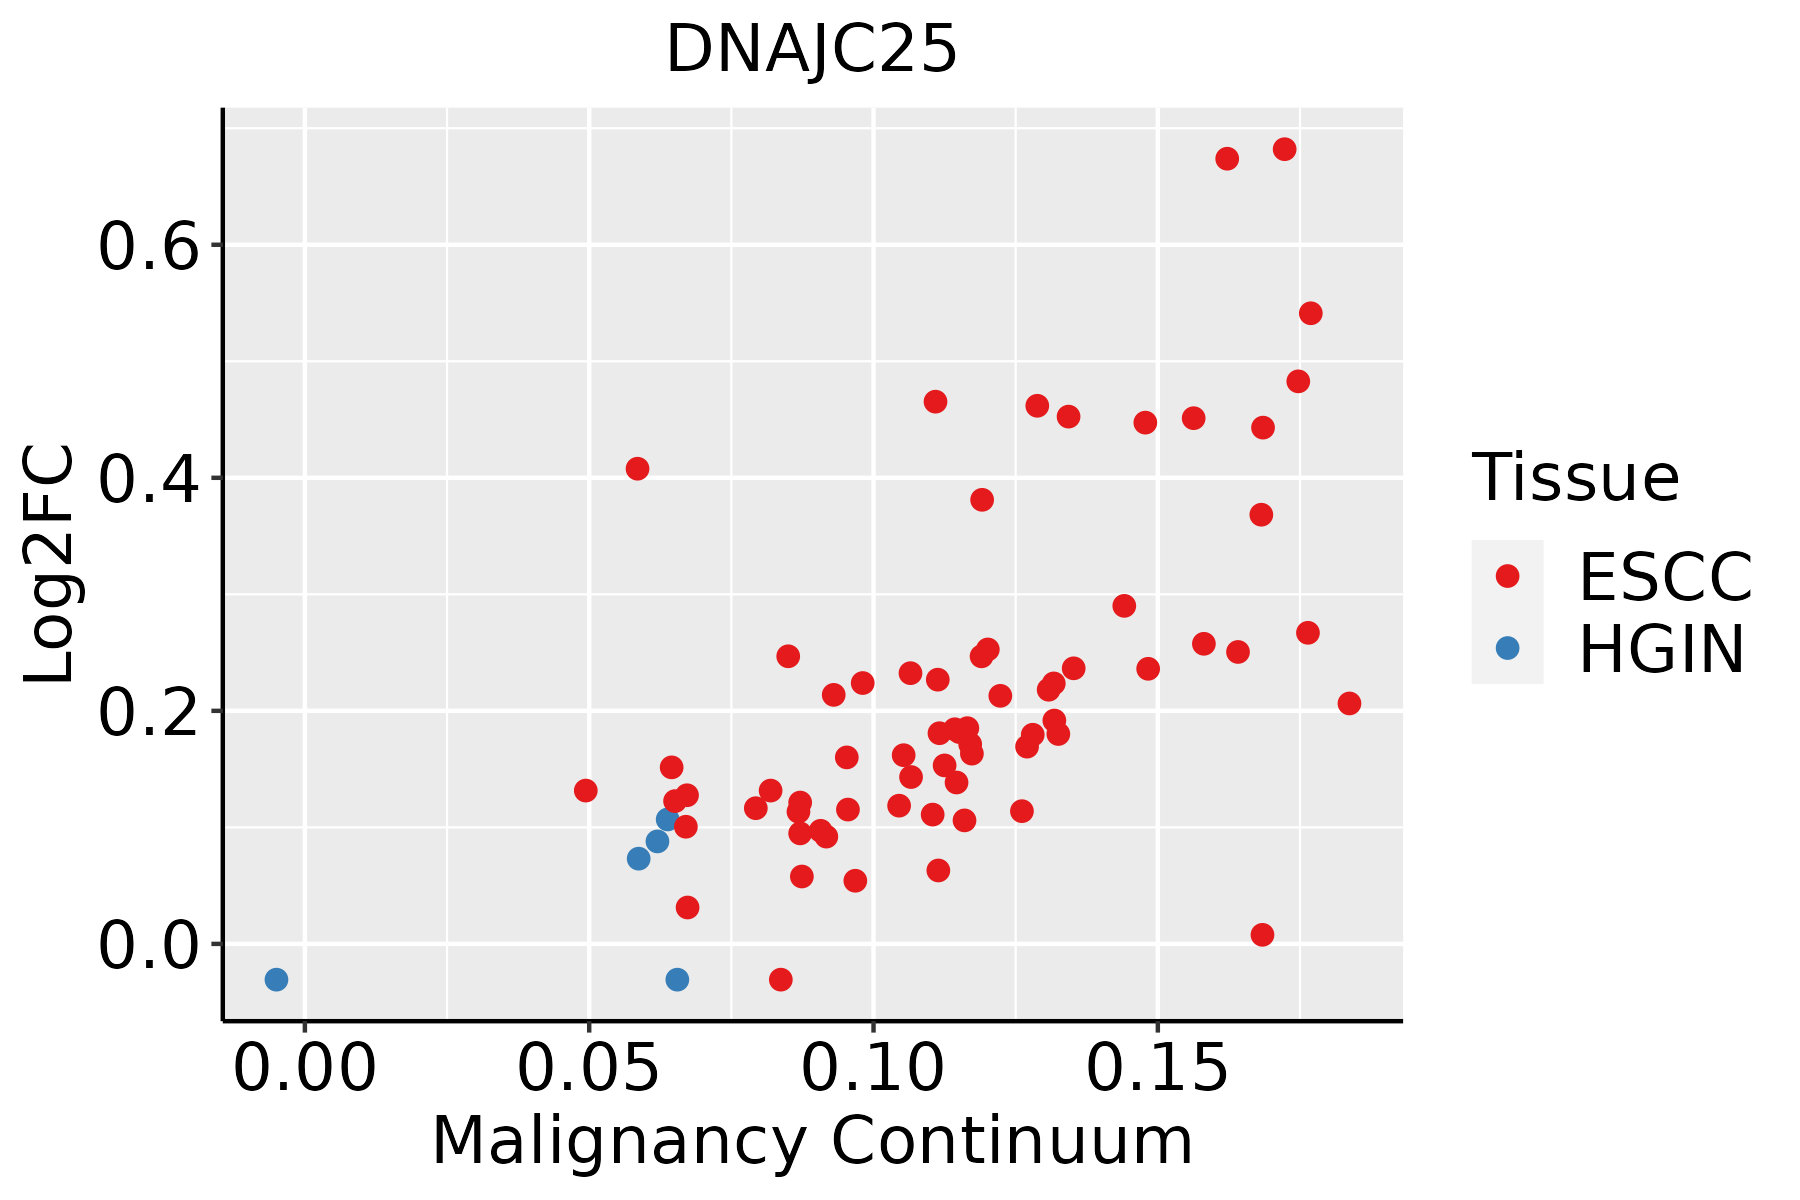 | ESCC: Esophageal squamous cell carcinoma |
| HGIN: High-grade intraepithelial neoplasias | ||
| LGIN: Low-grade intraepithelial neoplasias | ||
| Oral Cavity | 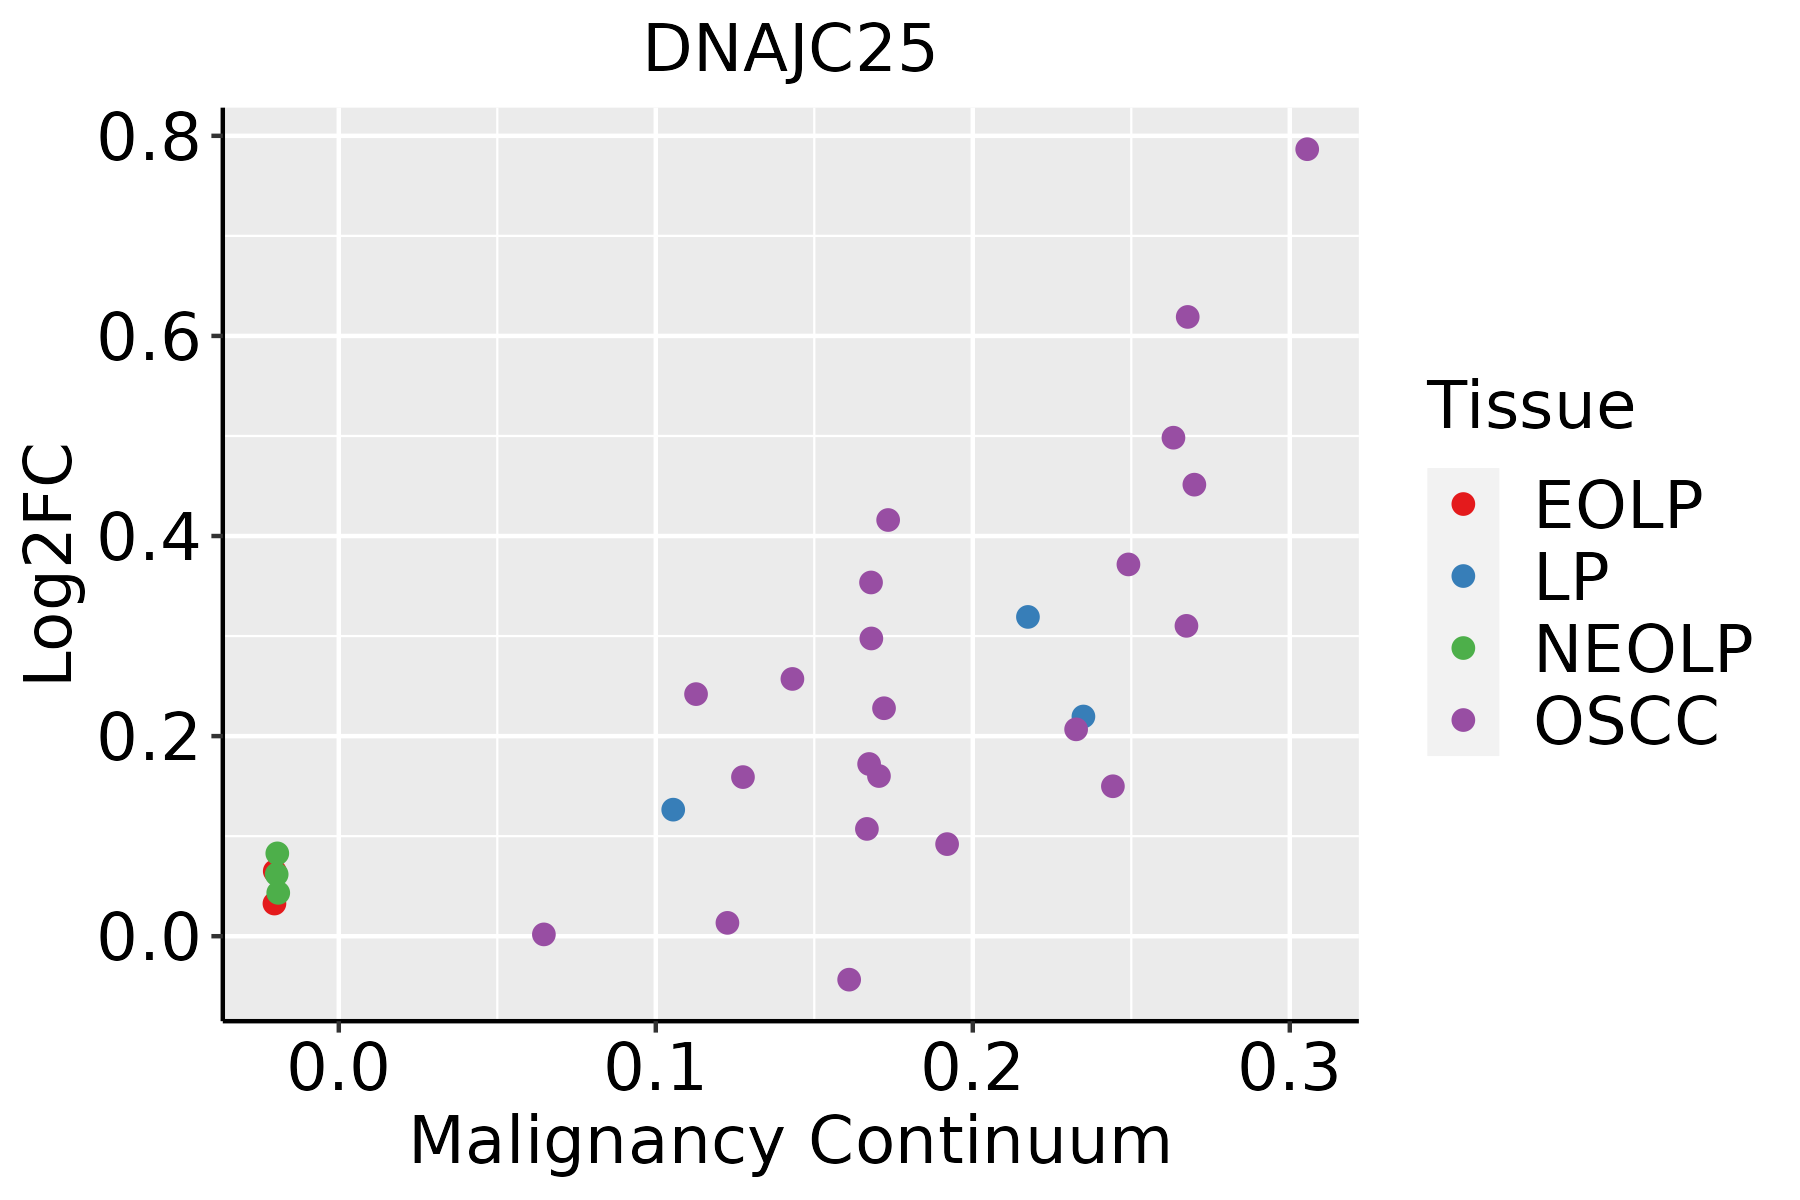 | EOLP: Erosive Oral lichen planus |
| LP: leukoplakia | ||
| NEOLP: Non-erosive oral lichen planus | ||
| OSCC: Oral squamous cell carcinoma | ||
| Thyroid | 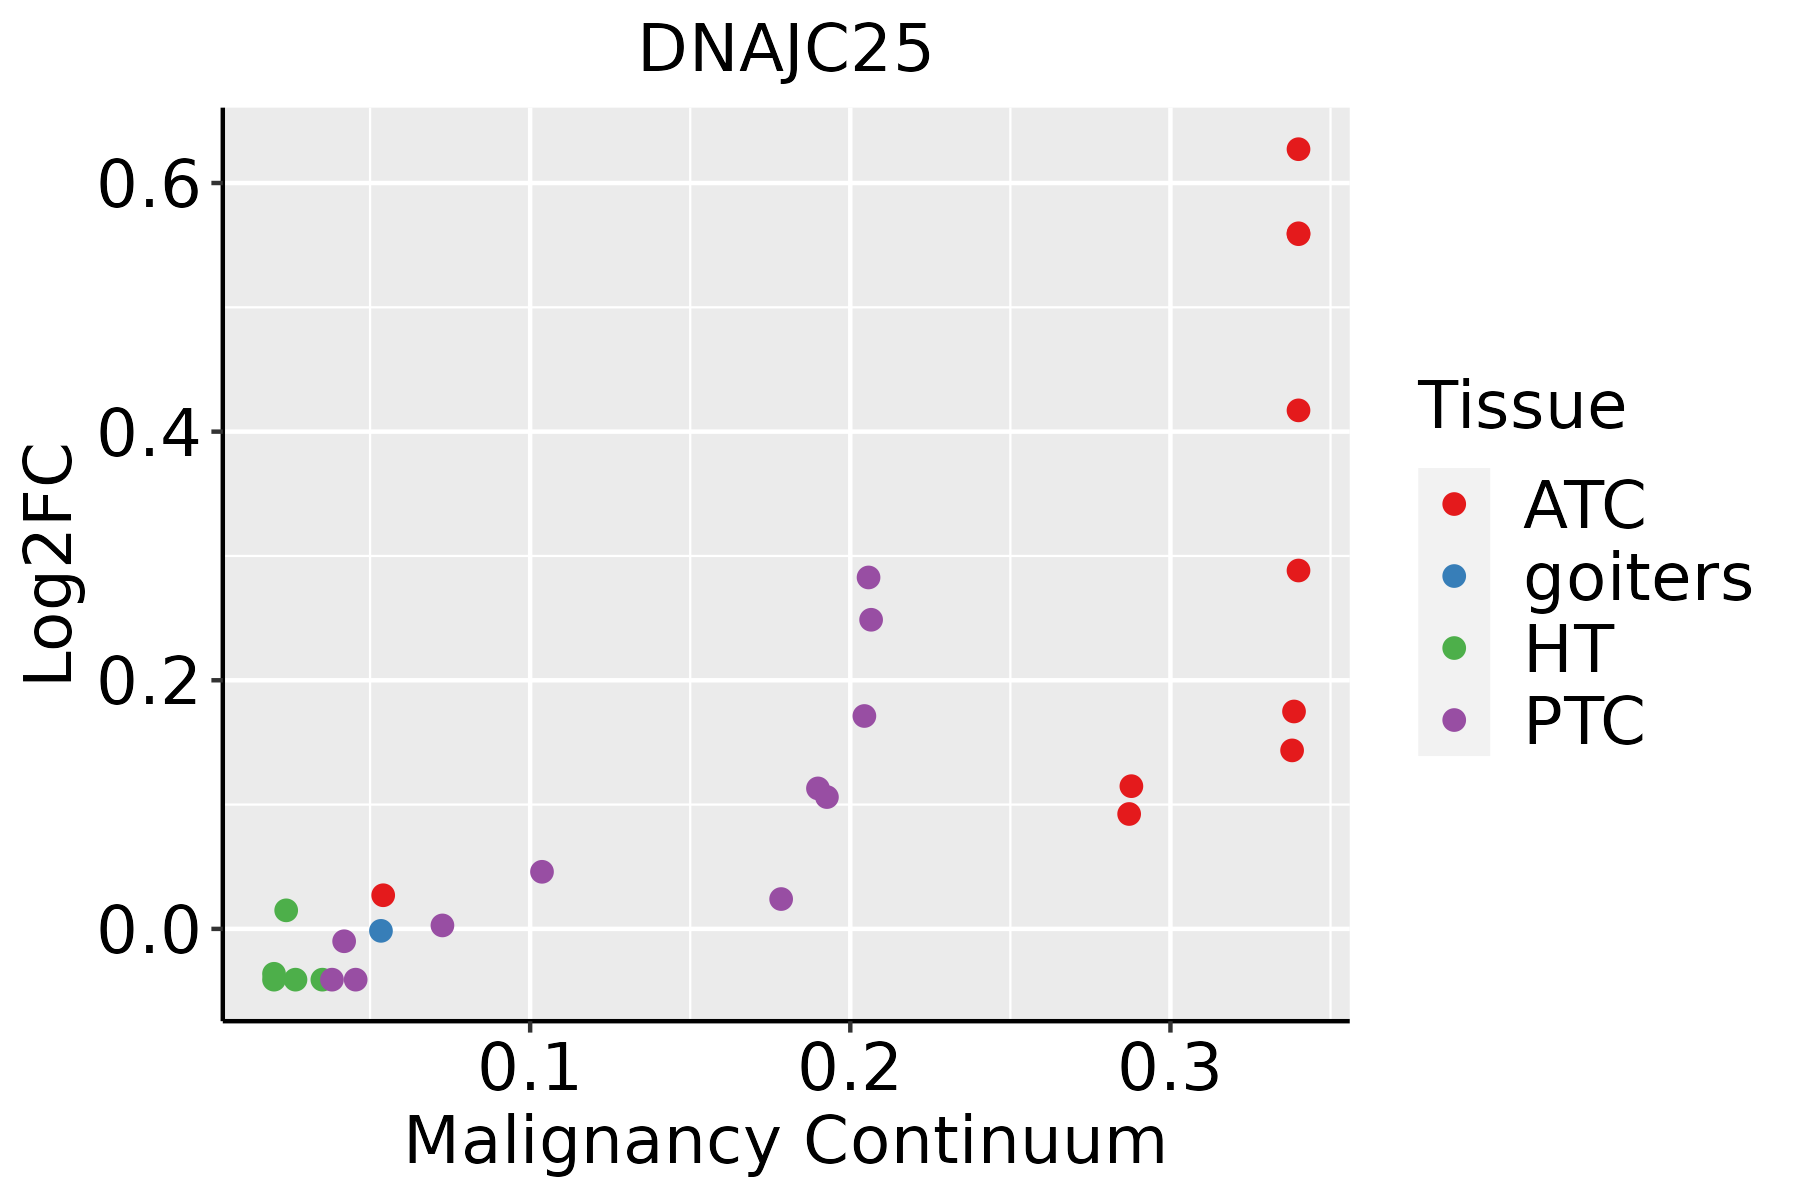 | ATC: Anaplastic thyroid cancer |
| HT: Hashimoto's thyroiditis | ||
| PTC: Papillary thyroid cancer |
| ∗log2FC in expression of this searched gene in stem-like cells from each diseased tissue sample relative to stem-like cells in normal samples in each tissue plotted against the malignancy continuum. Samples are colored based on if they are from different disease stage. |
Top |
Malignant transformation related pathway analysis |
| Find out the enriched GO biological processes and KEGG pathways involved in transition from healthy to precancer to cancer |
| Tissue | Disease Stage | Enriched GO biological Processes |
| Colorectum | AD |  |
| Colorectum | SER |  |
| Colorectum | MSS |  |
| Colorectum | MSI-H |  |
| Colorectum | FAP |  |
| ∗Top 15 enriched GO BP terms are showed in the bar plot of each disease state in each tissue. Each row represents a significant GO biological process which is colored according to the -log10(p.adjust). |
| Page: 1 2 3 4 5 6 7 8 9 |
| GO ID | Tissue | Disease Stage | Description | Gene Ratio | Bg Ratio | pvalue | p.adjust | Count |
| GO:0006457110 | Esophagus | ESCC | protein folding | 163/8552 | 212/18723 | 1.13e-20 | 1.74e-18 | 163 |
| GO:000645718 | Oral cavity | OSCC | protein folding | 154/7305 | 212/18723 | 1.89e-23 | 4.60e-21 | 154 |
| GO:0006457112 | Thyroid | PTC | protein folding | 137/5968 | 212/18723 | 8.29e-23 | 2.01e-20 | 137 |
| GO:000645733 | Thyroid | ATC | protein folding | 140/6293 | 212/18723 | 3.46e-22 | 8.09e-20 | 140 |
| Page: 1 |
| Pathway ID | Tissue | Disease Stage | Description | Gene Ratio | Bg Ratio | pvalue | p.adjust | qvalue | Count |
| Page: 1 |
Top |
Cell-cell communication analysis |
| Identification of potential cell-cell interactions between two cell types and their ligand-receptor pairs for different disease states |
| Ligand | Receptor | LRpair | Pathway | Tissue | Disease Stage |
| Page: 1 |
Top |
Single-cell gene regulatory network inference analysis |
| Find out the significant the regulons (TFs) and the target genes of each regulon across cell types for different disease states |
| TF | Cell Type | Tissue | Disease Stage | Target Gene | RSS | Regulon Activity |
| ∗The dot plots of a searched regulon are shown for all cell subpopulations in each disease state of each tissue based on the regulon specific score inferred using pySCENIC and by calculating the average expression. |
| Page: 1 |
Top |
Somatic mutation of malignant transformation related genes |
| Annotation of somatic variants for genes involved in malignant transformation |
| Hugo Symbol | Variant Class | Variant Classification | dbSNP RS | HGVSc | HGVSp | HGVSp Short | SWISSPROT | BIOTYPE | SIFT | PolyPhen | Tumor Sample Barcode | Tissue | Histology | Sex | Age | Stage | Therapy Types | Drugs | Outcome |
| DNAJC25 | insertion | Frame_Shift_Ins | novel | c.918_919insGCCCATGCGT | p.Thr307AlafsTer7 | p.T307Afs*7 | Q9H1X3 | protein_coding | TCGA-A7-A0CE-01 | Breast | breast invasive carcinoma | Female | <65 | I/II | Chemotherapy | adriamycin | SD | ||
| DNAJC25 | insertion | In_Frame_Ins | novel | c.920_921insACAGGA | p.Thr307_Phe308insGlnAsp | p.T307_F308insQD | Q9H1X3 | protein_coding | TCGA-A7-A0CE-01 | Breast | breast invasive carcinoma | Female | <65 | I/II | Chemotherapy | adriamycin | SD | ||
| DNAJC25 | insertion | Frame_Shift_Ins | novel | c.1021_1022insTCTATCTC | p.Lys341IlefsTer10 | p.K341Ifs*10 | Q9H1X3 | protein_coding | TCGA-BH-A0AY-01 | Breast | breast invasive carcinoma | Female | <65 | I/II | Chemotherapy | SD | |||
| DNAJC25 | SNV | Missense_Mutation | novel | c.456T>G | p.Ile152Met | p.I152M | Q9H1X3 | protein_coding | deleterious(0) | possibly_damaging(0.855) | TCGA-AA-A00N-01 | Colorectum | colon adenocarcinoma | Male | >=65 | I/II | Unknown | Unknown | PD |
| DNAJC25 | SNV | Missense_Mutation | novel | c.782T>C | p.Val261Ala | p.V261A | Q9H1X3 | protein_coding | tolerated(0.52) | benign(0) | TCGA-CA-6717-01 | Colorectum | colon adenocarcinoma | Male | <65 | I/II | Chemotherapy | oxaliplatin | CR |
| DNAJC25 | SNV | Missense_Mutation | novel | c.409N>C | p.Tyr137His | p.Y137H | Q9H1X3 | protein_coding | deleterious(0) | probably_damaging(0.996) | TCGA-G4-6302-01 | Colorectum | colon adenocarcinoma | Female | >=65 | I/II | Unknown | Unknown | SD |
| DNAJC25 | SNV | Missense_Mutation | rs750942878 | c.553C>T | p.Arg185Cys | p.R185C | Q9H1X3 | protein_coding | deleterious(0) | benign(0.028) | TCGA-WS-AB45-01 | Colorectum | colon adenocarcinoma | Female | <65 | I/II | Unknown | Unknown | SD |
| DNAJC25 | SNV | Missense_Mutation | c.454N>C | p.Ile152Leu | p.I152L | Q9H1X3 | protein_coding | tolerated(0.2) | benign(0.203) | TCGA-AG-3892-01 | Colorectum | rectum adenocarcinoma | Female | <65 | I/II | Unknown | Unknown | SD | |
| DNAJC25 | SNV | Missense_Mutation | rs750942878 | c.553N>T | p.Arg185Cys | p.R185C | Q9H1X3 | protein_coding | deleterious(0) | benign(0.028) | TCGA-AG-A002-01 | Colorectum | rectum adenocarcinoma | Male | <65 | I/II | Unknown | Unknown | SD |
| DNAJC25 | SNV | Missense_Mutation | novel | c.400T>G | p.Tyr134Asp | p.Y134D | Q9H1X3 | protein_coding | deleterious(0) | possibly_damaging(0.832) | TCGA-AG-A02X-01 | Colorectum | rectum adenocarcinoma | Male | >=65 | I/II | Unknown | Unknown | SD |
| Page: 1 2 3 4 |
Top |
Related drugs of malignant transformation related genes |
| Identification of chemicals and drugs interact with genes involved in malignant transfromation |
| (DGIdb 4.0) |
| Entrez ID | Symbol | Category | Interaction Types | Drug Claim Name | Drug Name | PMIDs |
| Page: 1 |

Copyright 2023-Present -The University of Texas Health Science Center at Houston |