
|
|||||
|
 | |
| |
| |
| |
| |
| |
|
Gene: DNAJC19 |
Gene summary for DNAJC19 |
| Gene information | Species | Human | Gene symbol | DNAJC19 | Gene ID | 131118 |
| Gene name | DnaJ heat shock protein family (Hsp40) member C19 | |
| Gene Alias | PAM18 | |
| Cytomap | 3q26.33 | |
| Gene Type | protein-coding | GO ID | GO:0000003 | UniProtAcc | Q96DA6 |
Top |
Malignant transformation analysis |
| Identification of the aberrant gene expression in precancerous and cancerous lesions by comparing the gene expression of stem-like cells in diseased tissues with normal stem cells |
| Entrez ID | Symbol | Replicates | Species | Organ | Tissue | Adj P-value | Log2FC | Malignancy |
| 131118 | DNAJC19 | P44T-E | Human | Esophagus | ESCC | 1.13e-17 | 6.38e-01 | 0.1096 |
| 131118 | DNAJC19 | P47T-E | Human | Esophagus | ESCC | 1.70e-53 | 1.15e+00 | 0.1067 |
| 131118 | DNAJC19 | P48T-E | Human | Esophagus | ESCC | 8.41e-49 | 9.81e-01 | 0.0959 |
| 131118 | DNAJC19 | P49T-E | Human | Esophagus | ESCC | 4.14e-13 | 2.02e+00 | 0.1768 |
| 131118 | DNAJC19 | P52T-E | Human | Esophagus | ESCC | 3.59e-80 | 1.97e+00 | 0.1555 |
| 131118 | DNAJC19 | P54T-E | Human | Esophagus | ESCC | 1.00e-25 | 8.26e-01 | 0.0975 |
| 131118 | DNAJC19 | P56T-E | Human | Esophagus | ESCC | 7.23e-14 | 1.97e+00 | 0.1613 |
| 131118 | DNAJC19 | P57T-E | Human | Esophagus | ESCC | 2.59e-31 | 6.46e-01 | 0.0926 |
| 131118 | DNAJC19 | P61T-E | Human | Esophagus | ESCC | 2.01e-27 | 8.88e-01 | 0.099 |
| 131118 | DNAJC19 | P62T-E | Human | Esophagus | ESCC | 6.64e-71 | 1.39e+00 | 0.1302 |
| 131118 | DNAJC19 | P65T-E | Human | Esophagus | ESCC | 2.49e-30 | 7.84e-01 | 0.0978 |
| 131118 | DNAJC19 | P74T-E | Human | Esophagus | ESCC | 5.50e-65 | 2.44e+00 | 0.1479 |
| 131118 | DNAJC19 | P75T-E | Human | Esophagus | ESCC | 1.16e-88 | 1.93e+00 | 0.1125 |
| 131118 | DNAJC19 | P76T-E | Human | Esophagus | ESCC | 1.12e-56 | 1.19e+00 | 0.1207 |
| 131118 | DNAJC19 | P79T-E | Human | Esophagus | ESCC | 3.99e-73 | 1.48e+00 | 0.1154 |
| 131118 | DNAJC19 | P80T-E | Human | Esophagus | ESCC | 1.28e-66 | 2.38e+00 | 0.155 |
| 131118 | DNAJC19 | P82T-E | Human | Esophagus | ESCC | 7.77e-18 | 1.26e+00 | 0.1072 |
| 131118 | DNAJC19 | P83T-E | Human | Esophagus | ESCC | 1.62e-70 | 2.42e+00 | 0.1738 |
| 131118 | DNAJC19 | P84T-E | Human | Esophagus | ESCC | 5.90e-08 | 8.16e-01 | 0.0933 |
| 131118 | DNAJC19 | P89T-E | Human | Esophagus | ESCC | 1.46e-32 | 2.26e+00 | 0.1752 |
| Page: 1 2 3 4 5 6 7 |
| Tissue | Expression Dynamics | Abbreviation |
| Esophagus |  | ESCC: Esophageal squamous cell carcinoma |
| HGIN: High-grade intraepithelial neoplasias | ||
| LGIN: Low-grade intraepithelial neoplasias | ||
| Liver |  | HCC: Hepatocellular carcinoma |
| NAFLD: Non-alcoholic fatty liver disease | ||
| Oral Cavity | 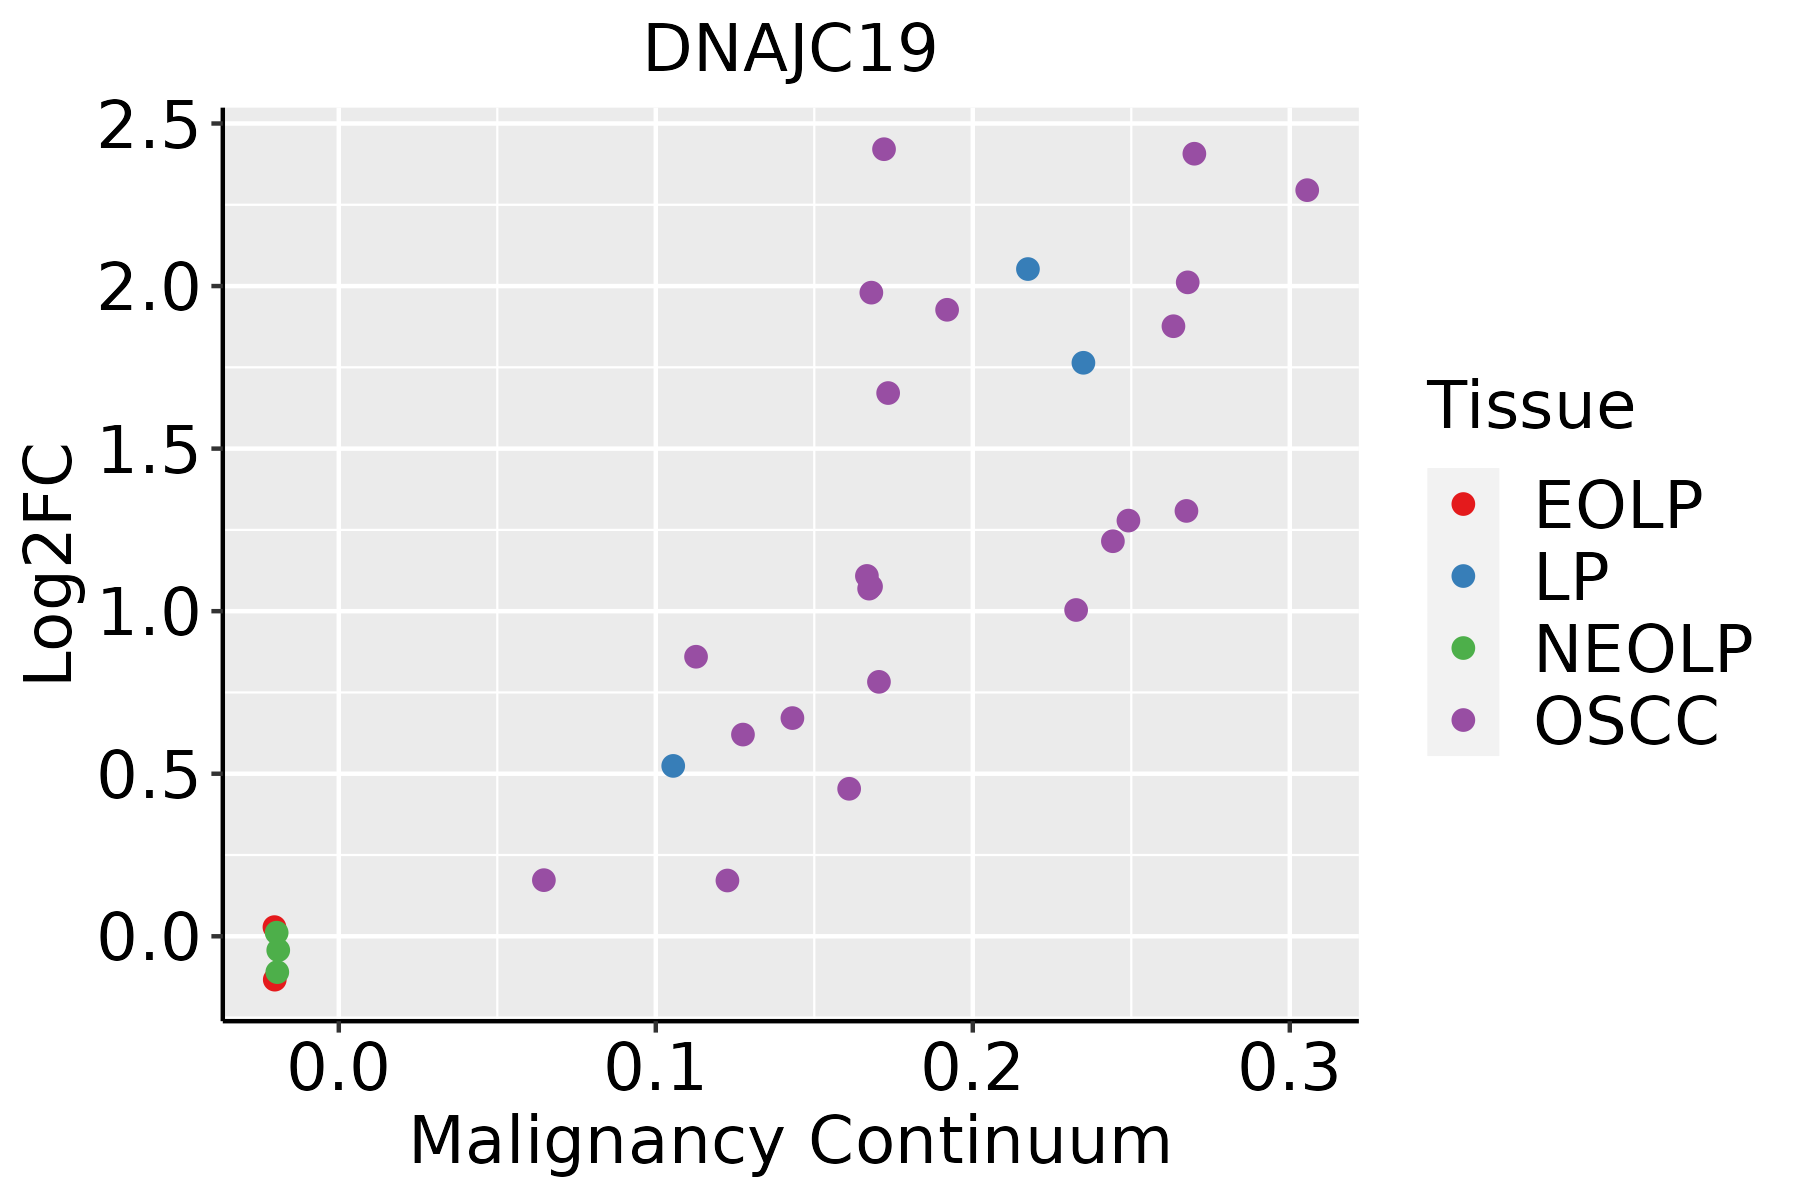 | EOLP: Erosive Oral lichen planus |
| LP: leukoplakia | ||
| NEOLP: Non-erosive oral lichen planus | ||
| OSCC: Oral squamous cell carcinoma | ||
| Prostate | 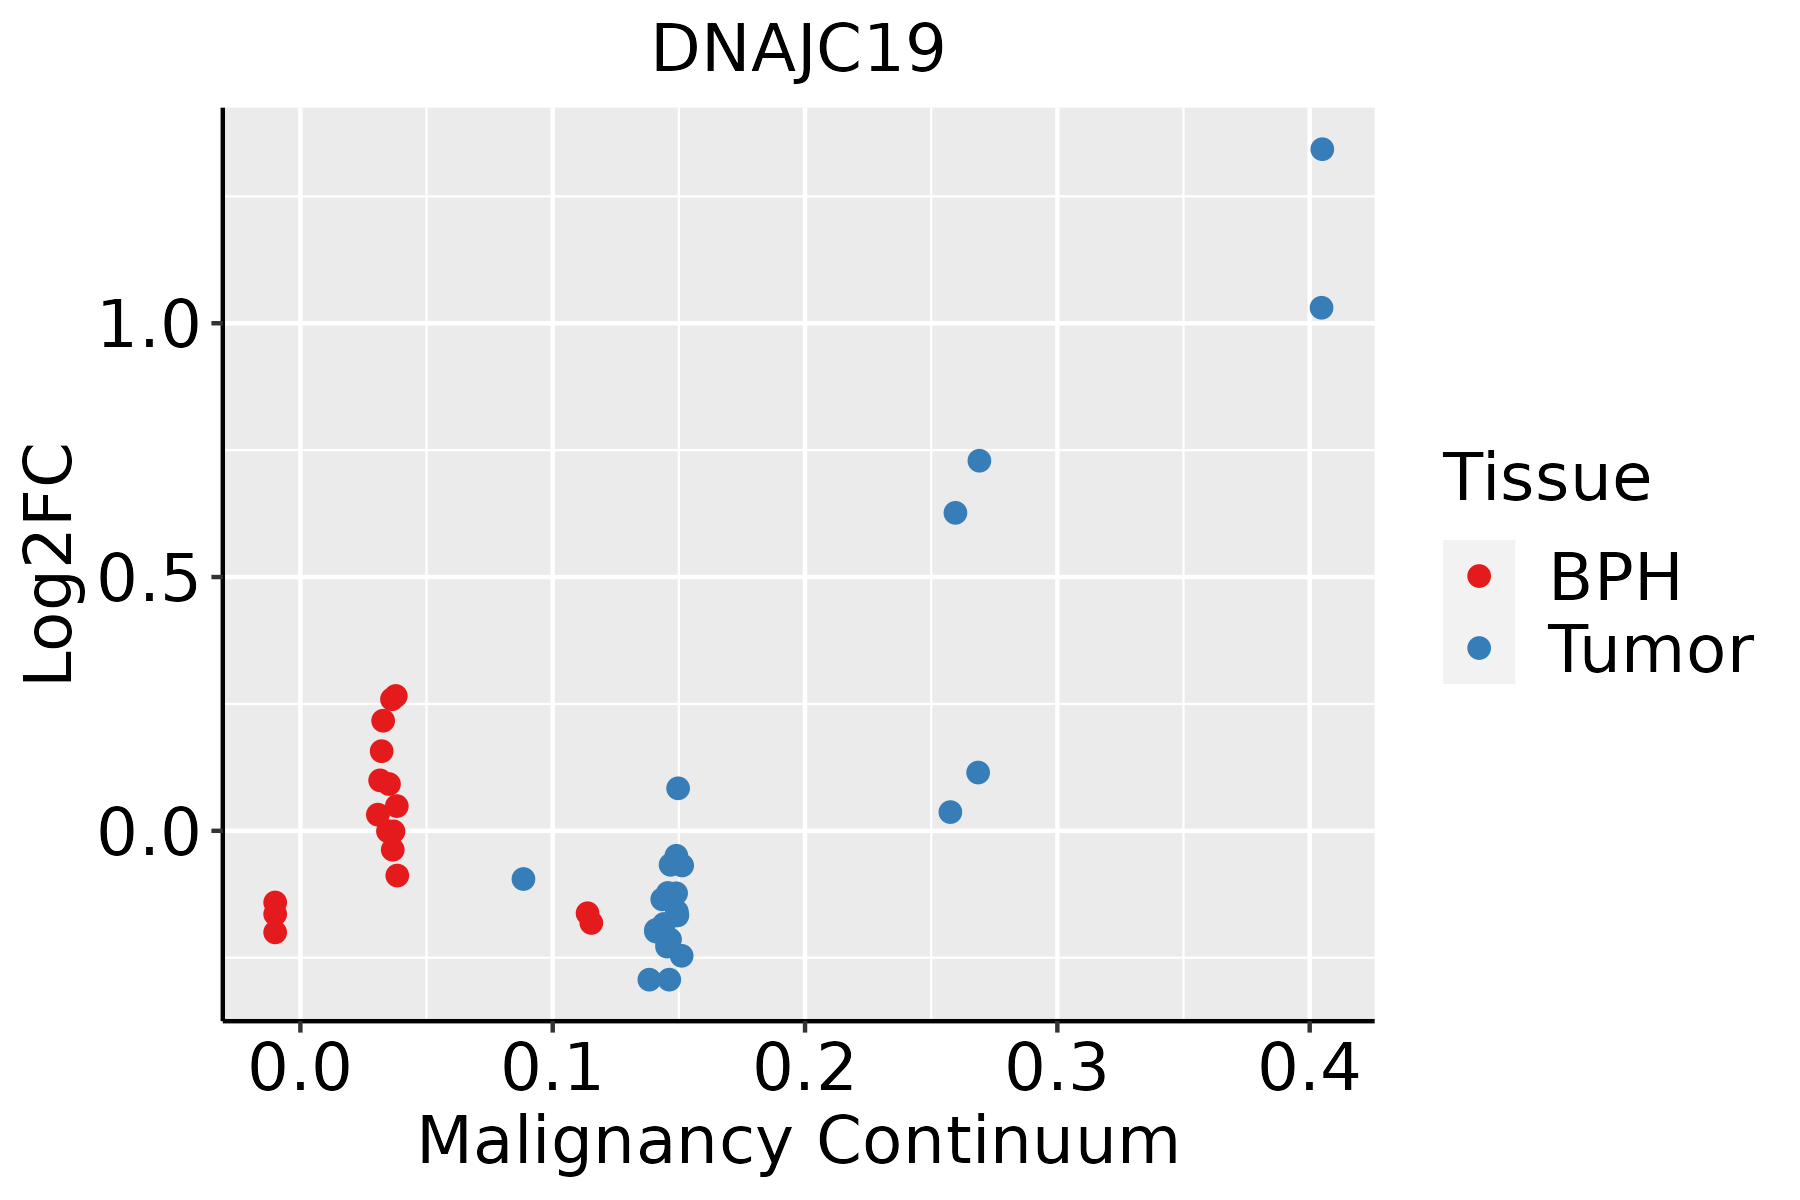 | BPH: Benign Prostatic Hyperplasia |
| Skin |  | AK: Actinic keratosis |
| cSCC: Cutaneous squamous cell carcinoma | ||
| SCCIS:squamous cell carcinoma in situ | ||
| Thyroid |  | ATC: Anaplastic thyroid cancer |
| HT: Hashimoto's thyroiditis | ||
| PTC: Papillary thyroid cancer |
| ∗log2FC in expression of this searched gene in stem-like cells from each diseased tissue sample relative to stem-like cells in normal samples in each tissue plotted against the malignancy continuum. Samples are colored based on if they are from different disease stage. |
Top |
Malignant transformation related pathway analysis |
| Find out the enriched GO biological processes and KEGG pathways involved in transition from healthy to precancer to cancer |
| Tissue | Disease Stage | Enriched GO biological Processes |
| Colorectum | AD |  |
| Colorectum | SER |  |
| Colorectum | MSS |  |
| Colorectum | MSI-H |  |
| Colorectum | FAP |  |
| ∗Top 15 enriched GO BP terms are showed in the bar plot of each disease state in each tissue. Each row represents a significant GO biological process which is colored according to the -log10(p.adjust). |
| Page: 1 2 3 4 5 6 7 8 9 |
| GO ID | Tissue | Disease Stage | Description | Gene Ratio | Bg Ratio | pvalue | p.adjust | Count |
| GO:0072594110 | Esophagus | ESCC | establishment of protein localization to organelle | 311/8552 | 422/18723 | 3.02e-32 | 2.13e-29 | 311 |
| GO:0006605111 | Esophagus | ESCC | protein targeting | 229/8552 | 314/18723 | 4.93e-23 | 1.01e-20 | 229 |
| GO:0006457110 | Esophagus | ESCC | protein folding | 163/8552 | 212/18723 | 1.13e-20 | 1.74e-18 | 163 |
| GO:0006839110 | Esophagus | ESCC | mitochondrial transport | 187/8552 | 254/18723 | 8.35e-20 | 9.81e-18 | 187 |
| GO:0072655110 | Esophagus | ESCC | establishment of protein localization to mitochondrion | 97/8552 | 120/18723 | 2.17e-15 | 1.33e-13 | 97 |
| GO:0070585110 | Esophagus | ESCC | protein localization to mitochondrion | 100/8552 | 125/18723 | 2.96e-15 | 1.77e-13 | 100 |
| GO:001703818 | Esophagus | ESCC | protein import | 149/8552 | 206/18723 | 5.90e-15 | 3.31e-13 | 149 |
| GO:0006626110 | Esophagus | ESCC | protein targeting to mitochondrion | 81/8552 | 100/18723 | 3.60e-13 | 1.67e-11 | 81 |
| GO:00718069 | Esophagus | ESCC | protein transmembrane transport | 47/8552 | 59/18723 | 9.02e-08 | 1.51e-06 | 47 |
| GO:0061458110 | Esophagus | ESCC | reproductive system development | 247/8552 | 427/18723 | 2.24e-07 | 3.42e-06 | 247 |
| GO:004860818 | Esophagus | ESCC | reproductive structure development | 245/8552 | 424/18723 | 2.82e-07 | 4.14e-06 | 245 |
| GO:1990542110 | Esophagus | ESCC | mitochondrial transmembrane transport | 72/8552 | 102/18723 | 2.94e-07 | 4.23e-06 | 72 |
| GO:00650026 | Esophagus | ESCC | intracellular protein transmembrane transport | 40/8552 | 51/18723 | 1.76e-06 | 2.08e-05 | 40 |
| GO:00066446 | Esophagus | ESCC | phospholipid metabolic process | 218/8552 | 383/18723 | 5.37e-06 | 5.59e-05 | 218 |
| GO:00447433 | Esophagus | ESCC | protein transmembrane import into intracellular organelle | 29/8552 | 36/18723 | 1.91e-05 | 1.67e-04 | 29 |
| GO:00066505 | Esophagus | ESCC | glycerophospholipid metabolic process | 174/8552 | 306/18723 | 4.92e-05 | 3.85e-04 | 174 |
| GO:00464864 | Esophagus | ESCC | glycerolipid metabolic process | 211/8552 | 392/18723 | 6.51e-04 | 3.46e-03 | 211 |
| GO:00301503 | Esophagus | ESCC | protein import into mitochondrial matrix | 16/8552 | 20/18723 | 1.85e-03 | 8.40e-03 | 16 |
| GO:00192168 | Esophagus | ESCC | regulation of lipid metabolic process | 172/8552 | 331/18723 | 1.20e-02 | 4.02e-02 | 172 |
| GO:00064577 | Liver | Cirrhotic | protein folding | 114/4634 | 212/18723 | 9.23e-20 | 2.31e-17 | 114 |
| Page: 1 2 3 4 5 6 7 8 9 |
| Pathway ID | Tissue | Disease Stage | Description | Gene Ratio | Bg Ratio | pvalue | p.adjust | qvalue | Count |
| Page: 1 |
Top |
Cell-cell communication analysis |
| Identification of potential cell-cell interactions between two cell types and their ligand-receptor pairs for different disease states |
| Ligand | Receptor | LRpair | Pathway | Tissue | Disease Stage |
| Page: 1 |
Top |
Single-cell gene regulatory network inference analysis |
| Find out the significant the regulons (TFs) and the target genes of each regulon across cell types for different disease states |
| TF | Cell Type | Tissue | Disease Stage | Target Gene | RSS | Regulon Activity |
| ∗The dot plots of a searched regulon are shown for all cell subpopulations in each disease state of each tissue based on the regulon specific score inferred using pySCENIC and by calculating the average expression. |
| Page: 1 |
Top |
Somatic mutation of malignant transformation related genes |
| Annotation of somatic variants for genes involved in malignant transformation |
| Hugo Symbol | Variant Class | Variant Classification | dbSNP RS | HGVSc | HGVSp | HGVSp Short | SWISSPROT | BIOTYPE | SIFT | PolyPhen | Tumor Sample Barcode | Tissue | Histology | Sex | Age | Stage | Therapy Types | Drugs | Outcome |
| DNAJC19 | SNV | Missense_Mutation | novel | c.70N>A | p.Gln24Lys | p.Q24K | Q96DA6 | protein_coding | tolerated(0.21) | benign(0.06) | TCGA-A2-A1FW-01 | Breast | breast invasive carcinoma | Female | <65 | III/IV | Chemotherapy | cytoxan | SD |
| DNAJC19 | SNV | Missense_Mutation | rs199774384 | c.251N>A | p.Arg84Gln | p.R84Q | Q96DA6 | protein_coding | tolerated(0.1) | benign(0.012) | TCGA-AN-A046-01 | Breast | breast invasive carcinoma | Female | >=65 | I/II | Unknown | Unknown | SD |
| DNAJC19 | SNV | Missense_Mutation | novel | c.220N>T | p.Asn74Tyr | p.N74Y | Q96DA6 | protein_coding | deleterious(0.01) | possibly_damaging(0.831) | TCGA-C5-A7X5-01 | Cervix | cervical & endocervical cancer | Female | >=65 | I/II | Chemotherapy | carboplatin | PD |
| DNAJC19 | SNV | Missense_Mutation | c.119N>C | p.Leu40Pro | p.L40P | Q96DA6 | protein_coding | deleterious(0) | possibly_damaging(0.819) | TCGA-AA-3710-01 | Colorectum | colon adenocarcinoma | Female | >=65 | I/II | Unknown | Unknown | SD | |
| DNAJC19 | SNV | Missense_Mutation | novel | c.301N>A | p.Ala101Thr | p.A101T | Q96DA6 | protein_coding | tolerated(0.53) | benign(0.072) | TCGA-AA-3984-01 | Colorectum | colon adenocarcinoma | Female | <65 | I/II | Unknown | Unknown | SD |
| DNAJC19 | SNV | Missense_Mutation | rs199774384 | c.251N>A | p.Arg84Gln | p.R84Q | Q96DA6 | protein_coding | tolerated(0.1) | benign(0.012) | TCGA-EI-6917-01 | Colorectum | rectum adenocarcinoma | Male | <65 | III/IV | Chemotherapy | 5fluorouracil+oxaciplatina+l-folinian | SD |
| DNAJC19 | deletion | Frame_Shift_Del | c.348delN | p.Lys116AsnfsTer6 | p.K116Nfs*6 | Q96DA6 | protein_coding | TCGA-AZ-6598-01 | Colorectum | colon adenocarcinoma | Female | >=65 | I/II | Unknown | Unknown | SD | |||
| DNAJC19 | SNV | Missense_Mutation | novel | c.198A>G | p.Ile66Met | p.I66M | Q96DA6 | protein_coding | deleterious(0) | possibly_damaging(0.715) | TCGA-AX-A06F-01 | Endometrium | uterine corpus endometrioid carcinoma | Female | <65 | III/IV | Chemotherapy | carboplatin | SD |
| DNAJC19 | SNV | Missense_Mutation | rs750384728 | c.58C>T | p.Arg20Cys | p.R20C | Q96DA6 | protein_coding | deleterious(0.01) | benign(0) | TCGA-B5-A3FC-01 | Endometrium | uterine corpus endometrioid carcinoma | Female | <65 | I/II | Unknown | Unknown | SD |
| DNAJC19 | SNV | Missense_Mutation | rs199774384 | c.251G>A | p.Arg84Gln | p.R84Q | Q96DA6 | protein_coding | tolerated(0.1) | benign(0.012) | TCGA-E6-A1LX-01 | Endometrium | uterine corpus endometrioid carcinoma | Female | <65 | I/II | Unknown | Unknown | SD |
| Page: 1 2 |
Top |
Related drugs of malignant transformation related genes |
| Identification of chemicals and drugs interact with genes involved in malignant transfromation |
| (DGIdb 4.0) |
| Entrez ID | Symbol | Category | Interaction Types | Drug Claim Name | Drug Name | PMIDs |
| Page: 1 |

Copyright 2023-Present -The University of Texas Health Science Center at Houston |