
|
|||||
|
 | |
| |
| |
| |
| |
| |
|
Gene: DLX5 |
Gene summary for DLX5 |
| Gene information | Species | Human | Gene symbol | DLX5 | Gene ID | 1749 |
| Gene name | distal-less homeobox 5 | |
| Gene Alias | SHFM1 | |
| Cytomap | 7q21.3 | |
| Gene Type | protein-coding | GO ID | GO:0000902 | UniProtAcc | P56178 |
Top |
Malignant transformation analysis |
| Identification of the aberrant gene expression in precancerous and cancerous lesions by comparing the gene expression of stem-like cells in diseased tissues with normal stem cells |
| Entrez ID | Symbol | Replicates | Species | Organ | Tissue | Adj P-value | Log2FC | Malignancy |
| 1749 | DLX5 | P62T-E | Human | Esophagus | ESCC | 1.99e-10 | 3.07e-01 | 0.1302 |
| 1749 | DLX5 | P65T-E | Human | Esophagus | ESCC | 1.93e-06 | 2.65e-01 | 0.0978 |
| 1749 | DLX5 | P74T-E | Human | Esophagus | ESCC | 2.89e-33 | 1.32e+00 | 0.1479 |
| 1749 | DLX5 | P76T-E | Human | Esophagus | ESCC | 1.53e-19 | 5.22e-01 | 0.1207 |
| 1749 | DLX5 | P79T-E | Human | Esophagus | ESCC | 3.19e-23 | 4.83e-01 | 0.1154 |
| 1749 | DLX5 | P80T-E | Human | Esophagus | ESCC | 4.24e-04 | 2.73e-01 | 0.155 |
| 1749 | DLX5 | P84T-E | Human | Esophagus | ESCC | 8.29e-08 | 8.06e-01 | 0.0933 |
| 1749 | DLX5 | P89T-E | Human | Esophagus | ESCC | 2.13e-03 | 4.73e-01 | 0.1752 |
| 1749 | DLX5 | P107T-E | Human | Esophagus | ESCC | 2.94e-05 | 3.19e-01 | 0.171 |
| 1749 | DLX5 | P127T-E | Human | Esophagus | ESCC | 3.35e-03 | 1.73e-01 | 0.0826 |
| 1749 | DLX5 | P128T-E | Human | Esophagus | ESCC | 5.69e-03 | 3.34e-01 | 0.1241 |
| 1749 | DLX5 | P130T-E | Human | Esophagus | ESCC | 3.75e-03 | 1.47e-01 | 0.1676 |
| 1749 | DLX5 | C38 | Human | Oral cavity | OSCC | 1.63e-09 | 1.06e+00 | 0.172 |
| 1749 | DLX5 | C43 | Human | Oral cavity | OSCC | 2.40e-13 | 4.00e-01 | 0.1704 |
| 1749 | DLX5 | C46 | Human | Oral cavity | OSCC | 4.16e-05 | 2.36e-01 | 0.1673 |
| 1749 | DLX5 | C08 | Human | Oral cavity | OSCC | 1.19e-08 | 4.28e-01 | 0.1919 |
| 1749 | DLX5 | LN38 | Human | Oral cavity | OSCC | 1.34e-03 | 9.83e-01 | 0.168 |
| 1749 | DLX5 | LN46 | Human | Oral cavity | OSCC | 1.39e-06 | 4.25e-01 | 0.1666 |
| 1749 | DLX5 | SYSMH1 | Human | Oral cavity | OSCC | 5.37e-08 | 4.18e-01 | 0.1127 |
| 1749 | DLX5 | ATC13 | Human | Thyroid | ATC | 1.88e-57 | 1.16e+00 | 0.34 |
| Page: 1 2 3 4 |
| Tissue | Expression Dynamics | Abbreviation |
| Esophagus | 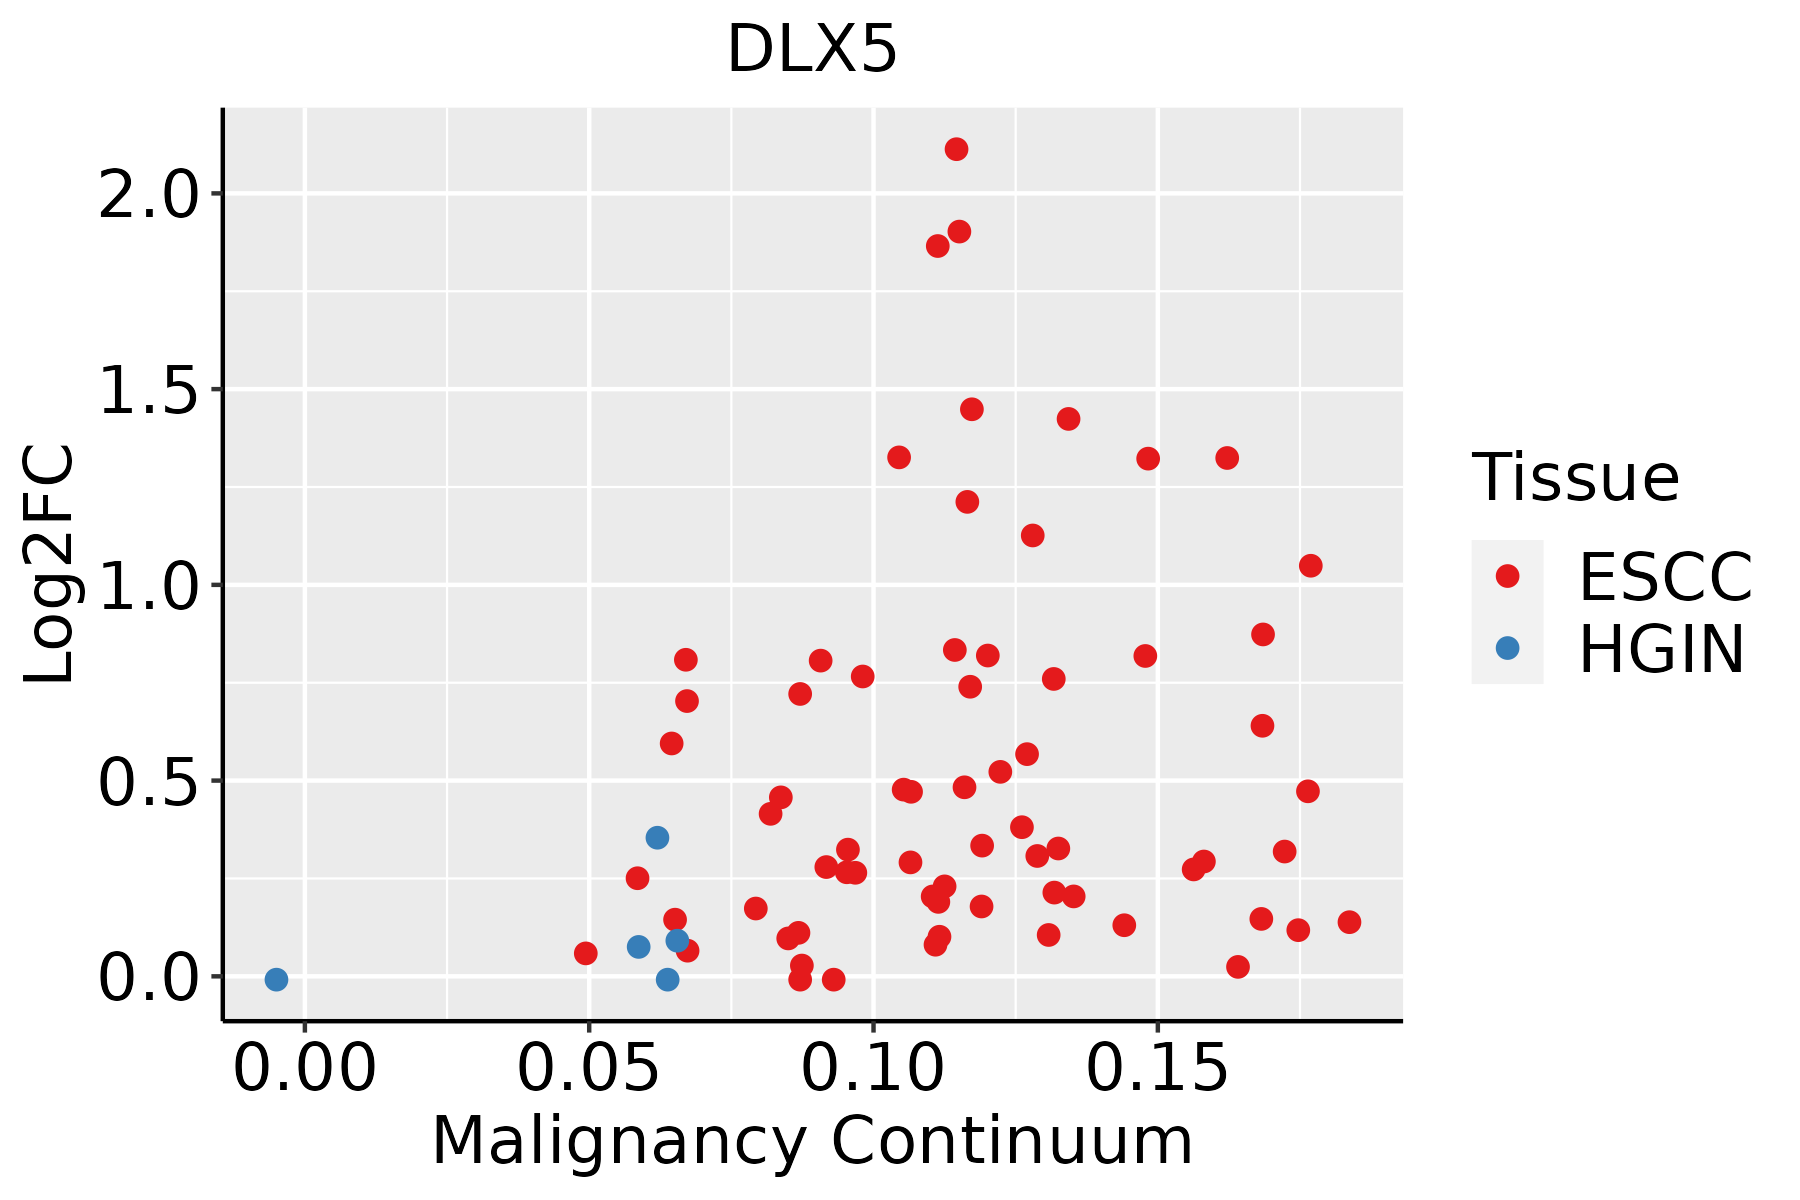 | ESCC: Esophageal squamous cell carcinoma |
| HGIN: High-grade intraepithelial neoplasias | ||
| LGIN: Low-grade intraepithelial neoplasias | ||
| Oral Cavity | 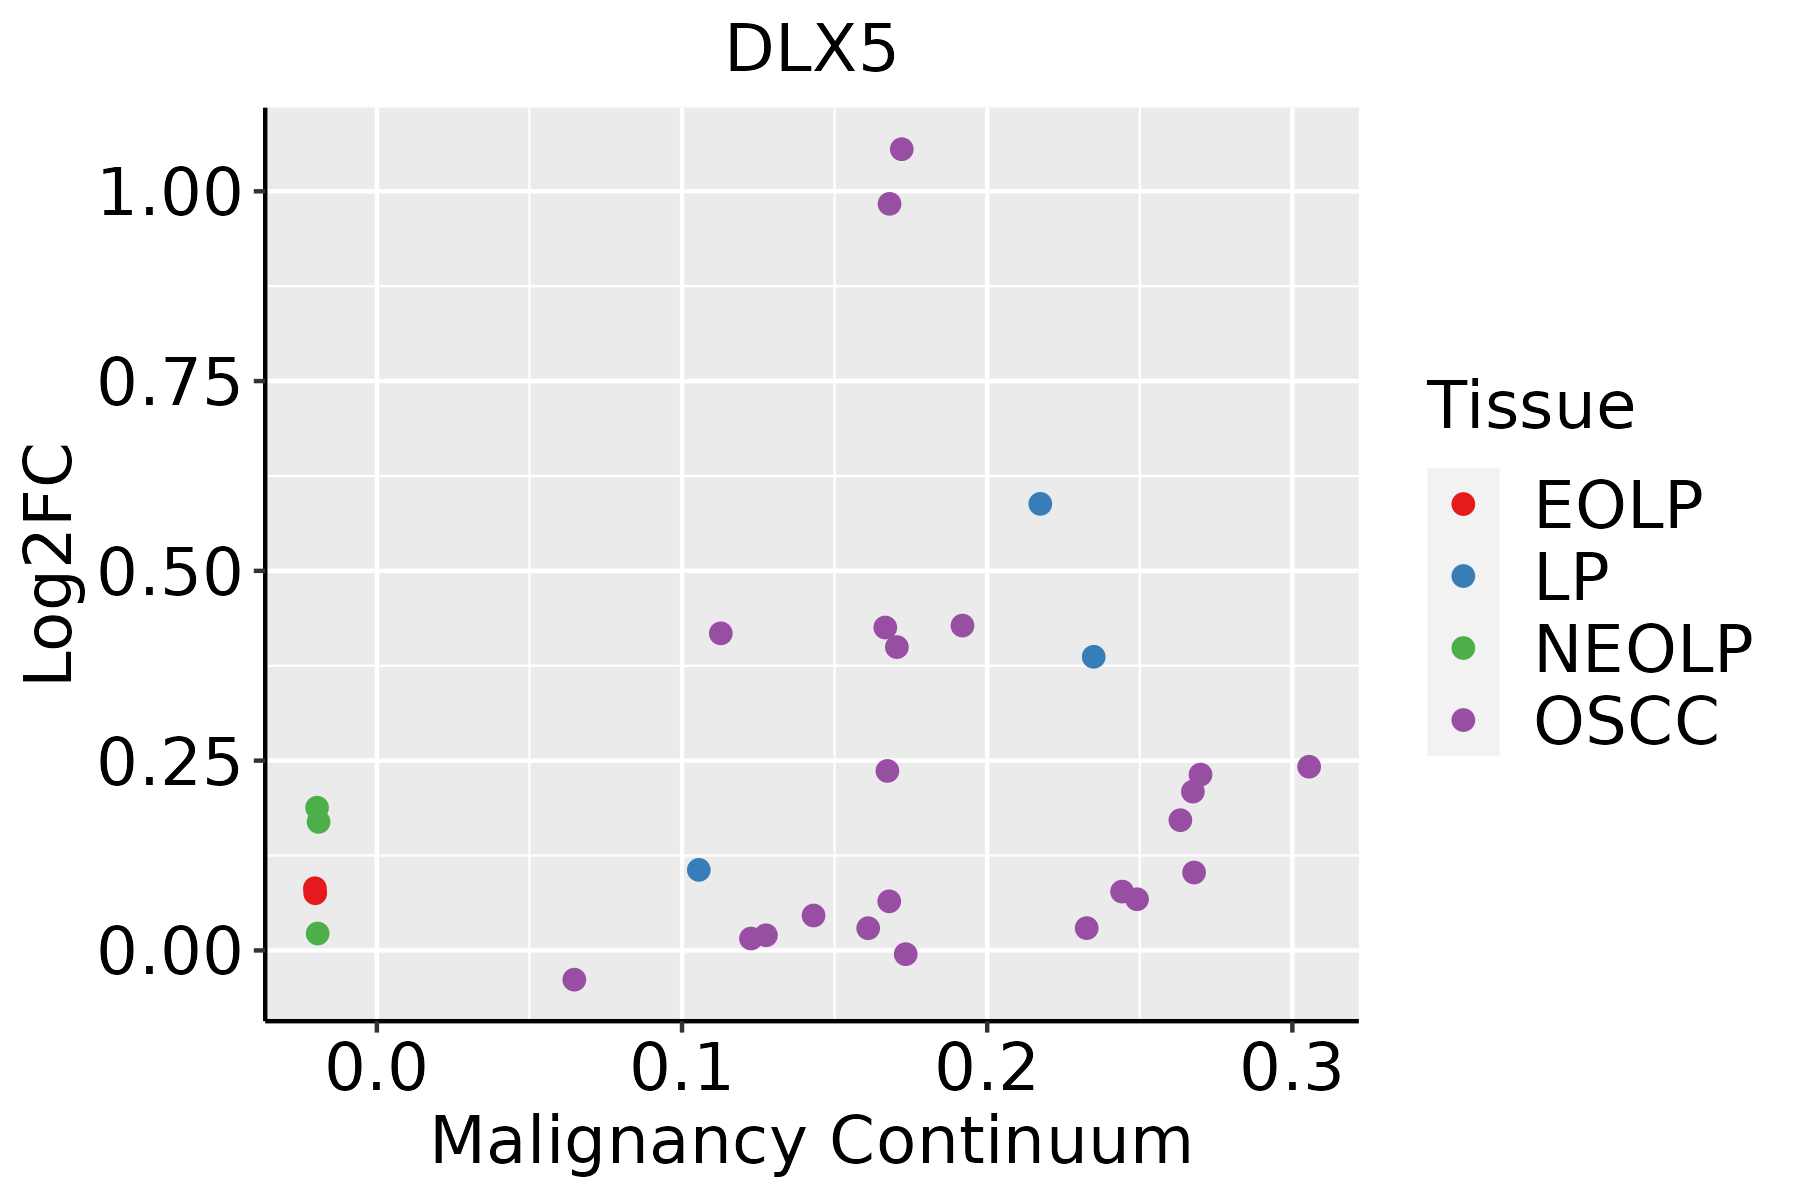 | EOLP: Erosive Oral lichen planus |
| LP: leukoplakia | ||
| NEOLP: Non-erosive oral lichen planus | ||
| OSCC: Oral squamous cell carcinoma | ||
| Thyroid | 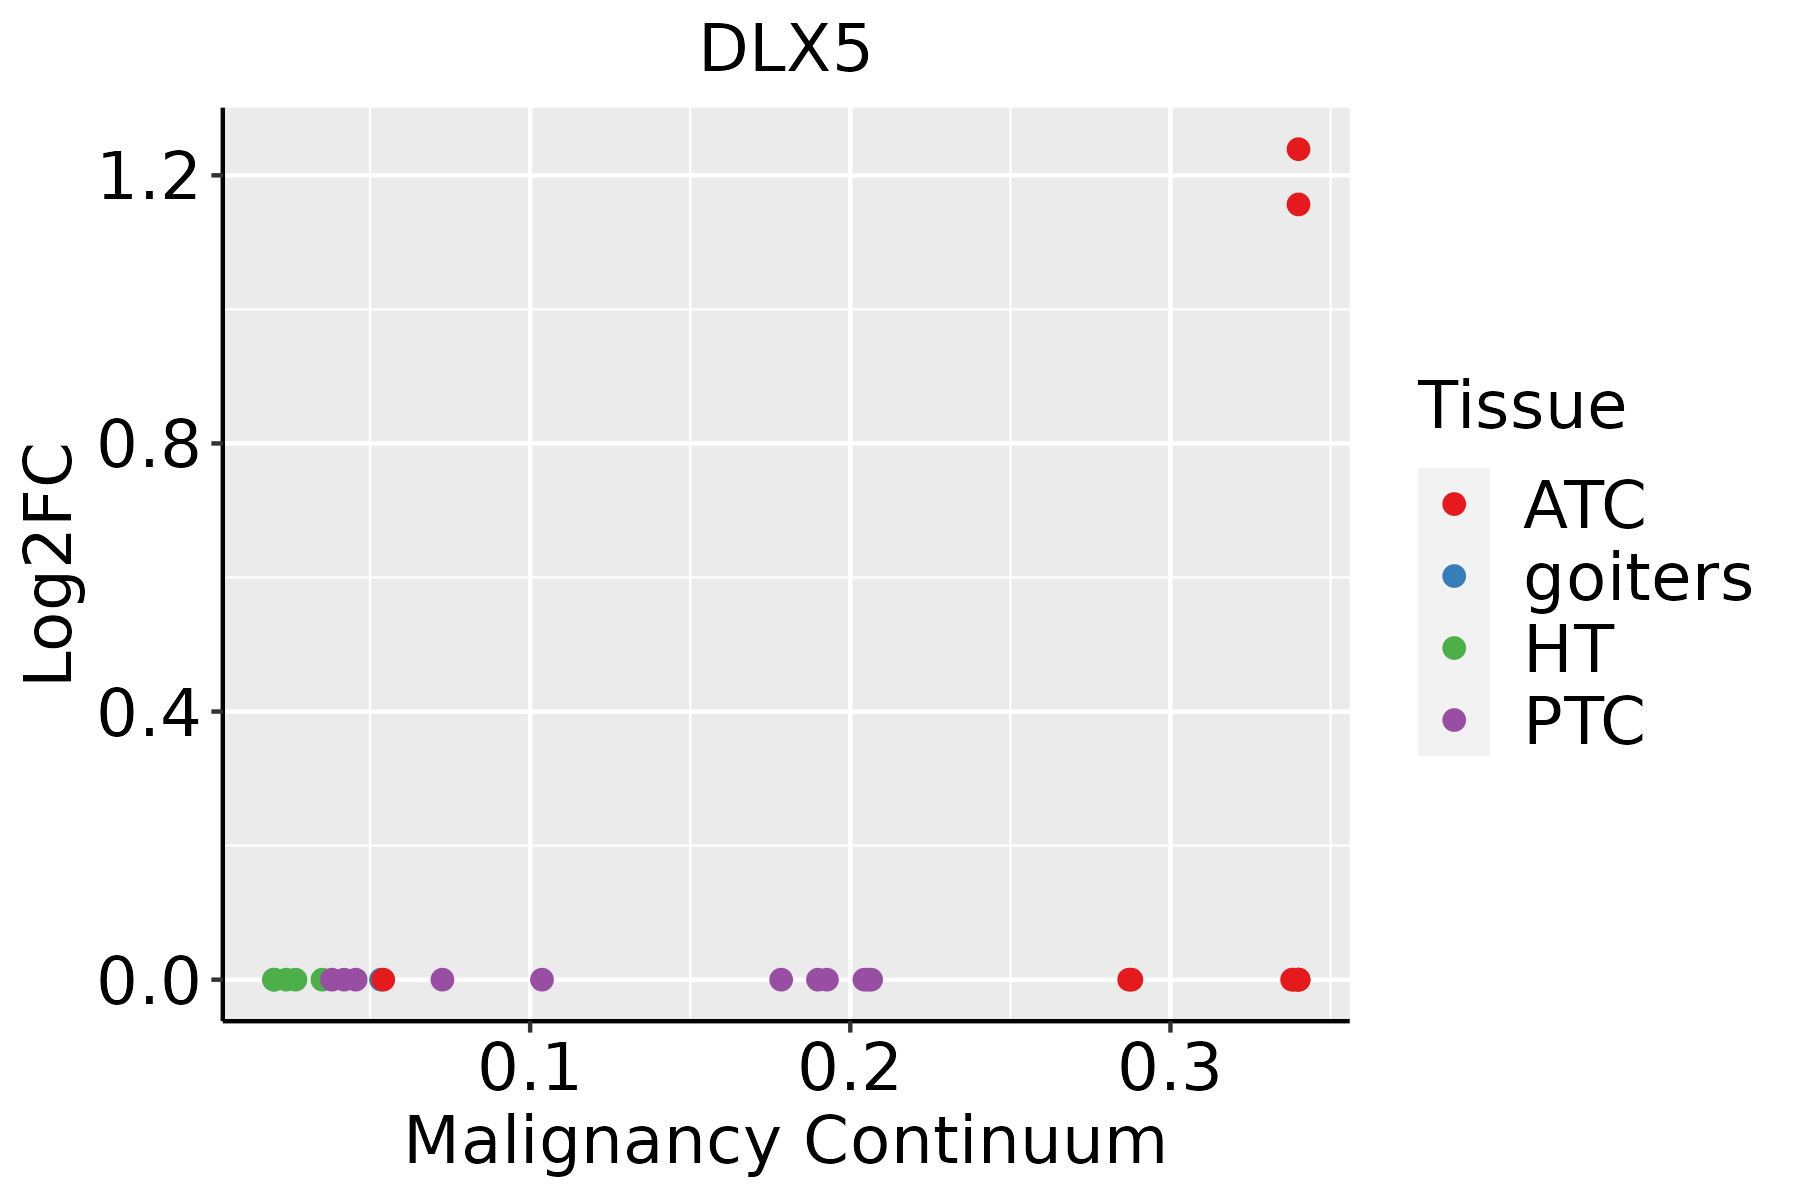 | ATC: Anaplastic thyroid cancer |
| HT: Hashimoto's thyroiditis | ||
| PTC: Papillary thyroid cancer |
| ∗log2FC in expression of this searched gene in stem-like cells from each diseased tissue sample relative to stem-like cells in normal samples in each tissue plotted against the malignancy continuum. Samples are colored based on if they are from different disease stage. |
Top |
Malignant transformation related pathway analysis |
| Find out the enriched GO biological processes and KEGG pathways involved in transition from healthy to precancer to cancer |
| Tissue | Disease Stage | Enriched GO biological Processes |
| Colorectum | AD |  |
| Colorectum | SER |  |
| Colorectum | MSS |  |
| Colorectum | MSI-H |  |
| Colorectum | FAP |  |
| ∗Top 15 enriched GO BP terms are showed in the bar plot of each disease state in each tissue. Each row represents a significant GO biological process which is colored according to the -log10(p.adjust). |
| Page: 1 2 3 4 5 6 7 8 9 |
| GO ID | Tissue | Disease Stage | Description | Gene Ratio | Bg Ratio | pvalue | p.adjust | Count |
| GO:000164917 | Esophagus | HGIN | osteoblast differentiation | 50/2587 | 229/18723 | 5.88e-04 | 8.30e-03 | 50 |
| GO:003011116 | Esophagus | HGIN | regulation of Wnt signaling pathway | 65/2587 | 328/18723 | 1.53e-03 | 1.77e-02 | 65 |
| GO:009026310 | Esophagus | HGIN | positive regulation of canonical Wnt signaling pathway | 26/2587 | 106/18723 | 2.17e-03 | 2.25e-02 | 26 |
| GO:001605516 | Esophagus | HGIN | Wnt signaling pathway | 83/2587 | 444/18723 | 2.27e-03 | 2.33e-02 | 83 |
| GO:019873816 | Esophagus | HGIN | cell-cell signaling by wnt | 83/2587 | 446/18723 | 2.58e-03 | 2.55e-02 | 83 |
| GO:003017710 | Esophagus | HGIN | positive regulation of Wnt signaling pathway | 31/2587 | 140/18723 | 4.77e-03 | 4.09e-02 | 31 |
| GO:006082816 | Esophagus | HGIN | regulation of canonical Wnt signaling pathway | 50/2587 | 253/18723 | 5.27e-03 | 4.35e-02 | 50 |
| GO:000150316 | Esophagus | HGIN | ossification | 75/2587 | 408/18723 | 5.49e-03 | 4.49e-02 | 75 |
| GO:001605517 | Esophagus | ESCC | Wnt signaling pathway | 268/8552 | 444/18723 | 2.32e-10 | 6.58e-09 | 268 |
| GO:019873817 | Esophagus | ESCC | cell-cell signaling by wnt | 269/8552 | 446/18723 | 2.41e-10 | 6.79e-09 | 269 |
| GO:003011117 | Esophagus | ESCC | regulation of Wnt signaling pathway | 194/8552 | 328/18723 | 5.39e-07 | 7.14e-06 | 194 |
| GO:006007016 | Esophagus | ESCC | canonical Wnt signaling pathway | 180/8552 | 303/18723 | 9.15e-07 | 1.17e-05 | 180 |
| GO:006082817 | Esophagus | ESCC | regulation of canonical Wnt signaling pathway | 153/8552 | 253/18723 | 1.38e-06 | 1.67e-05 | 153 |
| GO:000164918 | Esophagus | ESCC | osteoblast differentiation | 140/8552 | 229/18723 | 1.63e-06 | 1.95e-05 | 140 |
| GO:000150317 | Esophagus | ESCC | ossification | 232/8552 | 408/18723 | 3.00e-06 | 3.40e-05 | 232 |
| GO:00605417 | Esophagus | ESCC | respiratory system development | 123/8552 | 203/18723 | 1.26e-05 | 1.15e-04 | 123 |
| GO:00603242 | Esophagus | ESCC | face development | 34/8552 | 44/18723 | 1.90e-05 | 1.67e-04 | 34 |
| GO:009026316 | Esophagus | ESCC | positive regulation of canonical Wnt signaling pathway | 69/8552 | 106/18723 | 4.22e-05 | 3.39e-04 | 69 |
| GO:003017716 | Esophagus | ESCC | positive regulation of Wnt signaling pathway | 87/8552 | 140/18723 | 6.18e-05 | 4.73e-04 | 87 |
| GO:005067318 | Esophagus | ESCC | epithelial cell proliferation | 238/8552 | 437/18723 | 1.19e-04 | 8.20e-04 | 238 |
| Page: 1 2 3 4 5 |
| Pathway ID | Tissue | Disease Stage | Description | Gene Ratio | Bg Ratio | pvalue | p.adjust | qvalue | Count |
| Page: 1 |
Top |
Cell-cell communication analysis |
| Identification of potential cell-cell interactions between two cell types and their ligand-receptor pairs for different disease states |
| Ligand | Receptor | LRpair | Pathway | Tissue | Disease Stage |
| Page: 1 |
Top |
Single-cell gene regulatory network inference analysis |
| Find out the significant the regulons (TFs) and the target genes of each regulon across cell types for different disease states |
| TF | Cell Type | Tissue | Disease Stage | Target Gene | RSS | Regulon Activity |
| DLX5 | MES | Cervix | HSIL_HPV | DSG1,AMTN,KLK8, etc. | 4.57e-01 |  |
| DLX5 | STM | Endometrium | Healthy | MSX1,HLA-B,SH3YL1, etc. | 2.36e-01 |  |
| DLX5 | CILIA | Endometrium | Healthy | MSX1,HLA-B,SH3YL1, etc. | 6.96e-02 | |
| DLX5 | PLA | Endometrium | ADJ | KRT18,MSX1,WFDC2, etc. | 4.80e-02 |  |
| DLX5 | TH1 | Endometrium | ADJ | KRT18,MSX1,WFDC2, etc. | 1.12e-02 | |
| DLX5 | M1MAC | Endometrium | AEH | KRT18,MSX1,WFDC2, etc. | 4.61e-02 |  |
| DLX5 | PLA | Endometrium | AEH | KRT18,MSX1,WFDC2, etc. | 3.07e-02 | |
| DLX5 | M1MAC | Endometrium | EEC | KRT18,MSX1,WFDC2, etc. | 6.86e-02 |  |
| DLX5 | PERI | Esophagus | ADJ | RGS5,ARHGAP15,KCNJ8, etc. | 1.39e-01 |  |
| DLX5 | PERI | Esophagus | ESCC | RGS5,ARHGAP15,KCNJ8, etc. | 4.37e-01 |  |
| ∗The dot plots of a searched regulon are shown for all cell subpopulations in each disease state of each tissue based on the regulon specific score inferred using pySCENIC and by calculating the average expression. |
| Page: 1 2 3 4 |
Top |
Somatic mutation of malignant transformation related genes |
| Annotation of somatic variants for genes involved in malignant transformation |
| Hugo Symbol | Variant Class | Variant Classification | dbSNP RS | HGVSc | HGVSp | HGVSp Short | SWISSPROT | BIOTYPE | SIFT | PolyPhen | Tumor Sample Barcode | Tissue | Histology | Sex | Age | Stage | Therapy Types | Drugs | Outcome |
| DLX5 | SNV | Missense_Mutation | c.590N>C | p.Lys197Thr | p.K197T | P56178 | protein_coding | deleterious(0) | probably_damaging(0.987) | TCGA-BH-A18V-01 | Breast | breast invasive carcinoma | Female | <65 | I/II | Unknown | Unknown | SD | |
| DLX5 | SNV | Missense_Mutation | novel | c.499N>T | p.Arg167Cys | p.R167C | P56178 | protein_coding | deleterious(0) | probably_damaging(1) | TCGA-OL-A66I-01 | Breast | breast invasive carcinoma | Female | <65 | I/II | Chemotherapy | adriamycin | CR |
| DLX5 | SNV | Missense_Mutation | rs773641315 | c.355G>A | p.Glu119Lys | p.E119K | P56178 | protein_coding | tolerated(0.34) | benign(0.341) | TCGA-PE-A5DE-01 | Breast | breast invasive carcinoma | Female | <65 | I/II | Chemotherapy | taxotere | CR |
| DLX5 | SNV | Missense_Mutation | c.546N>C | p.Lys182Asn | p.K182N | P56178 | protein_coding | deleterious(0) | probably_damaging(0.999) | TCGA-AA-A010-01 | Colorectum | colon adenocarcinoma | Female | <65 | I/II | Chemotherapy | folinic | CR | |
| DLX5 | SNV | Missense_Mutation | c.500G>A | p.Arg167His | p.R167H | P56178 | protein_coding | deleterious(0) | probably_damaging(0.999) | TCGA-AD-6548-01 | Colorectum | colon adenocarcinoma | Female | >=65 | I/II | Unknown | Unknown | SD | |
| DLX5 | SNV | Missense_Mutation | novel | c.134C>A | p.Ser45Tyr | p.S45Y | P56178 | protein_coding | deleterious(0.02) | probably_damaging(0.964) | TCGA-CA-6717-01 | Colorectum | colon adenocarcinoma | Male | <65 | I/II | Chemotherapy | oxaliplatin | CR |
| DLX5 | SNV | Missense_Mutation | c.413G>A | p.Arg138His | p.R138H | P56178 | protein_coding | deleterious(0) | probably_damaging(0.999) | TCGA-D5-6930-01 | Colorectum | colon adenocarcinoma | Male | >=65 | I/II | Unknown | Unknown | SD | |
| DLX5 | SNV | Missense_Mutation | novel | c.68C>A | p.Thr23Lys | p.T23K | P56178 | protein_coding | tolerated(0.58) | benign(0.03) | TCGA-G4-6297-01 | Colorectum | colon adenocarcinoma | Female | <65 | III/IV | Chemotherapy | fluorouracil | PD |
| DLX5 | SNV | Missense_Mutation | c.500G>A | p.Arg167His | p.R167H | P56178 | protein_coding | deleterious(0) | probably_damaging(0.999) | TCGA-AG-A002-01 | Colorectum | rectum adenocarcinoma | Male | <65 | I/II | Unknown | Unknown | SD | |
| DLX5 | SNV | Missense_Mutation | c.691N>T | p.Arg231Cys | p.R231C | P56178 | protein_coding | deleterious(0.01) | probably_damaging(0.924) | TCGA-AG-A015-01 | Colorectum | rectum adenocarcinoma | Female | <65 | I/II | Unknown | Unknown | PD |
| Page: 1 2 3 4 5 6 |
Top |
Related drugs of malignant transformation related genes |
| Identification of chemicals and drugs interact with genes involved in malignant transfromation |
| (DGIdb 4.0) |
| Entrez ID | Symbol | Category | Interaction Types | Drug Claim Name | Drug Name | PMIDs |
| Page: 1 |

Copyright 2023-Present -The University of Texas Health Science Center at Houston |