
|
|||||
|
 | |
| |
| |
| |
| |
| |
|
Gene: DDHD1 |
Gene summary for DDHD1 |
| Gene information | Species | Human | Gene symbol | DDHD1 | Gene ID | 80821 |
| Gene name | DDHD domain containing 1 | |
| Gene Alias | PA-PLA1 | |
| Cytomap | 14q22.1 | |
| Gene Type | protein-coding | GO ID | GO:0000266 | UniProtAcc | Q8NEL9 |
Top |
Malignant transformation analysis |
| Identification of the aberrant gene expression in precancerous and cancerous lesions by comparing the gene expression of stem-like cells in diseased tissues with normal stem cells |
| Entrez ID | Symbol | Replicates | Species | Organ | Tissue | Adj P-value | Log2FC | Malignancy |
| 80821 | DDHD1 | P104T-E | Human | Esophagus | ESCC | 7.78e-03 | 1.78e-01 | 0.0931 |
| 80821 | DDHD1 | P107T-E | Human | Esophagus | ESCC | 6.05e-37 | 1.06e+00 | 0.171 |
| 80821 | DDHD1 | P130T-E | Human | Esophagus | ESCC | 7.54e-20 | 4.74e-01 | 0.1676 |
| 80821 | DDHD1 | HCC1_Meng | Human | Liver | HCC | 1.27e-18 | 4.74e-02 | 0.0246 |
| 80821 | DDHD1 | HCC2_Meng | Human | Liver | HCC | 2.25e-06 | 2.49e-02 | 0.0107 |
| 80821 | DDHD1 | HCC1 | Human | Liver | HCC | 1.63e-02 | 2.06e+00 | 0.5336 |
| 80821 | DDHD1 | HCC2 | Human | Liver | HCC | 5.55e-17 | 3.67e+00 | 0.5341 |
| 80821 | DDHD1 | S015 | Human | Liver | HCC | 1.18e-03 | 2.95e-01 | 0.2375 |
| 80821 | DDHD1 | S016 | Human | Liver | HCC | 2.82e-04 | 2.16e-01 | 0.2243 |
| 80821 | DDHD1 | male-WTA | Human | Thyroid | PTC | 1.11e-08 | 5.37e-02 | 0.1037 |
| 80821 | DDHD1 | PTC01 | Human | Thyroid | PTC | 2.63e-09 | 1.12e-01 | 0.1899 |
| 80821 | DDHD1 | PTC04 | Human | Thyroid | PTC | 3.88e-09 | 1.94e-01 | 0.1927 |
| 80821 | DDHD1 | PTC05 | Human | Thyroid | PTC | 6.90e-17 | 5.66e-01 | 0.2065 |
| 80821 | DDHD1 | PTC06 | Human | Thyroid | PTC | 1.12e-14 | 2.71e-01 | 0.2057 |
| 80821 | DDHD1 | PTC07 | Human | Thyroid | PTC | 6.21e-12 | 2.35e-01 | 0.2044 |
| 80821 | DDHD1 | ATC11 | Human | Thyroid | ATC | 7.99e-07 | 6.21e-01 | 0.3386 |
| 80821 | DDHD1 | ATC12 | Human | Thyroid | ATC | 1.50e-19 | 3.49e-01 | 0.34 |
| 80821 | DDHD1 | ATC13 | Human | Thyroid | ATC | 8.32e-41 | 6.34e-01 | 0.34 |
| 80821 | DDHD1 | ATC2 | Human | Thyroid | ATC | 1.06e-06 | 6.78e-01 | 0.34 |
| 80821 | DDHD1 | ATC3 | Human | Thyroid | ATC | 1.13e-11 | 7.10e-01 | 0.338 |
| Page: 1 2 3 4 |
| Tissue | Expression Dynamics | Abbreviation |
| Esophagus | 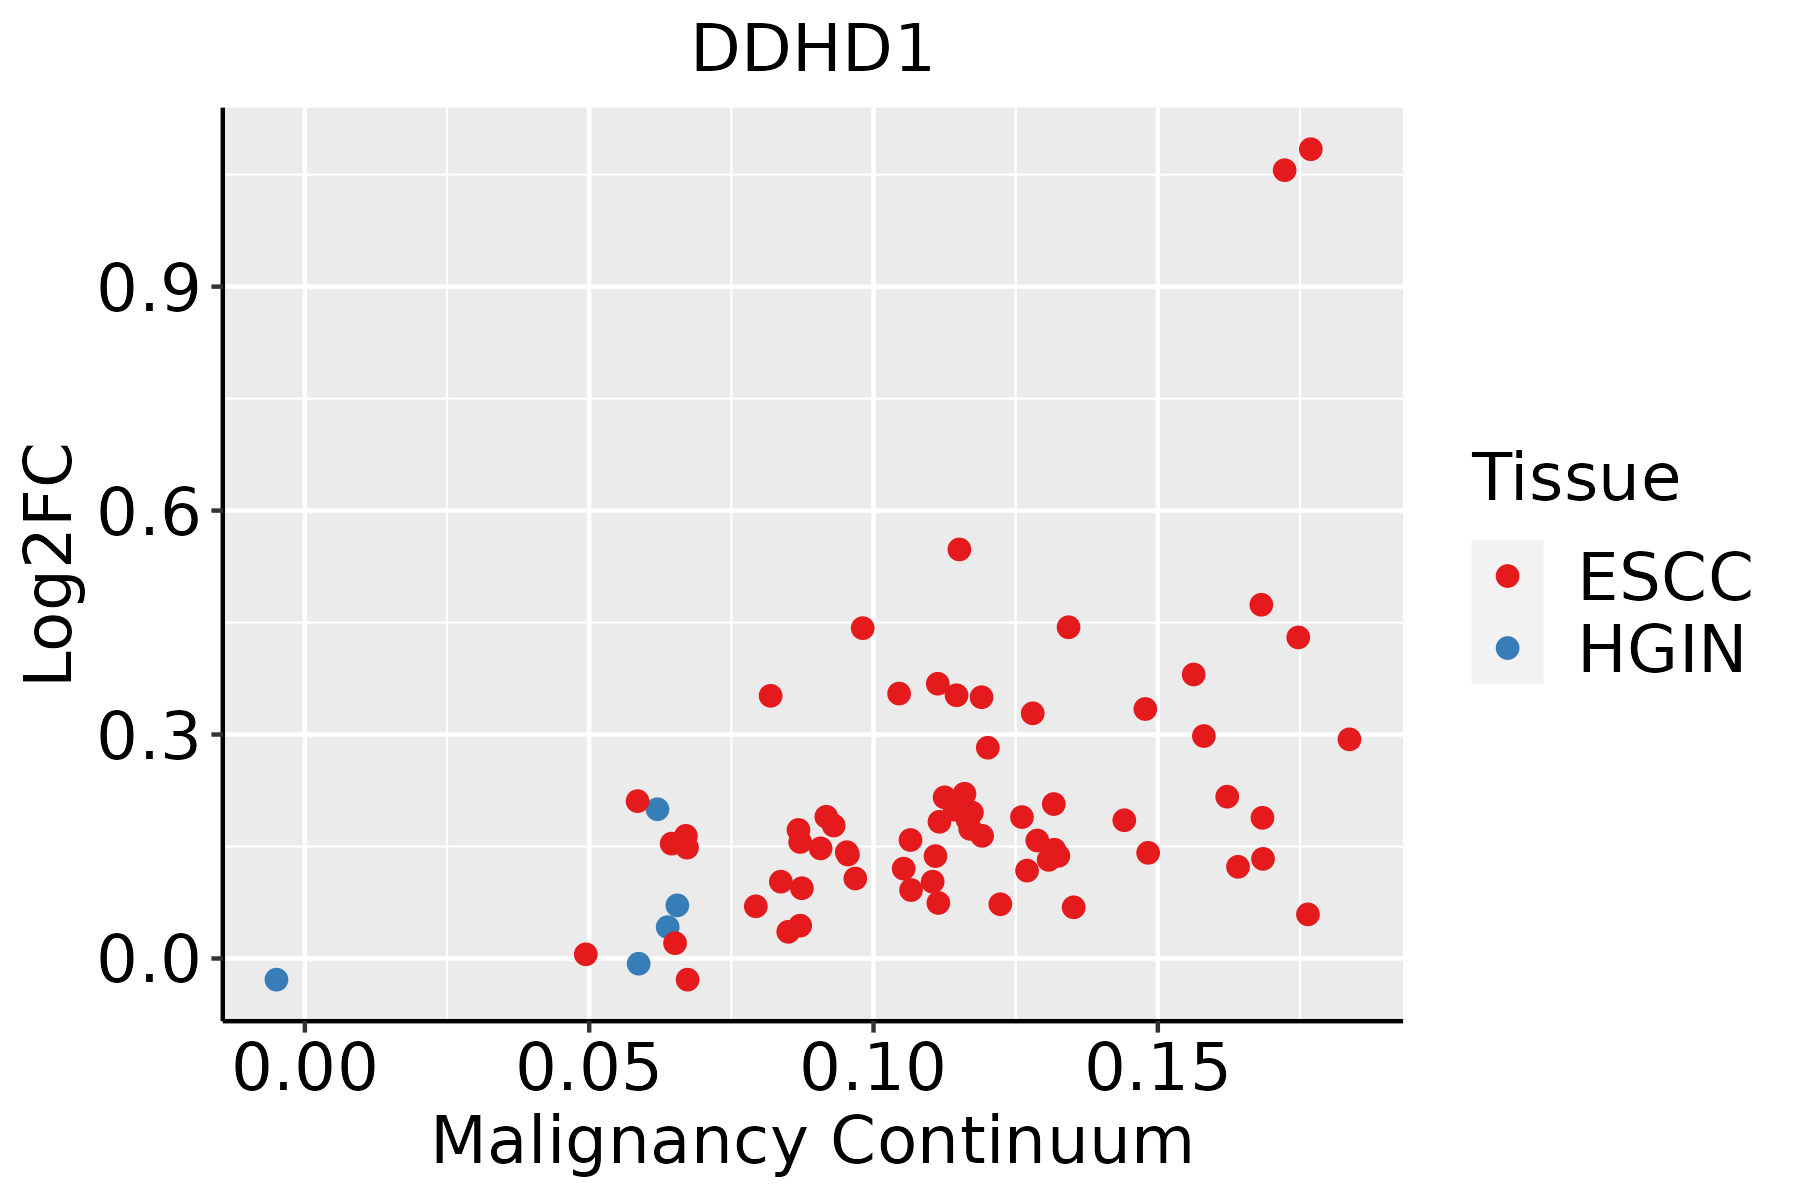 | ESCC: Esophageal squamous cell carcinoma |
| HGIN: High-grade intraepithelial neoplasias | ||
| LGIN: Low-grade intraepithelial neoplasias | ||
| Liver |  | HCC: Hepatocellular carcinoma |
| NAFLD: Non-alcoholic fatty liver disease | ||
| Thyroid | 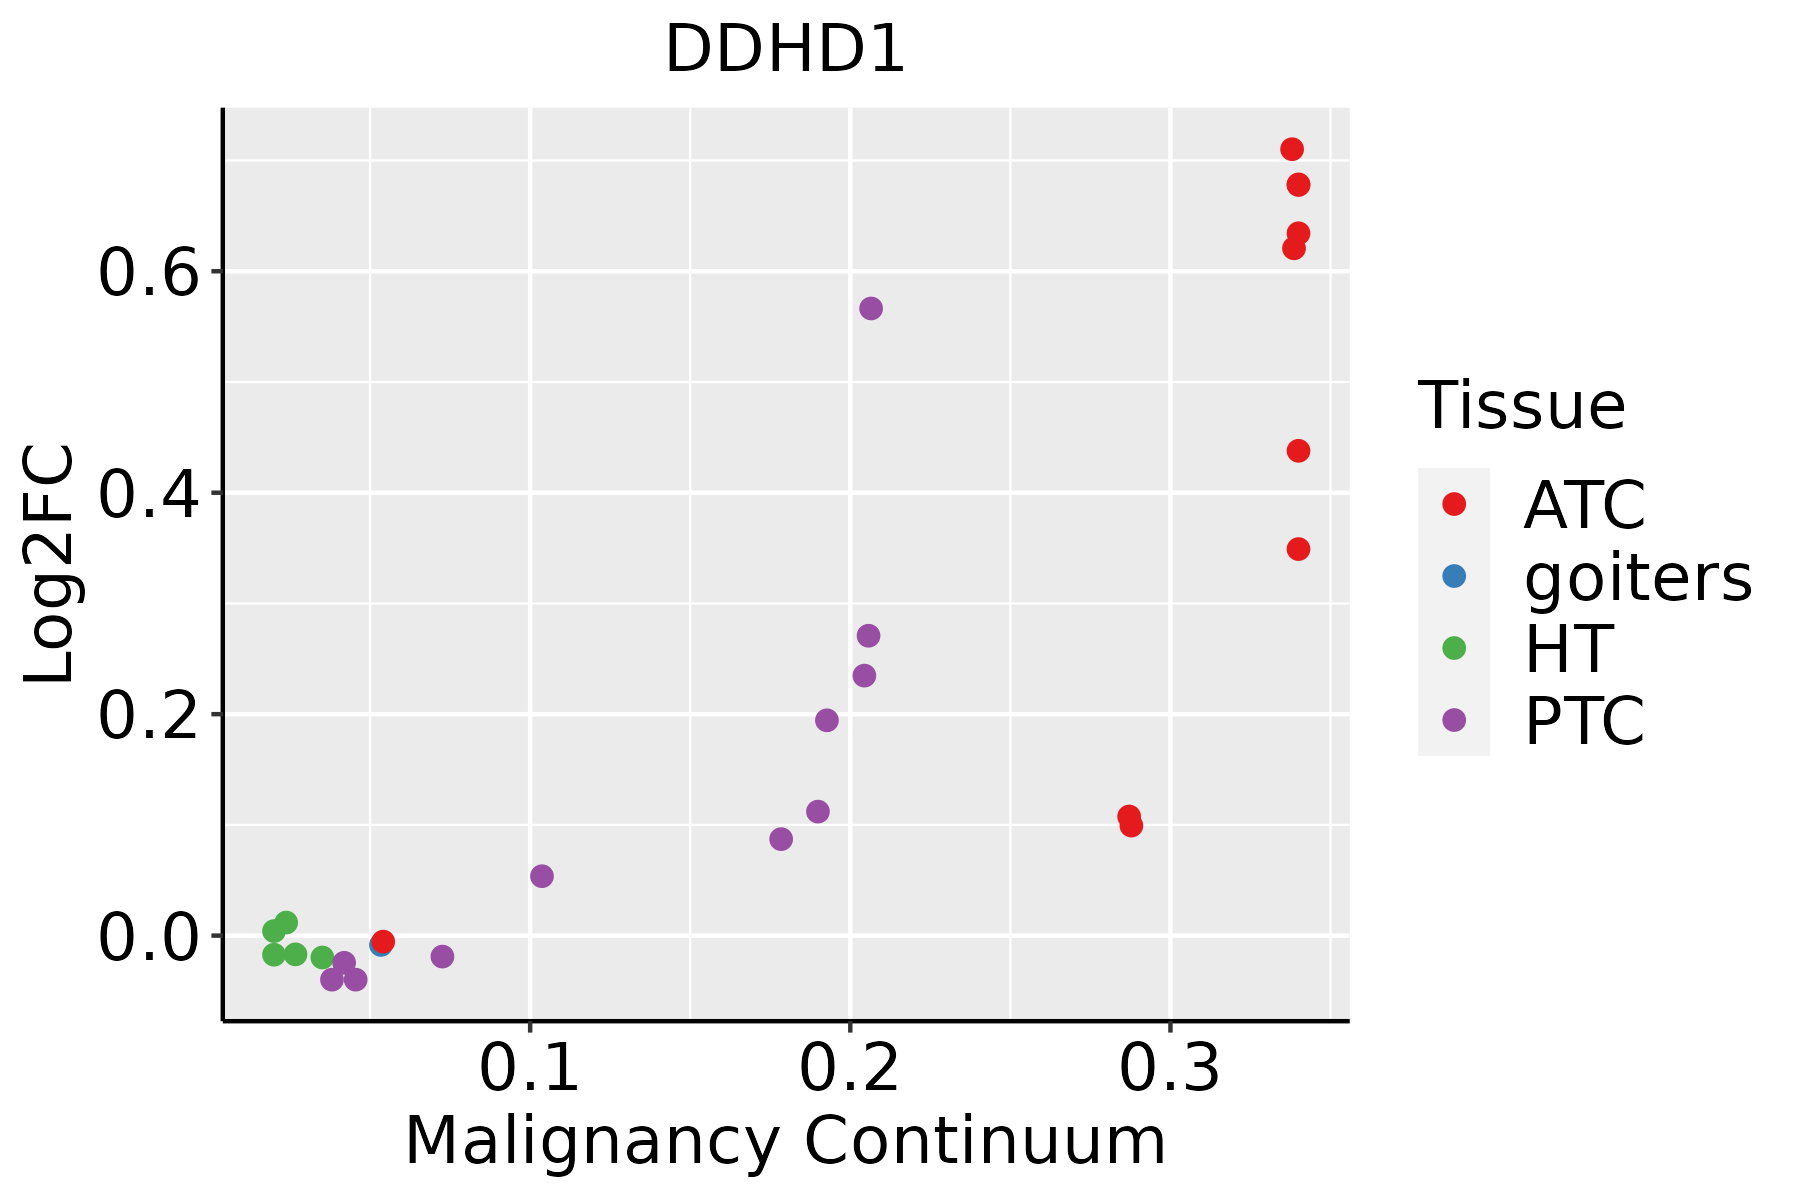 | ATC: Anaplastic thyroid cancer |
| HT: Hashimoto's thyroiditis | ||
| PTC: Papillary thyroid cancer |
| ∗log2FC in expression of this searched gene in stem-like cells from each diseased tissue sample relative to stem-like cells in normal samples in each tissue plotted against the malignancy continuum. Samples are colored based on if they are from different disease stage. |
Top |
Malignant transformation related pathway analysis |
| Find out the enriched GO biological processes and KEGG pathways involved in transition from healthy to precancer to cancer |
| Tissue | Disease Stage | Enriched GO biological Processes |
| Colorectum | AD |  |
| Colorectum | SER |  |
| Colorectum | MSS |  |
| Colorectum | MSI-H |  |
| Colorectum | FAP |  |
| ∗Top 15 enriched GO BP terms are showed in the bar plot of each disease state in each tissue. Each row represents a significant GO biological process which is colored according to the -log10(p.adjust). |
| Page: 1 2 3 4 5 6 7 8 9 |
| GO ID | Tissue | Disease Stage | Description | Gene Ratio | Bg Ratio | pvalue | p.adjust | Count |
| GO:00482853 | Esophagus | ESCC | organelle fission | 301/8552 | 488/18723 | 4.64e-13 | 2.12e-11 | 301 |
| GO:0010821110 | Esophagus | ESCC | regulation of mitochondrion organization | 107/8552 | 144/18723 | 2.31e-12 | 9.41e-11 | 107 |
| GO:001082215 | Esophagus | ESCC | positive regulation of mitochondrion organization | 58/8552 | 74/18723 | 8.55e-09 | 1.73e-07 | 58 |
| GO:00901411 | Esophagus | ESCC | positive regulation of mitochondrial fission | 16/8552 | 21/18723 | 4.47e-03 | 1.76e-02 | 16 |
| GO:00002662 | Esophagus | ESCC | mitochondrial fission | 28/8552 | 42/18723 | 4.90e-03 | 1.89e-02 | 28 |
| GO:00160427 | Esophagus | ESCC | lipid catabolic process | 168/8552 | 320/18723 | 7.97e-03 | 2.84e-02 | 168 |
| GO:001082112 | Liver | HCC | regulation of mitochondrion organization | 96/7958 | 144/18723 | 3.82e-09 | 1.02e-07 | 96 |
| GO:001604221 | Liver | HCC | lipid catabolic process | 175/7958 | 320/18723 | 6.50e-06 | 7.88e-05 | 175 |
| GO:0048285 | Liver | HCC | organelle fission | 254/7958 | 488/18723 | 1.07e-05 | 1.23e-04 | 254 |
| GO:001082211 | Liver | HCC | positive regulation of mitochondrion organization | 48/7958 | 74/18723 | 8.50e-05 | 7.46e-04 | 48 |
| GO:0000266 | Liver | HCC | mitochondrial fission | 28/7958 | 42/18723 | 1.35e-03 | 7.26e-03 | 28 |
| GO:0090140 | Liver | HCC | regulation of mitochondrial fission | 21/7958 | 32/18723 | 7.02e-03 | 2.80e-02 | 21 |
| GO:001082124 | Thyroid | PTC | regulation of mitochondrion organization | 78/5968 | 144/18723 | 2.38e-08 | 5.43e-07 | 78 |
| GO:001082210 | Thyroid | PTC | positive regulation of mitochondrion organization | 40/5968 | 74/18723 | 6.30e-05 | 5.53e-04 | 40 |
| GO:00482855 | Thyroid | PTC | organelle fission | 188/5968 | 488/18723 | 9.64e-04 | 5.77e-03 | 188 |
| GO:00901402 | Thyroid | PTC | regulation of mitochondrial fission | 17/5968 | 32/18723 | 1.02e-02 | 4.11e-02 | 17 |
| GO:004828512 | Thyroid | ATC | organelle fission | 229/6293 | 488/18723 | 4.79e-10 | 1.29e-08 | 229 |
| GO:0010821112 | Thyroid | ATC | regulation of mitochondrion organization | 82/6293 | 144/18723 | 7.15e-09 | 1.54e-07 | 82 |
| GO:001082216 | Thyroid | ATC | positive regulation of mitochondrion organization | 43/6293 | 74/18723 | 1.30e-05 | 1.25e-04 | 43 |
| GO:00901413 | Thyroid | ATC | positive regulation of mitochondrial fission | 14/6293 | 21/18723 | 1.99e-03 | 9.54e-03 | 14 |
| Page: 1 2 |
| Pathway ID | Tissue | Disease Stage | Description | Gene Ratio | Bg Ratio | pvalue | p.adjust | qvalue | Count |
| Page: 1 |
Top |
Cell-cell communication analysis |
| Identification of potential cell-cell interactions between two cell types and their ligand-receptor pairs for different disease states |
| Ligand | Receptor | LRpair | Pathway | Tissue | Disease Stage |
| Page: 1 |
Top |
Single-cell gene regulatory network inference analysis |
| Find out the significant the regulons (TFs) and the target genes of each regulon across cell types for different disease states |
| TF | Cell Type | Tissue | Disease Stage | Target Gene | RSS | Regulon Activity |
| ∗The dot plots of a searched regulon are shown for all cell subpopulations in each disease state of each tissue based on the regulon specific score inferred using pySCENIC and by calculating the average expression. |
| Page: 1 |
Top |
Somatic mutation of malignant transformation related genes |
| Annotation of somatic variants for genes involved in malignant transformation |
| Hugo Symbol | Variant Class | Variant Classification | dbSNP RS | HGVSc | HGVSp | HGVSp Short | SWISSPROT | BIOTYPE | SIFT | PolyPhen | Tumor Sample Barcode | Tissue | Histology | Sex | Age | Stage | Therapy Types | Drugs | Outcome |
| DDHD1 | SNV | Missense_Mutation | novel | c.793N>C | p.Glu265Gln | p.E265Q | Q8NEL9 | protein_coding | tolerated(0.07) | possibly_damaging(0.529) | TCGA-3C-AALI-01 | Breast | breast invasive carcinoma | Female | <65 | I/II | Unspecific | Poly E | Complete Response |
| DDHD1 | SNV | Missense_Mutation | novel | c.466C>T | p.Arg156Cys | p.R156C | Q8NEL9 | protein_coding | deleterious(0) | possibly_damaging(0.891) | TCGA-A8-A06Q-01 | Breast | breast invasive carcinoma | Female | <65 | III/IV | Unknown | Unknown | SD |
| DDHD1 | SNV | Missense_Mutation | rs772528960 | c.2479N>A | p.Leu827Ile | p.L827I | Q8NEL9 | protein_coding | tolerated_low_confidence(0.07) | benign(0.396) | TCGA-AN-A046-01 | Breast | breast invasive carcinoma | Female | >=65 | I/II | Unknown | Unknown | SD |
| DDHD1 | SNV | Missense_Mutation | c.1660N>T | p.Arg554Trp | p.R554W | Q8NEL9 | protein_coding | deleterious(0) | possibly_damaging(0.614) | TCGA-AN-A046-01 | Breast | breast invasive carcinoma | Female | >=65 | I/II | Unknown | Unknown | SD | |
| DDHD1 | SNV | Missense_Mutation | rs771702737 | c.1058N>A | p.Ser353Asn | p.S353N | Q8NEL9 | protein_coding | deleterious(0.04) | benign(0.086) | TCGA-AN-A046-01 | Breast | breast invasive carcinoma | Female | >=65 | I/II | Unknown | Unknown | SD |
| DDHD1 | insertion | Nonsense_Mutation | novel | c.1949_1950insGTGGTGAAACCTCATCTCTACTAAAAATACAAAAATTAGCTGGGCG | p.Ile650MetfsTer3 | p.I650Mfs*3 | Q8NEL9 | protein_coding | TCGA-AO-A0J9-01 | Breast | breast invasive carcinoma | Female | <65 | III/IV | Chemotherapy | cyclophosphamide | PD | ||
| DDHD1 | deletion | Frame_Shift_Del | novel | c.785delN | p.Gly262AlafsTer7 | p.G262Afs*7 | Q8NEL9 | protein_coding | TCGA-D8-A27V-01 | Breast | breast invasive carcinoma | Female | <65 | I/II | Hormone Therapy | tamoxiphen | SD | ||
| DDHD1 | deletion | Frame_Shift_Del | novel | c.432delN | p.Lys144AsnfsTer16 | p.K144Nfs*16 | Q8NEL9 | protein_coding | TCGA-EW-A2FV-01 | Breast | breast invasive carcinoma | Female | <65 | III/IV | Chemotherapy | docetaxel | SD | ||
| DDHD1 | deletion | Frame_Shift_Del | novel | c.148delN | p.Asp50ThrfsTer110 | p.D50Tfs*110 | Q8NEL9 | protein_coding | TCGA-EW-A2FV-01 | Breast | breast invasive carcinoma | Female | <65 | III/IV | Chemotherapy | docetaxel | SD | ||
| DDHD1 | SNV | Missense_Mutation | rs761072788 | c.482N>T | p.Thr161Met | p.T161M | Q8NEL9 | protein_coding | deleterious(0.02) | possibly_damaging(0.796) | TCGA-2W-A8YY-01 | Cervix | cervical & endocervical cancer | Female | <65 | I/II | Chemotherapy | cisplatin | CR |
| Page: 1 2 3 4 5 6 7 8 9 10 |
Top |
Related drugs of malignant transformation related genes |
| Identification of chemicals and drugs interact with genes involved in malignant transfromation |
| (DGIdb 4.0) |
| Entrez ID | Symbol | Category | Interaction Types | Drug Claim Name | Drug Name | PMIDs |
| 80821 | DDHD1 | PHOSPHOLIPASE | warfarin | WARFARIN | 27488176 |
| Page: 1 |

Copyright 2023-Present -The University of Texas Health Science Center at Houston |