
|
|||||
|
 | |
| |
| |
| |
| |
| |
|
Gene: DCBLD2 |
Gene summary for DCBLD2 |
| Gene information | Species | Human | Gene symbol | DCBLD2 | Gene ID | 131566 |
| Gene name | discoidin, CUB and LCCL domain containing 2 | |
| Gene Alias | CLCP1 | |
| Cytomap | 3q12.1 | |
| Gene Type | protein-coding | GO ID | GO:0001558 | UniProtAcc | Q96PD2 |
Top |
Malignant transformation analysis |
| Identification of the aberrant gene expression in precancerous and cancerous lesions by comparing the gene expression of stem-like cells in diseased tissues with normal stem cells |
| Entrez ID | Symbol | Replicates | Species | Organ | Tissue | Adj P-value | Log2FC | Malignancy |
| 131566 | DCBLD2 | P61T-E | Human | Esophagus | ESCC | 3.80e-41 | 1.19e+00 | 0.099 |
| 131566 | DCBLD2 | P62T-E | Human | Esophagus | ESCC | 3.40e-14 | 2.84e-01 | 0.1302 |
| 131566 | DCBLD2 | P65T-E | Human | Esophagus | ESCC | 1.96e-13 | 2.18e-01 | 0.0978 |
| 131566 | DCBLD2 | P74T-E | Human | Esophagus | ESCC | 3.39e-21 | 5.99e-01 | 0.1479 |
| 131566 | DCBLD2 | P75T-E | Human | Esophagus | ESCC | 6.52e-15 | 4.07e-01 | 0.1125 |
| 131566 | DCBLD2 | P76T-E | Human | Esophagus | ESCC | 4.06e-42 | 1.01e+00 | 0.1207 |
| 131566 | DCBLD2 | P79T-E | Human | Esophagus | ESCC | 2.47e-52 | 1.09e+00 | 0.1154 |
| 131566 | DCBLD2 | P80T-E | Human | Esophagus | ESCC | 4.28e-24 | 4.98e-01 | 0.155 |
| 131566 | DCBLD2 | P82T-E | Human | Esophagus | ESCC | 3.96e-06 | 4.06e-01 | 0.1072 |
| 131566 | DCBLD2 | P83T-E | Human | Esophagus | ESCC | 1.16e-25 | 7.66e-01 | 0.1738 |
| 131566 | DCBLD2 | P84T-E | Human | Esophagus | ESCC | 1.68e-03 | 2.16e-01 | 0.0933 |
| 131566 | DCBLD2 | P89T-E | Human | Esophagus | ESCC | 5.64e-09 | 6.24e-01 | 0.1752 |
| 131566 | DCBLD2 | P91T-E | Human | Esophagus | ESCC | 9.31e-10 | 8.26e-01 | 0.1828 |
| 131566 | DCBLD2 | P107T-E | Human | Esophagus | ESCC | 3.89e-51 | 1.52e+00 | 0.171 |
| 131566 | DCBLD2 | P126T-E | Human | Esophagus | ESCC | 8.05e-10 | 1.08e+00 | 0.1125 |
| 131566 | DCBLD2 | P127T-E | Human | Esophagus | ESCC | 1.65e-13 | 1.70e-01 | 0.0826 |
| 131566 | DCBLD2 | P128T-E | Human | Esophagus | ESCC | 2.17e-12 | 2.37e-01 | 0.1241 |
| 131566 | DCBLD2 | P130T-E | Human | Esophagus | ESCC | 3.53e-17 | 3.94e-01 | 0.1676 |
| 131566 | DCBLD2 | NAFLD1 | Human | Liver | NAFLD | 1.86e-05 | 5.56e-01 | -0.04 |
| 131566 | DCBLD2 | HCC1_Meng | Human | Liver | HCC | 1.16e-37 | -2.74e-02 | 0.0246 |
| Page: 1 2 3 4 5 6 |
| Tissue | Expression Dynamics | Abbreviation |
| Esophagus | 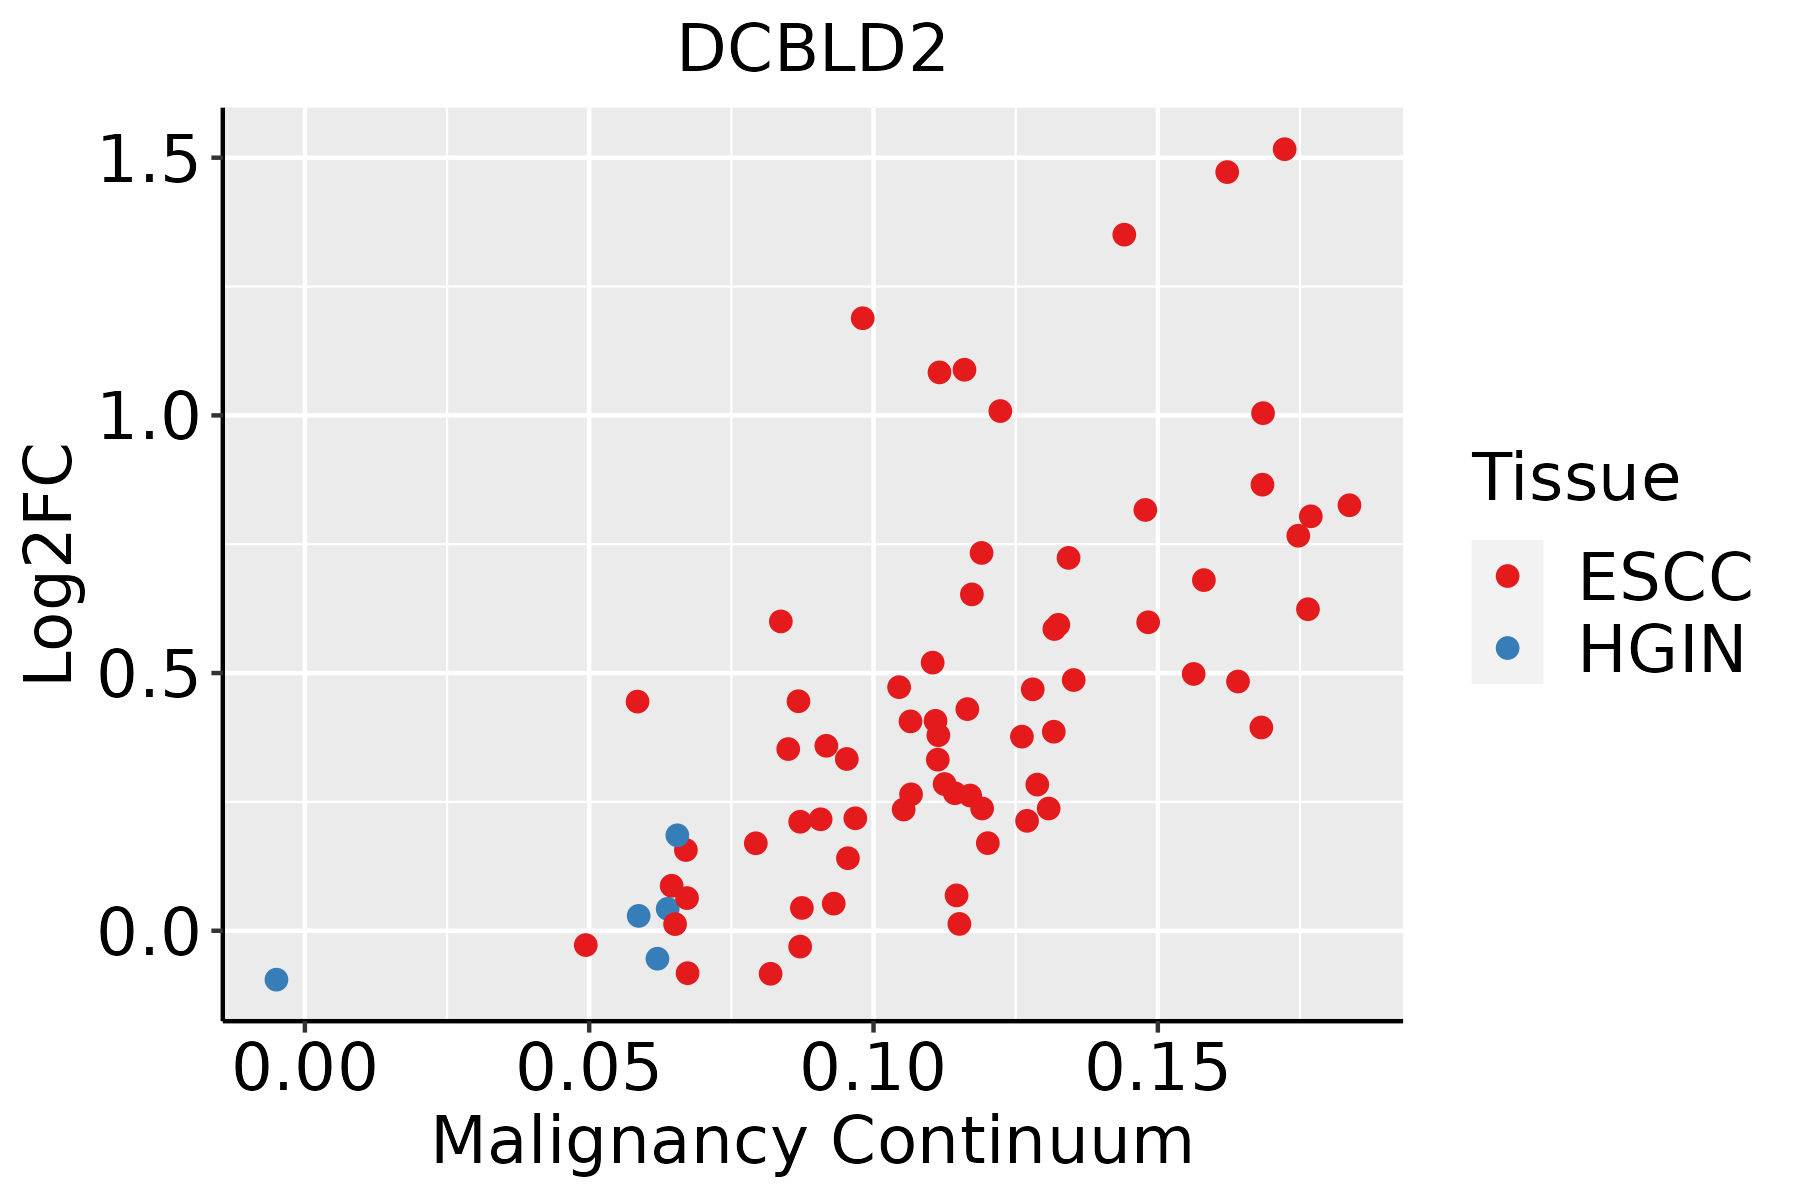 | ESCC: Esophageal squamous cell carcinoma |
| HGIN: High-grade intraepithelial neoplasias | ||
| LGIN: Low-grade intraepithelial neoplasias | ||
| Liver | 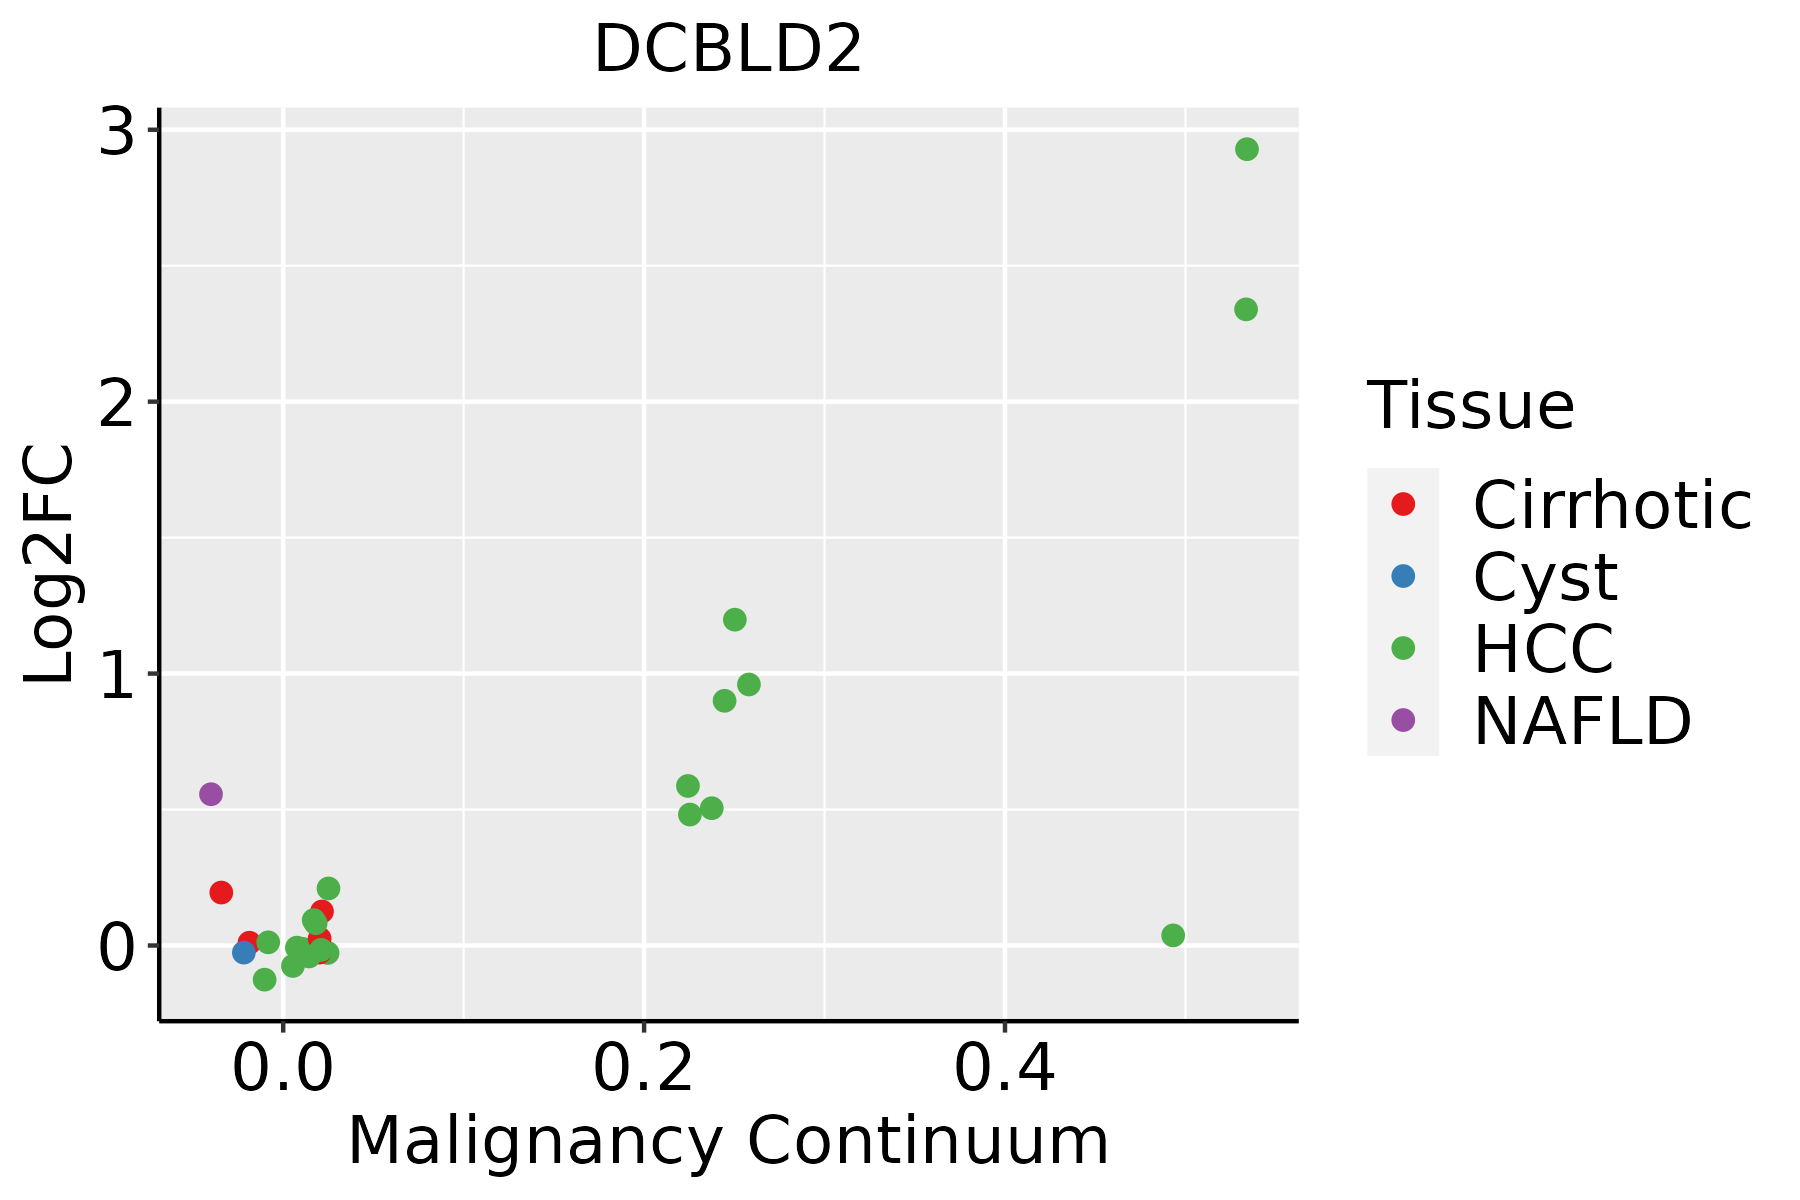 | HCC: Hepatocellular carcinoma |
| NAFLD: Non-alcoholic fatty liver disease | ||
| Lung |  | AAH: Atypical adenomatous hyperplasia |
| AIS: Adenocarcinoma in situ | ||
| IAC: Invasive lung adenocarcinoma | ||
| MIA: Minimally invasive adenocarcinoma | ||
| Oral Cavity | 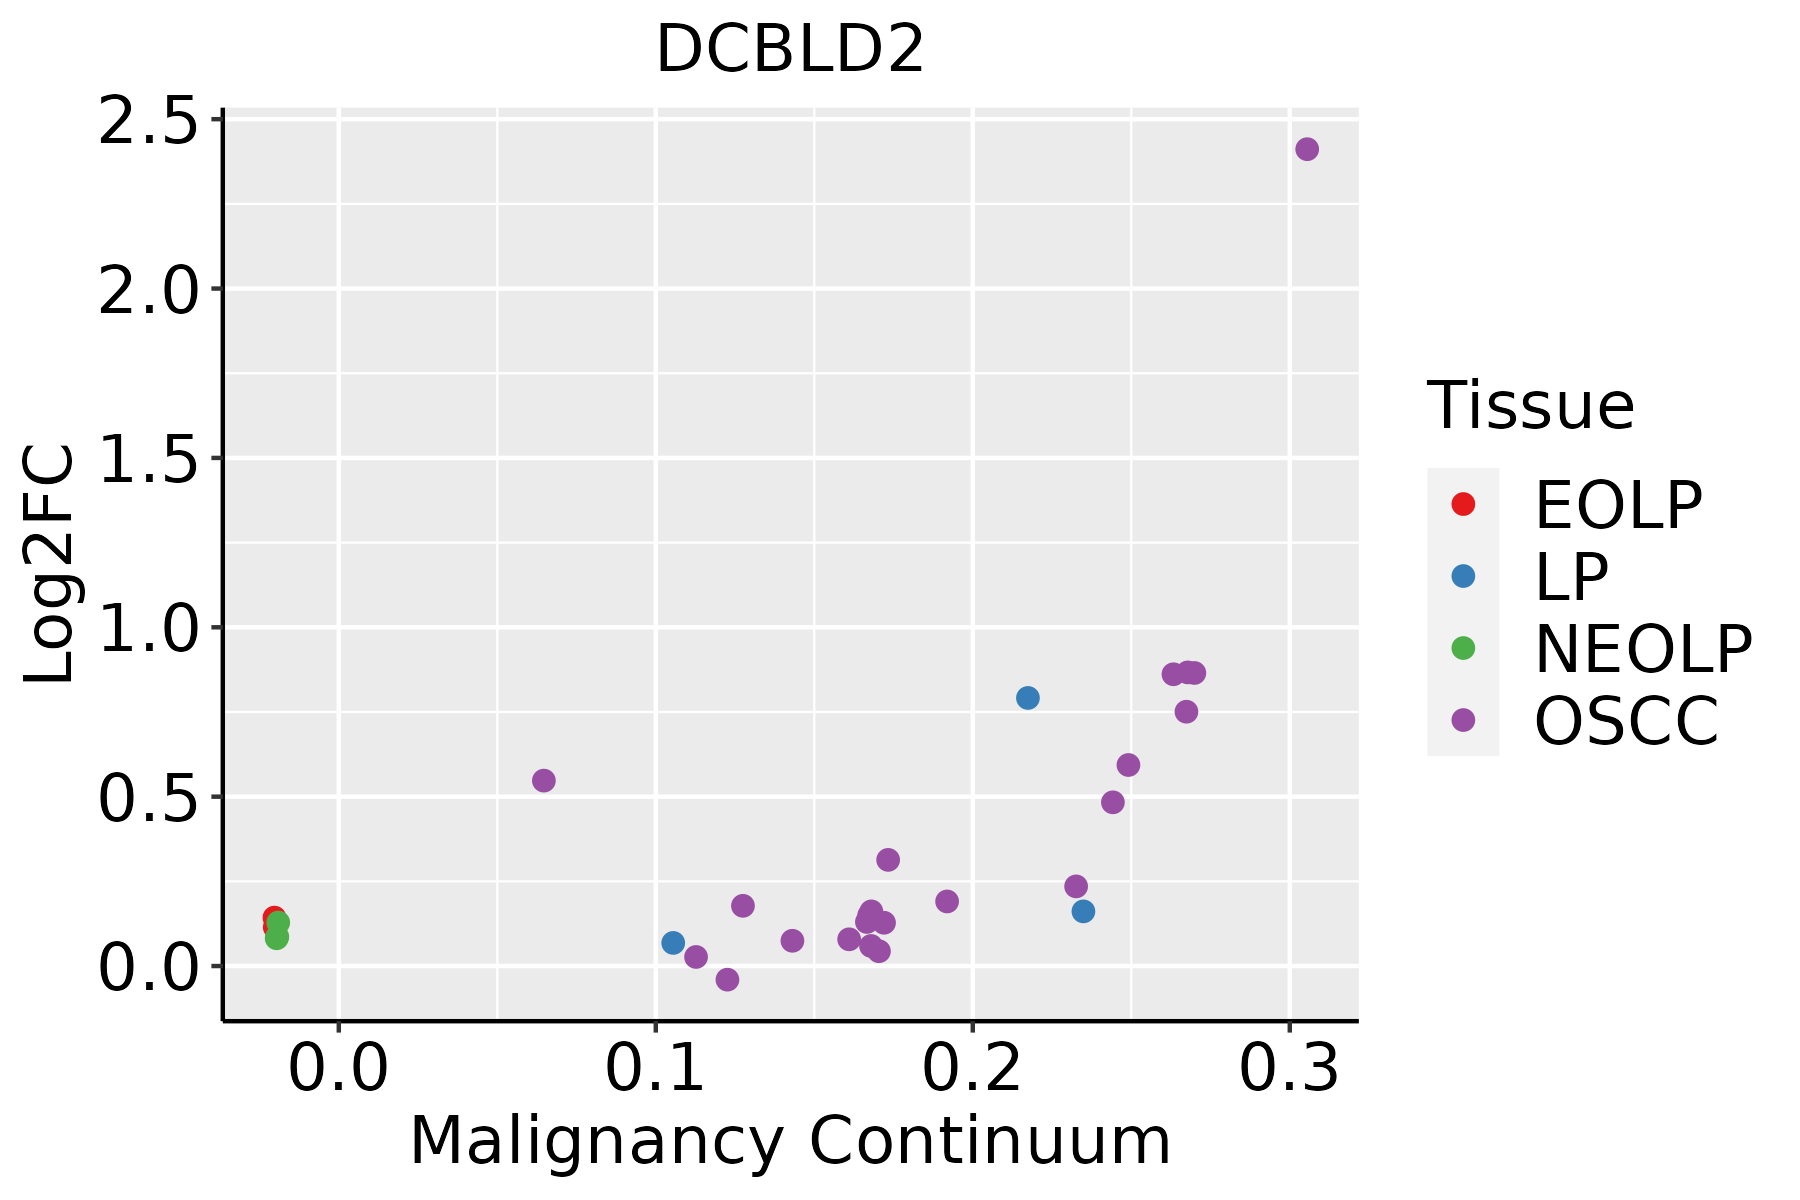 | EOLP: Erosive Oral lichen planus |
| LP: leukoplakia | ||
| NEOLP: Non-erosive oral lichen planus | ||
| OSCC: Oral squamous cell carcinoma | ||
| Skin | 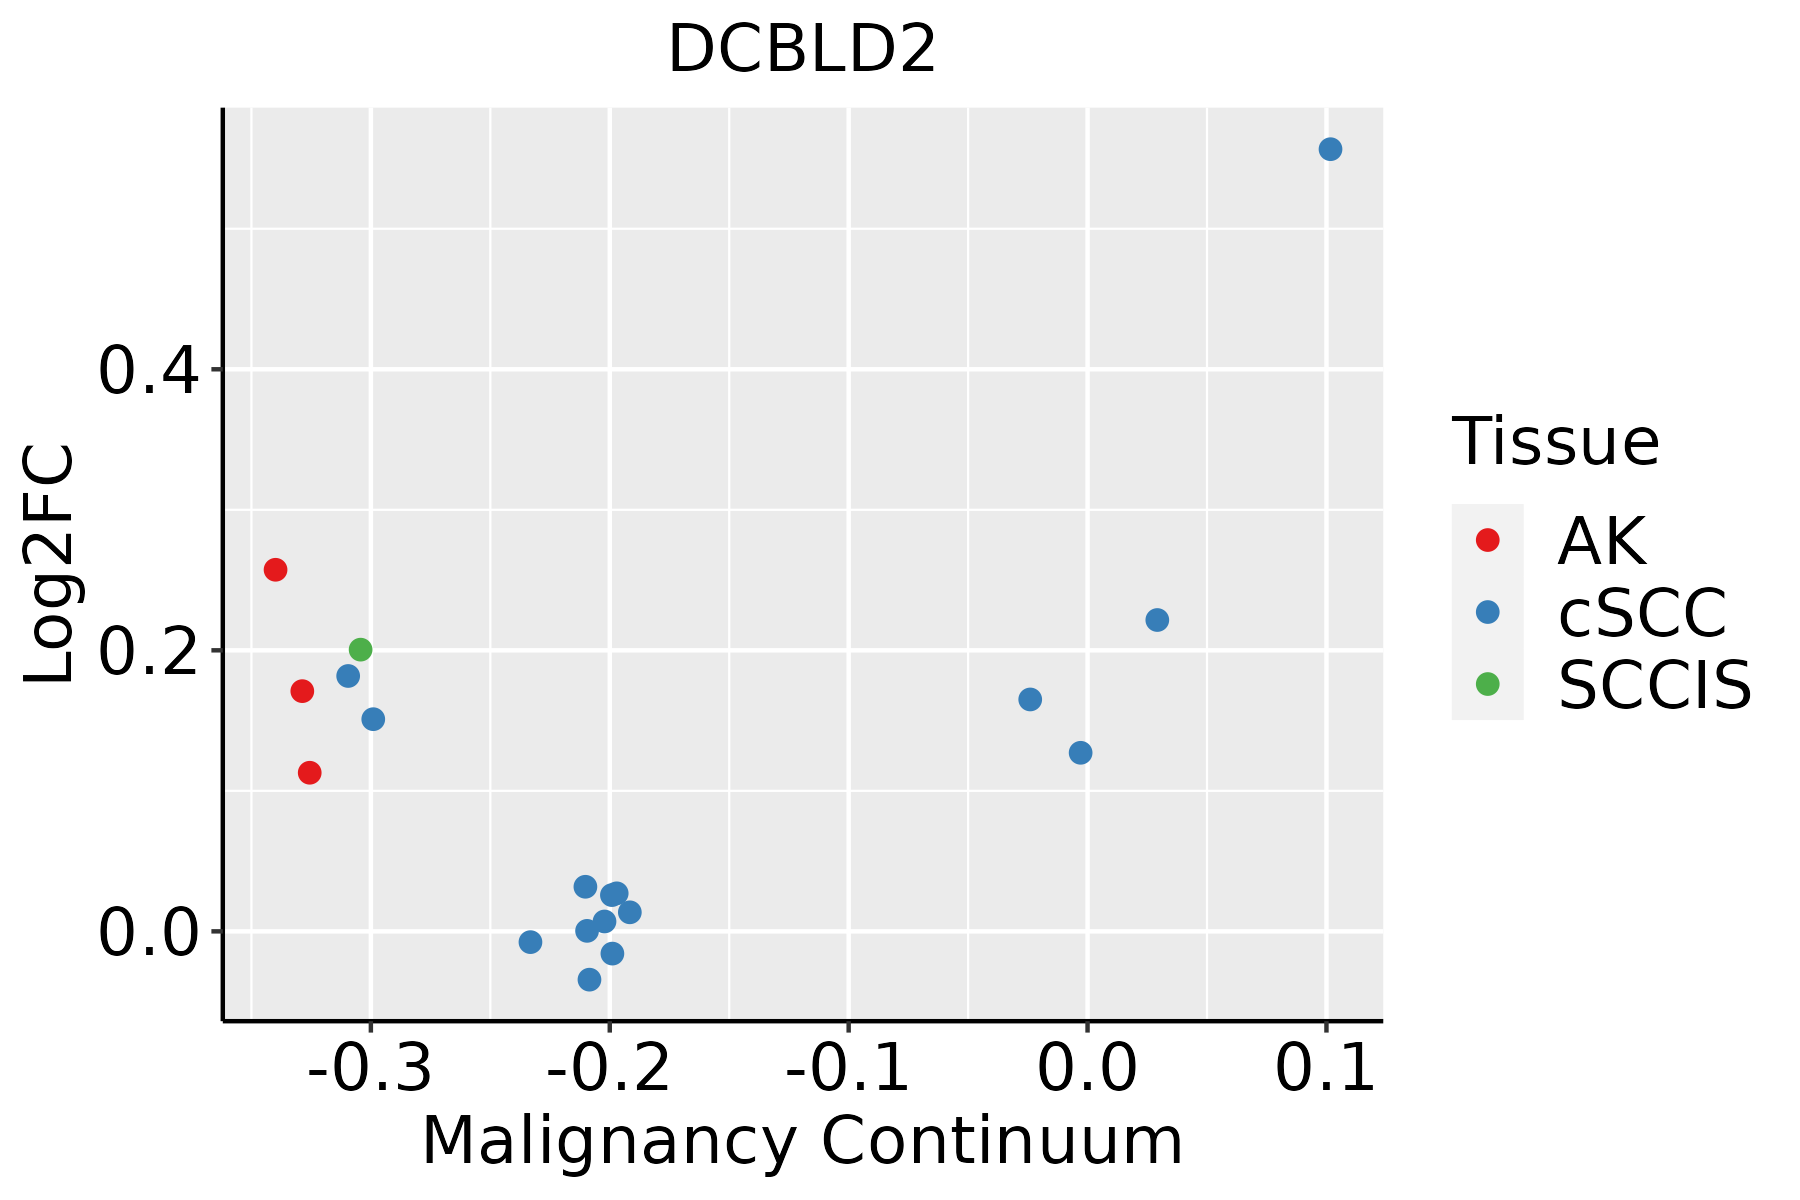 | AK: Actinic keratosis |
| cSCC: Cutaneous squamous cell carcinoma | ||
| SCCIS:squamous cell carcinoma in situ | ||
| Thyroid |  | ATC: Anaplastic thyroid cancer |
| HT: Hashimoto's thyroiditis | ||
| PTC: Papillary thyroid cancer |
| ∗log2FC in expression of this searched gene in stem-like cells from each diseased tissue sample relative to stem-like cells in normal samples in each tissue plotted against the malignancy continuum. Samples are colored based on if they are from different disease stage. |
Top |
Malignant transformation related pathway analysis |
| Find out the enriched GO biological processes and KEGG pathways involved in transition from healthy to precancer to cancer |
| Tissue | Disease Stage | Enriched GO biological Processes |
| Colorectum | AD |  |
| Colorectum | SER |  |
| Colorectum | MSS |  |
| Colorectum | MSI-H |  |
| Colorectum | FAP |  |
| ∗Top 15 enriched GO BP terms are showed in the bar plot of each disease state in each tissue. Each row represents a significant GO biological process which is colored according to the -log10(p.adjust). |
| Page: 1 2 3 4 5 6 7 8 9 |
| GO ID | Tissue | Disease Stage | Description | Gene Ratio | Bg Ratio | pvalue | p.adjust | Count |
| GO:0016049110 | Esophagus | ESCC | cell growth | 289/8552 | 482/18723 | 1.29e-10 | 3.77e-09 | 289 |
| GO:0030522110 | Esophagus | ESCC | intracellular receptor signaling pathway | 170/8552 | 265/18723 | 8.58e-10 | 2.09e-08 | 170 |
| GO:000155819 | Esophagus | ESCC | regulation of cell growth | 248/8552 | 414/18723 | 2.97e-09 | 6.45e-08 | 248 |
| GO:004206027 | Esophagus | ESCC | wound healing | 243/8552 | 422/18723 | 4.62e-07 | 6.25e-06 | 243 |
| GO:00459267 | Esophagus | ESCC | negative regulation of growth | 148/8552 | 249/18723 | 7.88e-06 | 7.73e-05 | 148 |
| GO:00303085 | Esophagus | ESCC | negative regulation of cell growth | 108/8552 | 188/18723 | 7.46e-04 | 3.87e-03 | 108 |
| GO:00420607 | Liver | NAFLD | wound healing | 84/1882 | 422/18723 | 6.56e-10 | 1.37e-07 | 84 |
| GO:00305226 | Liver | NAFLD | intracellular receptor signaling pathway | 55/1882 | 265/18723 | 1.39e-07 | 1.03e-05 | 55 |
| GO:00160495 | Liver | NAFLD | cell growth | 85/1882 | 482/18723 | 1.75e-07 | 1.25e-05 | 85 |
| GO:00015585 | Liver | NAFLD | regulation of cell growth | 63/1882 | 414/18723 | 5.50e-04 | 7.46e-03 | 63 |
| GO:003052222 | Liver | HCC | intracellular receptor signaling pathway | 171/7958 | 265/18723 | 3.00e-13 | 1.61e-11 | 171 |
| GO:001604921 | Liver | HCC | cell growth | 269/7958 | 482/18723 | 1.84e-09 | 5.35e-08 | 269 |
| GO:000155821 | Liver | HCC | regulation of cell growth | 228/7958 | 414/18723 | 1.34e-07 | 2.55e-06 | 228 |
| GO:004206022 | Liver | HCC | wound healing | 219/7958 | 422/18723 | 5.34e-05 | 5.04e-04 | 219 |
| GO:00459263 | Liver | HCC | negative regulation of growth | 129/7958 | 249/18723 | 1.81e-03 | 9.37e-03 | 129 |
| GO:0030308 | Liver | HCC | negative regulation of cell growth | 98/7958 | 188/18723 | 4.74e-03 | 2.02e-02 | 98 |
| GO:00305227 | Lung | IAC | intracellular receptor signaling pathway | 59/2061 | 265/18723 | 8.88e-08 | 8.50e-06 | 59 |
| GO:00160496 | Lung | IAC | cell growth | 89/2061 | 482/18723 | 6.10e-07 | 3.67e-05 | 89 |
| GO:00420608 | Lung | IAC | wound healing | 76/2061 | 422/18723 | 1.01e-05 | 3.23e-04 | 76 |
| GO:00015586 | Lung | IAC | regulation of cell growth | 70/2061 | 414/18723 | 1.69e-04 | 3.01e-03 | 70 |
| Page: 1 2 3 |
| Pathway ID | Tissue | Disease Stage | Description | Gene Ratio | Bg Ratio | pvalue | p.adjust | qvalue | Count |
| Page: 1 |
Top |
Cell-cell communication analysis |
| Identification of potential cell-cell interactions between two cell types and their ligand-receptor pairs for different disease states |
| Ligand | Receptor | LRpair | Pathway | Tissue | Disease Stage |
| Page: 1 |
Top |
Single-cell gene regulatory network inference analysis |
| Find out the significant the regulons (TFs) and the target genes of each regulon across cell types for different disease states |
| TF | Cell Type | Tissue | Disease Stage | Target Gene | RSS | Regulon Activity |
| ∗The dot plots of a searched regulon are shown for all cell subpopulations in each disease state of each tissue based on the regulon specific score inferred using pySCENIC and by calculating the average expression. |
| Page: 1 |
Top |
Somatic mutation of malignant transformation related genes |
| Annotation of somatic variants for genes involved in malignant transformation |
| Hugo Symbol | Variant Class | Variant Classification | dbSNP RS | HGVSc | HGVSp | HGVSp Short | SWISSPROT | BIOTYPE | SIFT | PolyPhen | Tumor Sample Barcode | Tissue | Histology | Sex | Age | Stage | Therapy Types | Drugs | Outcome |
| DCBLD2 | SNV | Missense_Mutation | c.1288A>G | p.Arg430Gly | p.R430G | Q96PD2 | protein_coding | deleterious(0) | possibly_damaging(0.871) | TCGA-A8-A09Z-01 | Breast | breast invasive carcinoma | Female | >=65 | I/II | Unknown | Unknown | SD | |
| DCBLD2 | SNV | Missense_Mutation | c.835N>A | p.His279Asn | p.H279N | Q96PD2 | protein_coding | tolerated(0.33) | benign(0.003) | TCGA-AR-A24L-01 | Breast | breast invasive carcinoma | Female | <65 | I/II | Hormone Therapy | tamoxiphen | PD | |
| DCBLD2 | SNV | Missense_Mutation | c.850C>T | p.Leu284Phe | p.L284F | Q96PD2 | protein_coding | tolerated(0.12) | probably_damaging(0.999) | TCGA-GM-A2DM-01 | Breast | breast invasive carcinoma | Female | <65 | I/II | Chemotherapy | taxol | CR | |
| DCBLD2 | SNV | Missense_Mutation | novel | c.2249N>G | p.Tyr750Cys | p.Y750C | Q96PD2 | protein_coding | deleterious(0) | probably_damaging(0.997) | TCGA-GM-A5PV-01 | Breast | breast invasive carcinoma | Female | <65 | I/II | Chemotherapy | taxotere | CR |
| DCBLD2 | SNV | Missense_Mutation | novel | c.932N>T | p.Ser311Leu | p.S311L | Q96PD2 | protein_coding | deleterious(0) | probably_damaging(0.998) | TCGA-S3-AA0Z-01 | Breast | breast invasive carcinoma | Female | <65 | I/II | Ancillary | neulasta | CR |
| DCBLD2 | insertion | Nonsense_Mutation | novel | c.2095_2096insGGTTGGGGAAAATGTGGTGACTGAGGTACAGGAAA | p.Ser699TrpfsTer7 | p.S699Wfs*7 | Q96PD2 | protein_coding | TCGA-A8-A08H-01 | Breast | breast invasive carcinoma | Female | >=65 | I/II | Unknown | Unknown | SD | ||
| DCBLD2 | insertion | Frame_Shift_Ins | novel | c.1772_1773insCT | p.Glu591AspfsTer16 | p.E591Dfs*16 | Q96PD2 | protein_coding | TCGA-AC-A3QQ-01 | Breast | breast invasive carcinoma | Female | <65 | I/II | Unknown | Unknown | SD | ||
| DCBLD2 | SNV | Missense_Mutation | novel | c.853N>C | p.Phe285Leu | p.F285L | Q96PD2 | protein_coding | deleterious(0) | probably_damaging(0.992) | TCGA-EA-A3HU-01 | Cervix | cervical & endocervical cancer | Female | <65 | I/II | Unknown | Unknown | SD |
| DCBLD2 | SNV | Missense_Mutation | c.1684G>A | p.Glu562Lys | p.E562K | Q96PD2 | protein_coding | tolerated(0.28) | benign(0.003) | TCGA-IR-A3LA-01 | Cervix | cervical & endocervical cancer | Female | <65 | I/II | Chemotherapy | cisplatin | CR | |
| DCBLD2 | SNV | Missense_Mutation | novel | c.1005N>C | p.Lys335Asn | p.K335N | Q96PD2 | protein_coding | tolerated(0.13) | possibly_damaging(0.673) | TCGA-A6-2679-01 | Colorectum | colon adenocarcinoma | Female | >=65 | I/II | Unknown | Unknown | SD |
| Page: 1 2 3 4 5 6 7 8 9 |
Top |
Related drugs of malignant transformation related genes |
| Identification of chemicals and drugs interact with genes involved in malignant transfromation |
| (DGIdb 4.0) |
| Entrez ID | Symbol | Category | Interaction Types | Drug Claim Name | Drug Name | PMIDs |
| Page: 1 |

Copyright 2023-Present -The University of Texas Health Science Center at Houston |