
|
|||||
|
 | |
| |
| |
| |
| |
| |
|
Gene: DCAF10 |
Gene summary for DCAF10 |
| Gene information | Species | Human | Gene symbol | DCAF10 | Gene ID | 79269 |
| Gene name | DDB1 and CUL4 associated factor 10 | |
| Gene Alias | WDR32 | |
| Cytomap | 9p13.2 | |
| Gene Type | protein-coding | GO ID | GO:0006464 | UniProtAcc | A0A0A0MQT4 |
Top |
Malignant transformation analysis |
| Identification of the aberrant gene expression in precancerous and cancerous lesions by comparing the gene expression of stem-like cells in diseased tissues with normal stem cells |
| Entrez ID | Symbol | Replicates | Species | Organ | Tissue | Adj P-value | Log2FC | Malignancy |
| 79269 | DCAF10 | A015-C-006 | Human | Colorectum | FAP | 2.46e-14 | -6.02e-01 | -0.0994 |
| 79269 | DCAF10 | A015-C-106 | Human | Colorectum | FAP | 3.40e-19 | -4.07e-01 | -0.0511 |
| 79269 | DCAF10 | A002-C-114 | Human | Colorectum | FAP | 4.31e-15 | -5.32e-01 | -0.1561 |
| 79269 | DCAF10 | A015-C-104 | Human | Colorectum | FAP | 1.21e-29 | -5.33e-01 | -0.1899 |
| 79269 | DCAF10 | A001-C-014 | Human | Colorectum | FAP | 1.74e-20 | -4.66e-01 | 0.0135 |
| 79269 | DCAF10 | A002-C-016 | Human | Colorectum | FAP | 2.69e-27 | -4.34e-01 | 0.0521 |
| 79269 | DCAF10 | A015-C-002 | Human | Colorectum | FAP | 1.18e-08 | -4.95e-01 | -0.0763 |
| 79269 | DCAF10 | A001-C-203 | Human | Colorectum | FAP | 1.83e-22 | -4.28e-01 | -0.0481 |
| 79269 | DCAF10 | A002-C-116 | Human | Colorectum | FAP | 6.80e-31 | -5.47e-01 | -0.0452 |
| 79269 | DCAF10 | A014-C-008 | Human | Colorectum | FAP | 6.64e-12 | -5.51e-01 | -0.191 |
| 79269 | DCAF10 | A018-E-020 | Human | Colorectum | FAP | 2.18e-21 | -6.30e-01 | -0.2034 |
| 79269 | DCAF10 | F034 | Human | Colorectum | FAP | 1.02e-18 | -4.32e-01 | -0.0665 |
| 79269 | DCAF10 | F072B | Human | Colorectum | FAP | 1.37e-10 | -3.48e-01 | 0.257 |
| 79269 | DCAF10 | CRC-1-8810 | Human | Colorectum | CRC | 1.64e-03 | -1.00e-01 | 0.6257 |
| 79269 | DCAF10 | CRC-3-11773 | Human | Colorectum | CRC | 5.91e-14 | -3.43e-01 | 0.2564 |
| 79269 | DCAF10 | LZE2T | Human | Esophagus | ESCC | 1.51e-02 | 2.02e-01 | 0.082 |
| 79269 | DCAF10 | LZE4T | Human | Esophagus | ESCC | 3.43e-10 | 1.36e-01 | 0.0811 |
| 79269 | DCAF10 | LZE20T | Human | Esophagus | ESCC | 5.33e-05 | 1.45e-01 | 0.0662 |
| 79269 | DCAF10 | LZE24T | Human | Esophagus | ESCC | 1.17e-21 | 3.90e-01 | 0.0596 |
| 79269 | DCAF10 | LZE21T | Human | Esophagus | ESCC | 3.11e-03 | 1.71e-01 | 0.0655 |
| Page: 1 2 3 4 5 6 7 8 9 |
| Tissue | Expression Dynamics | Abbreviation |
| Breast | 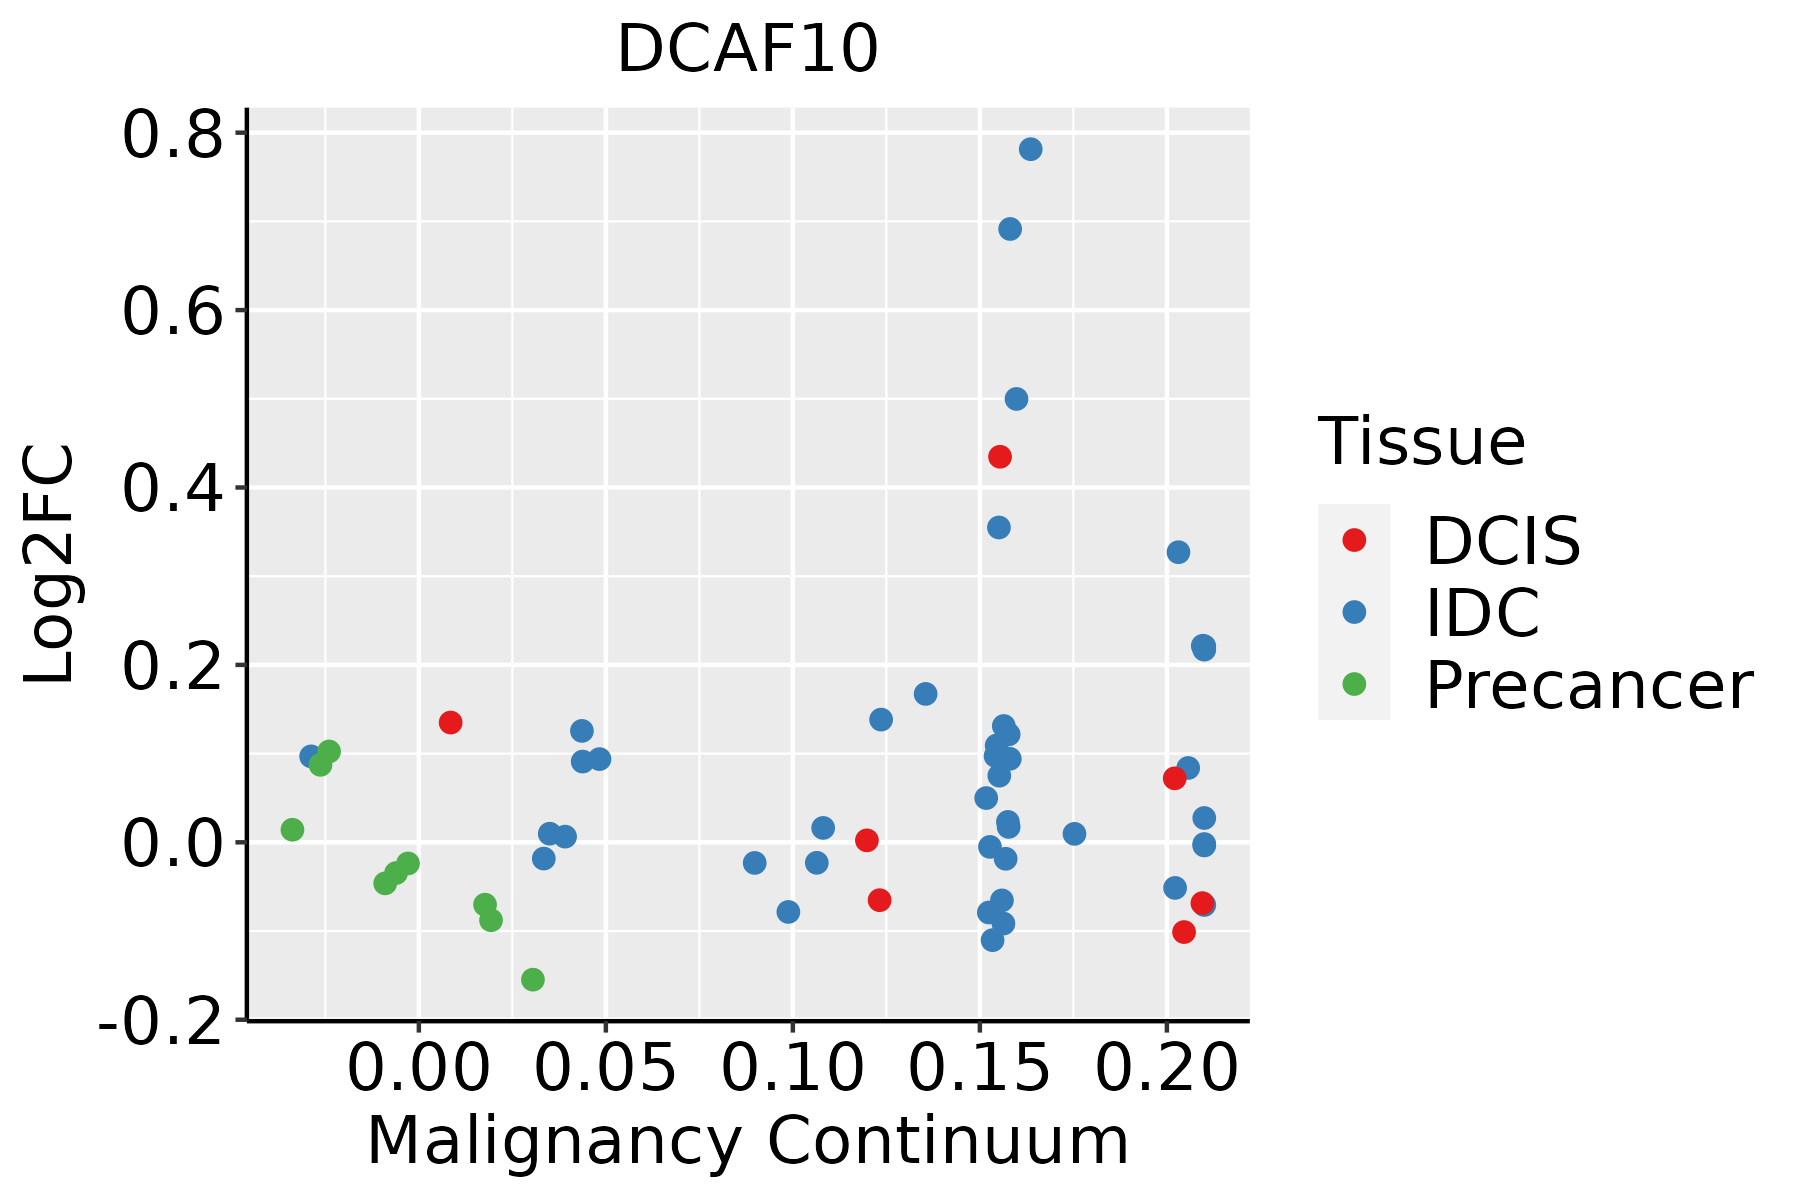 | IDC: Invasive ductal carcinoma |
| DCIS: Ductal carcinoma in situ | ||
| Precancer(BRCA1-mut): Precancerous lesion from BRCA1 mutation carriers | ||
| Cervix | 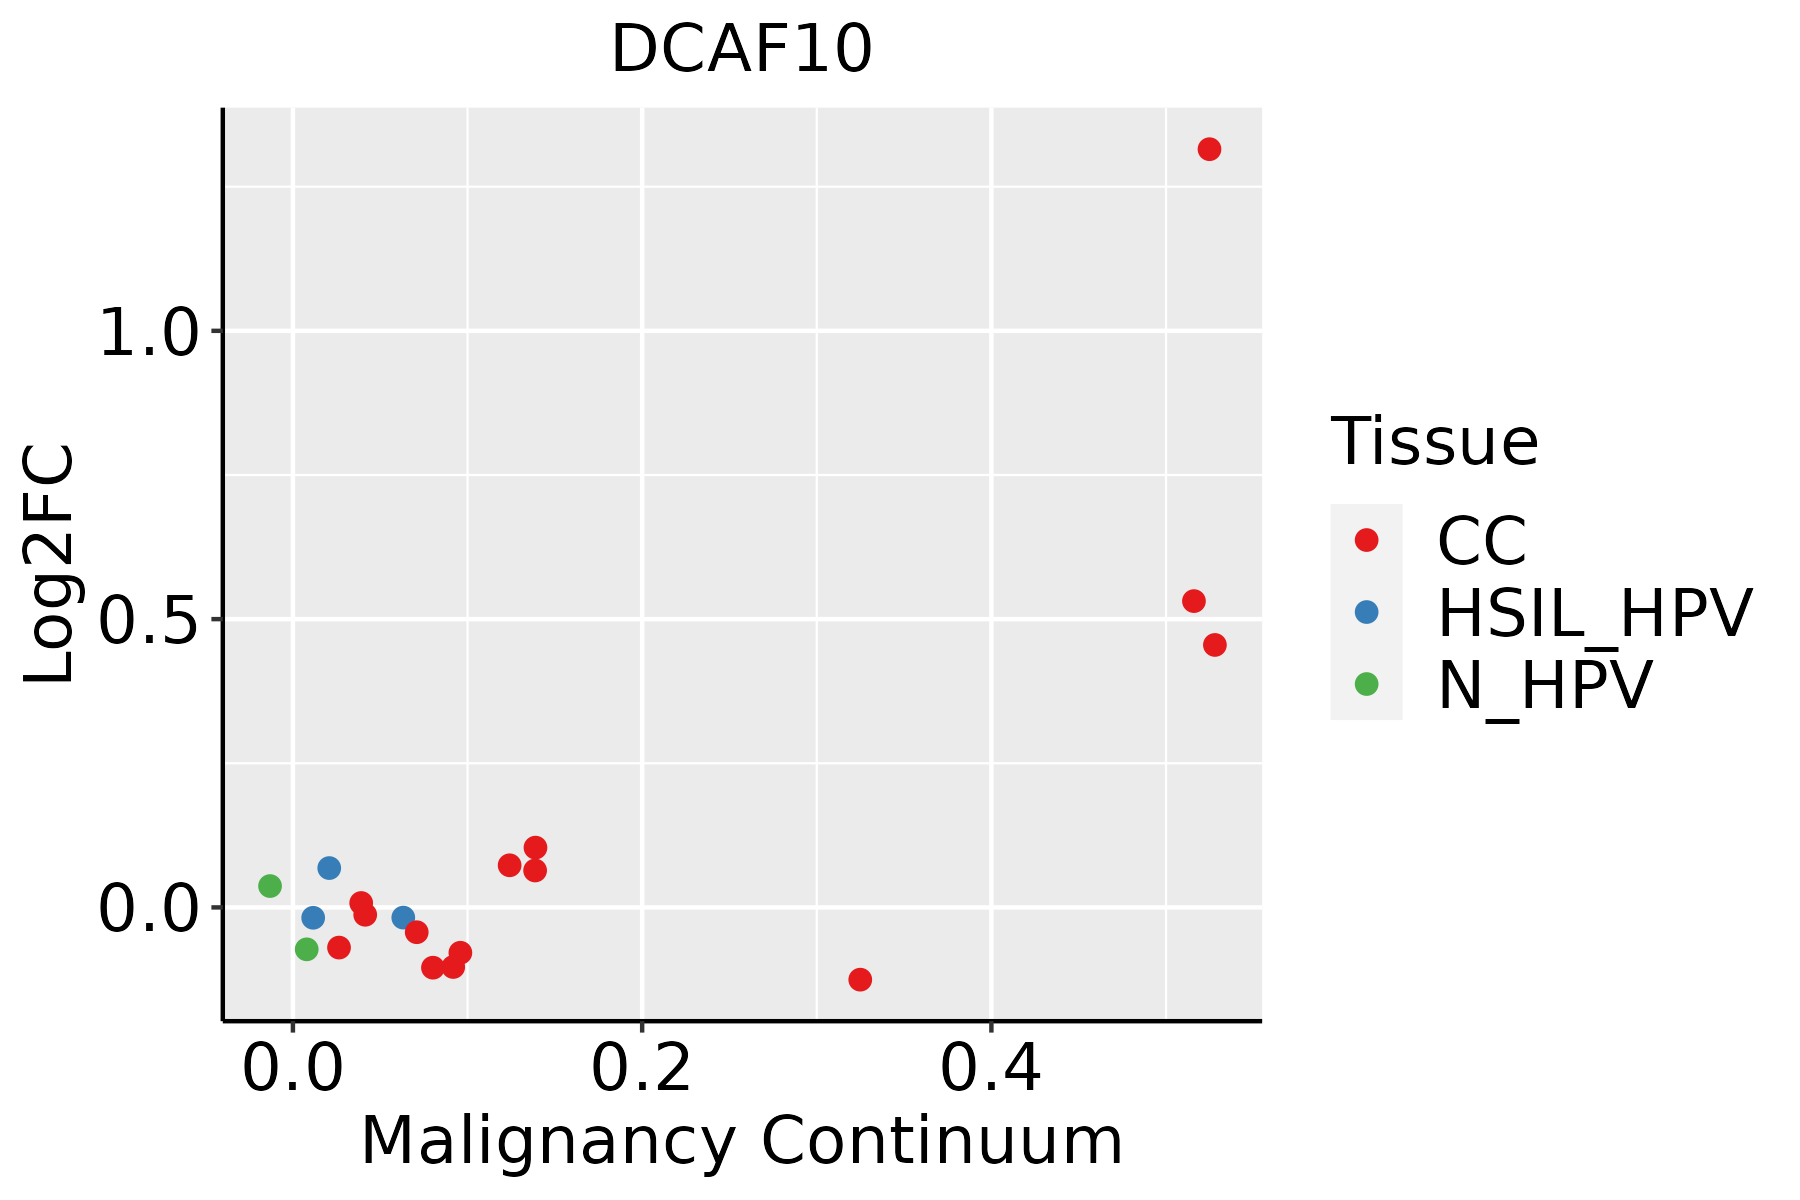 | CC: Cervix cancer |
| HSIL_HPV: HPV-infected high-grade squamous intraepithelial lesions | ||
| N_HPV: HPV-infected normal cervix | ||
| Colorectum (GSE201348) |  | FAP: Familial adenomatous polyposis |
| CRC: Colorectal cancer | ||
| Colorectum (HTA11) |  | AD: Adenomas |
| SER: Sessile serrated lesions | ||
| MSI-H: Microsatellite-high colorectal cancer | ||
| MSS: Microsatellite stable colorectal cancer | ||
| Esophagus | 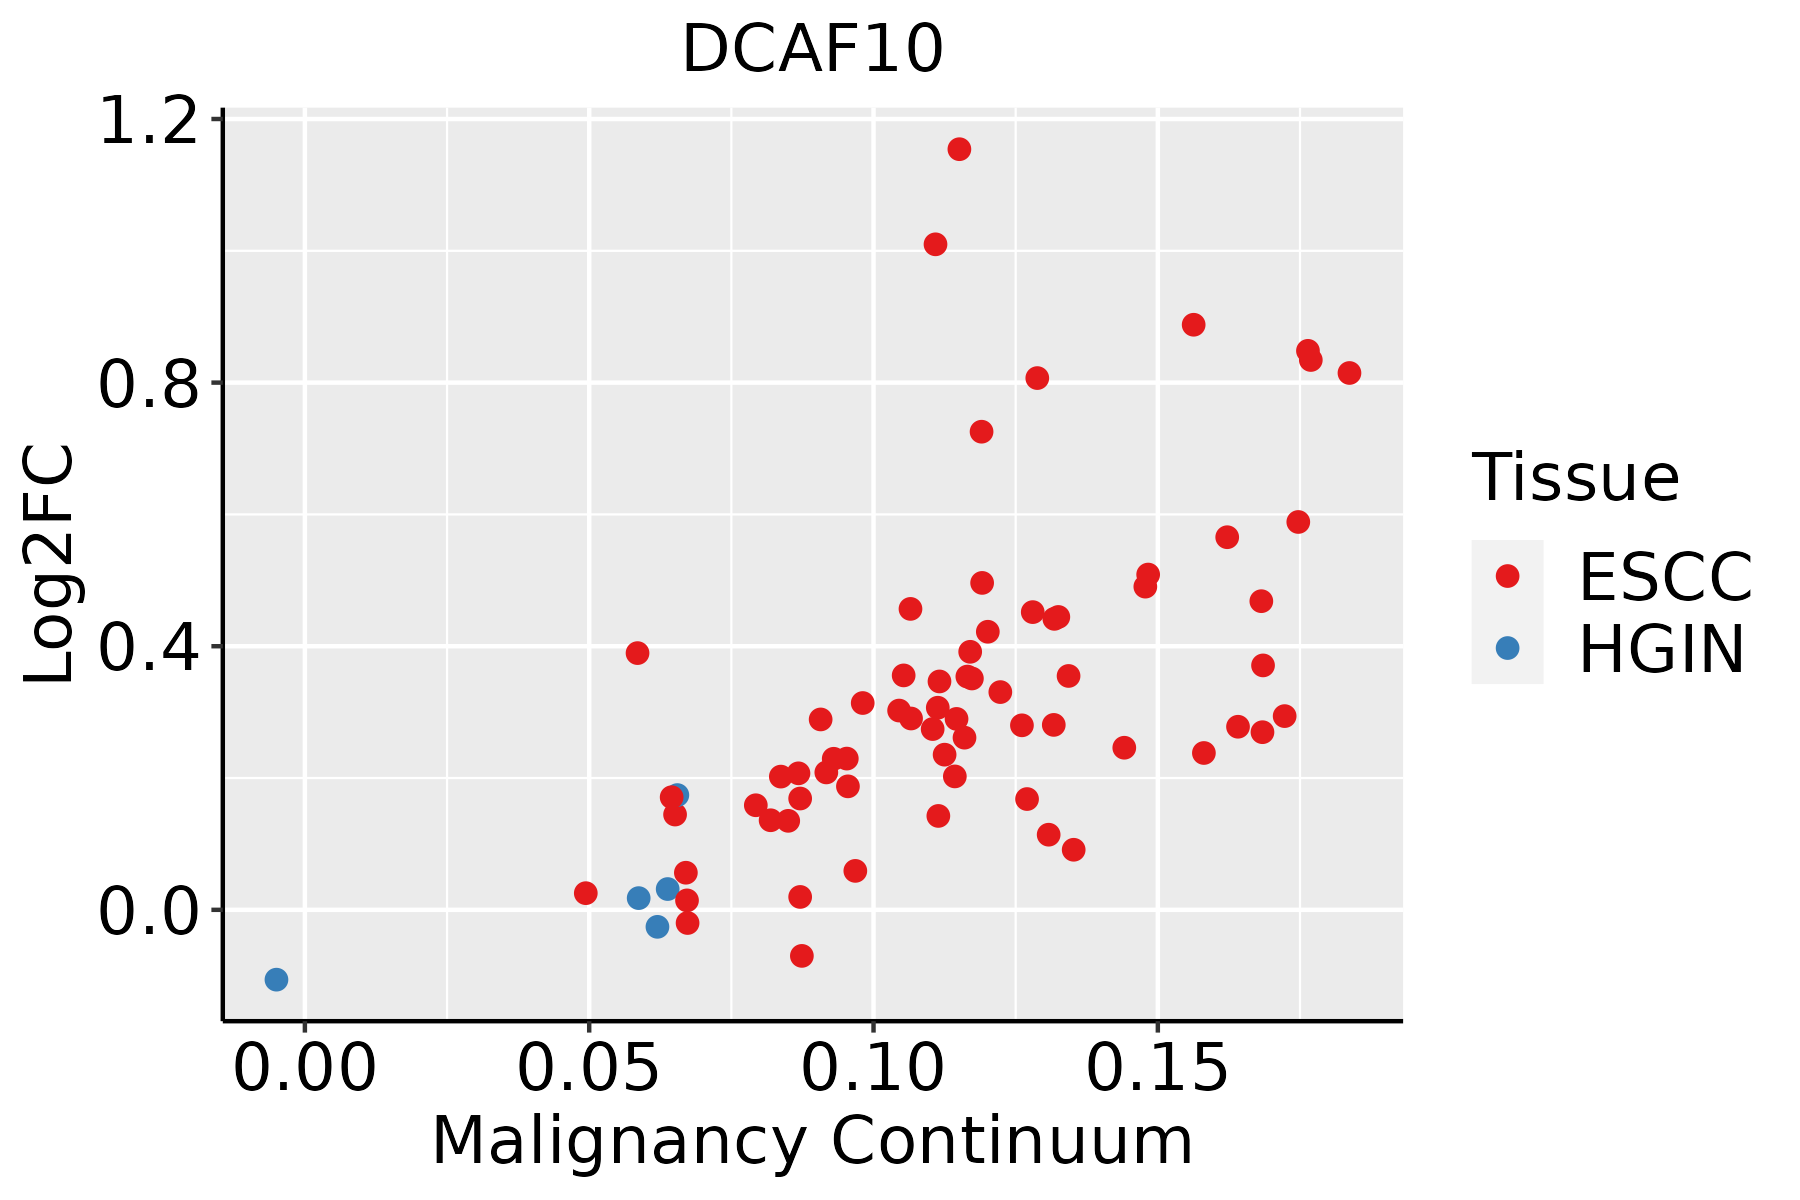 | ESCC: Esophageal squamous cell carcinoma |
| HGIN: High-grade intraepithelial neoplasias | ||
| LGIN: Low-grade intraepithelial neoplasias | ||
| Liver |  | HCC: Hepatocellular carcinoma |
| NAFLD: Non-alcoholic fatty liver disease | ||
| Oral Cavity |  | EOLP: Erosive Oral lichen planus |
| LP: leukoplakia | ||
| NEOLP: Non-erosive oral lichen planus | ||
| OSCC: Oral squamous cell carcinoma | ||
| Skin | 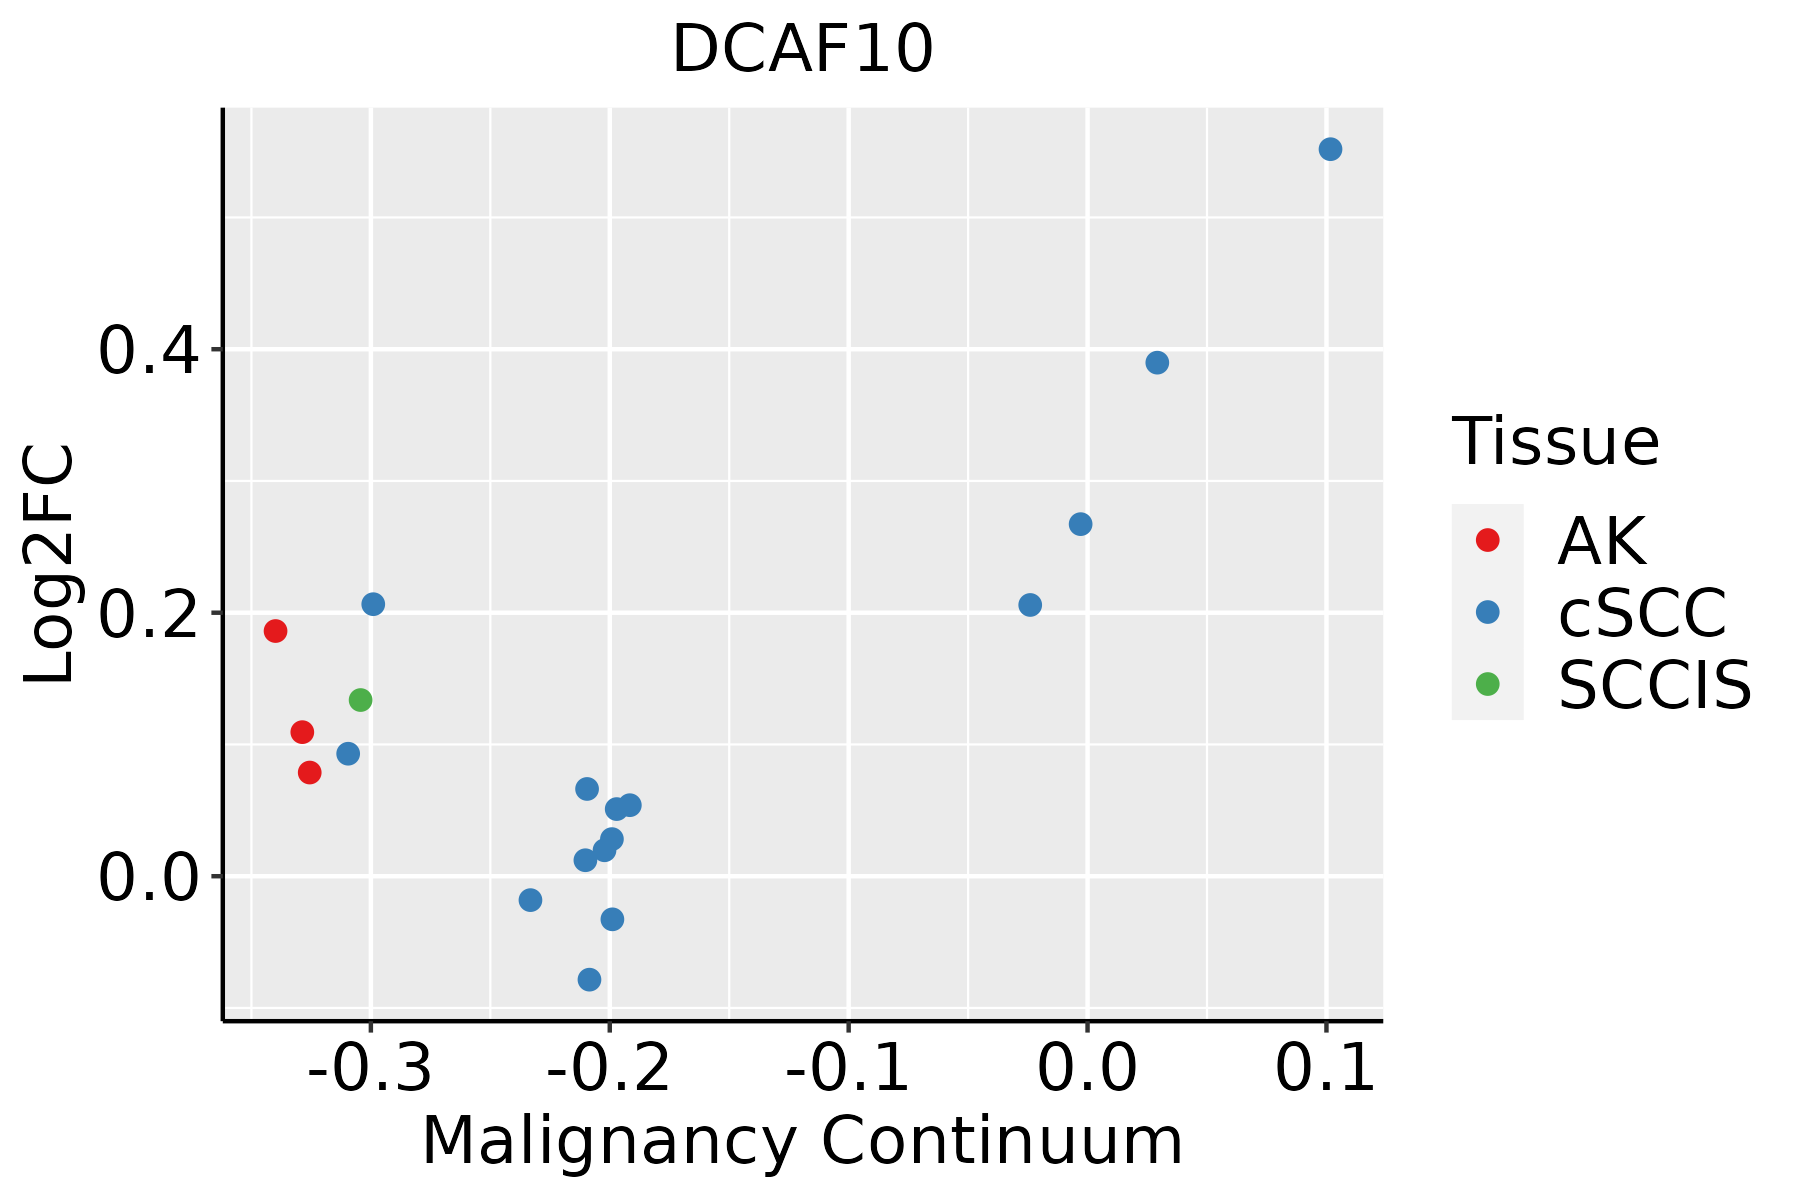 | AK: Actinic keratosis |
| cSCC: Cutaneous squamous cell carcinoma | ||
| SCCIS:squamous cell carcinoma in situ | ||
| Thyroid | 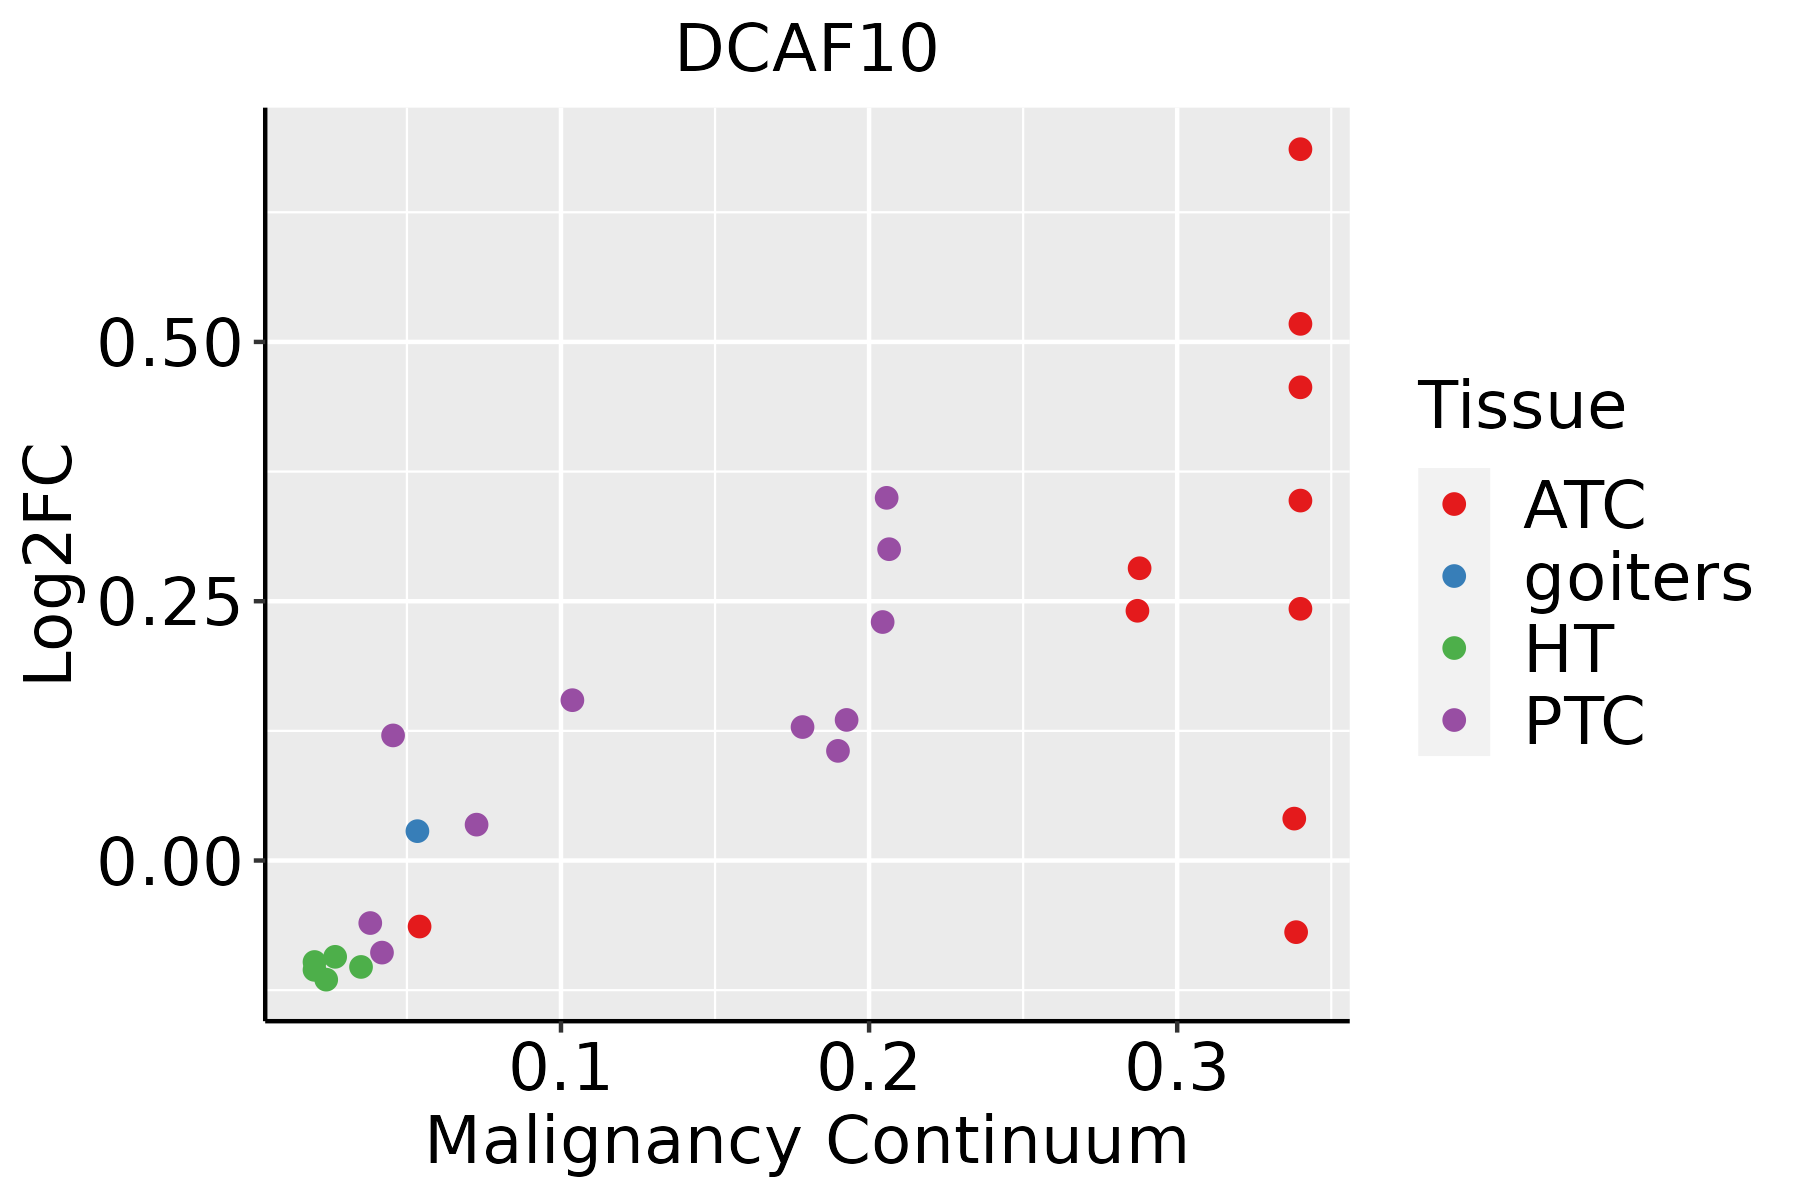 | ATC: Anaplastic thyroid cancer |
| HT: Hashimoto's thyroiditis | ||
| PTC: Papillary thyroid cancer |
| ∗log2FC in expression of this searched gene in stem-like cells from each diseased tissue sample relative to stem-like cells in normal samples in each tissue plotted against the malignancy continuum. Samples are colored based on if they are from different disease stage. |
Top |
Malignant transformation related pathway analysis |
| Find out the enriched GO biological processes and KEGG pathways involved in transition from healthy to precancer to cancer |
| Tissue | Disease Stage | Enriched GO biological Processes |
| Colorectum | AD |  |
| Colorectum | SER |  |
| Colorectum | MSS |  |
| Colorectum | MSI-H |  |
| Colorectum | FAP |  |
| ∗Top 15 enriched GO BP terms are showed in the bar plot of each disease state in each tissue. Each row represents a significant GO biological process which is colored according to the -log10(p.adjust). |
| Page: 1 2 3 4 5 6 7 8 9 |
| GO ID | Tissue | Disease Stage | Description | Gene Ratio | Bg Ratio | pvalue | p.adjust | Count |
| Page: 1 |
| Pathway ID | Tissue | Disease Stage | Description | Gene Ratio | Bg Ratio | pvalue | p.adjust | qvalue | Count |
| Page: 1 |
Top |
Cell-cell communication analysis |
| Identification of potential cell-cell interactions between two cell types and their ligand-receptor pairs for different disease states |
| Ligand | Receptor | LRpair | Pathway | Tissue | Disease Stage |
| Page: 1 |
Top |
Single-cell gene regulatory network inference analysis |
| Find out the significant the regulons (TFs) and the target genes of each regulon across cell types for different disease states |
| TF | Cell Type | Tissue | Disease Stage | Target Gene | RSS | Regulon Activity |
| ∗The dot plots of a searched regulon are shown for all cell subpopulations in each disease state of each tissue based on the regulon specific score inferred using pySCENIC and by calculating the average expression. |
| Page: 1 |
Top |
Somatic mutation of malignant transformation related genes |
| Annotation of somatic variants for genes involved in malignant transformation |
| Hugo Symbol | Variant Class | Variant Classification | dbSNP RS | HGVSc | HGVSp | HGVSp Short | SWISSPROT | BIOTYPE | SIFT | PolyPhen | Tumor Sample Barcode | Tissue | Histology | Sex | Age | Stage | Therapy Types | Drugs | Outcome |
| DCAF10 | SNV | Missense_Mutation | c.1674N>C | p.Lys558Asn | p.K558N | Q5QP82 | protein_coding | tolerated(0.09) | benign(0.015) | TCGA-AR-A1AO-01 | Breast | breast invasive carcinoma | Female | <65 | I/II | Chemotherapy | doxorubicin | SD | |
| DCAF10 | SNV | Missense_Mutation | c.940T>A | p.Leu314Met | p.L314M | Q5QP82 | protein_coding | deleterious(0.01) | probably_damaging(0.996) | TCGA-A6-2686-01 | Colorectum | colon adenocarcinoma | Female | >=65 | I/II | Unknown | Unknown | SD | |
| DCAF10 | SNV | Missense_Mutation | rs745707991 | c.1228G>A | p.Gly410Arg | p.G410R | Q5QP82 | protein_coding | deleterious(0.02) | probably_damaging(0.999) | TCGA-CM-4743-01 | Colorectum | colon adenocarcinoma | Male | >=65 | I/II | Chemotherapy | capecitabine | SD |
| DCAF10 | SNV | Missense_Mutation | rs767043246 | c.1178N>A | p.Arg393Gln | p.R393Q | Q5QP82 | protein_coding | tolerated(0.05) | probably_damaging(0.992) | TCGA-AG-3892-01 | Colorectum | rectum adenocarcinoma | Female | <65 | I/II | Unknown | Unknown | SD |
| DCAF10 | SNV | Missense_Mutation | rs767043246 | c.1178N>A | p.Arg393Gln | p.R393Q | Q5QP82 | protein_coding | tolerated(0.05) | probably_damaging(0.992) | TCGA-EI-6917-01 | Colorectum | rectum adenocarcinoma | Male | <65 | III/IV | Chemotherapy | 5fluorouracil+oxaciplatina+l-folinian | SD |
| DCAF10 | insertion | Frame_Shift_Ins | novel | c.431_432insG | p.Asn144LysfsTer7 | p.N144Kfs*7 | Q5QP82 | protein_coding | TCGA-EI-6513-01 | Colorectum | rectum adenocarcinoma | Male | <65 | III/IV | Unknown | Unknown | SD | ||
| DCAF10 | SNV | Missense_Mutation | novel | c.1487N>A | p.Arg496His | p.R496H | Q5QP82 | protein_coding | deleterious(0) | probably_damaging(0.998) | TCGA-A5-A0G2-01 | Endometrium | uterine corpus endometrioid carcinoma | Female | <65 | III/IV | Unknown | Unknown | SD |
| DCAF10 | SNV | Missense_Mutation | c.667N>T | p.Arg223Trp | p.R223W | Q5QP82 | protein_coding | deleterious(0) | probably_damaging(1) | TCGA-A5-A2K7-01 | Endometrium | uterine corpus endometrioid carcinoma | Female | <65 | I/II | Chemotherapy | taxol | SD | |
| DCAF10 | SNV | Missense_Mutation | rs772316292 | c.1564N>T | p.Arg522Cys | p.R522C | Q5QP82 | protein_coding | deleterious(0.01) | possibly_damaging(0.891) | TCGA-AP-A054-01 | Endometrium | uterine corpus endometrioid carcinoma | Female | <65 | III/IV | Chemotherapy | carboplatin | PD |
| DCAF10 | SNV | Missense_Mutation | rs763274317 | c.1352G>A | p.Arg451Gln | p.R451Q | Q5QP82 | protein_coding | tolerated(0.07) | probably_damaging(0.992) | TCGA-AP-A056-01 | Endometrium | uterine corpus endometrioid carcinoma | Female | <65 | I/II | Unknown | Unknown | SD |
| Page: 1 2 3 4 |
Top |
Related drugs of malignant transformation related genes |
| Identification of chemicals and drugs interact with genes involved in malignant transfromation |
| (DGIdb 4.0) |
| Entrez ID | Symbol | Category | Interaction Types | Drug Claim Name | Drug Name | PMIDs |
| Page: 1 |

Copyright 2023-Present -The University of Texas Health Science Center at Houston |