
|
|||||
|
 | |
| |
| |
| |
| |
| |
|
Gene: CYP20A1 |
Gene summary for CYP20A1 |
| Gene information | Species | Human | Gene symbol | CYP20A1 | Gene ID | 57404 |
| Gene name | cytochrome P450 family 20 subfamily A member 1 | |
| Gene Alias | CYP-M | |
| Cytomap | 2q33.2 | |
| Gene Type | protein-coding | GO ID | GO:0005575 | UniProtAcc | Q6UW02 |
Top |
Malignant transformation analysis |
| Identification of the aberrant gene expression in precancerous and cancerous lesions by comparing the gene expression of stem-like cells in diseased tissues with normal stem cells |
| Entrez ID | Symbol | Replicates | Species | Organ | Tissue | Adj P-value | Log2FC | Malignancy |
| 57404 | CYP20A1 | P22T-E | Human | Esophagus | ESCC | 1.46e-16 | 2.53e-01 | 0.1236 |
| 57404 | CYP20A1 | P23T-E | Human | Esophagus | ESCC | 6.72e-19 | 5.23e-01 | 0.108 |
| 57404 | CYP20A1 | P24T-E | Human | Esophagus | ESCC | 7.33e-19 | 3.22e-01 | 0.1287 |
| 57404 | CYP20A1 | P26T-E | Human | Esophagus | ESCC | 4.81e-17 | 2.33e-01 | 0.1276 |
| 57404 | CYP20A1 | P27T-E | Human | Esophagus | ESCC | 1.68e-29 | 5.68e-01 | 0.1055 |
| 57404 | CYP20A1 | P28T-E | Human | Esophagus | ESCC | 4.67e-12 | 2.49e-01 | 0.1149 |
| 57404 | CYP20A1 | P30T-E | Human | Esophagus | ESCC | 2.10e-13 | 6.63e-01 | 0.137 |
| 57404 | CYP20A1 | P31T-E | Human | Esophagus | ESCC | 1.21e-22 | 4.17e-01 | 0.1251 |
| 57404 | CYP20A1 | P32T-E | Human | Esophagus | ESCC | 8.07e-31 | 4.64e-01 | 0.1666 |
| 57404 | CYP20A1 | P36T-E | Human | Esophagus | ESCC | 1.41e-18 | 4.48e-01 | 0.1187 |
| 57404 | CYP20A1 | P37T-E | Human | Esophagus | ESCC | 1.37e-11 | 3.05e-01 | 0.1371 |
| 57404 | CYP20A1 | P39T-E | Human | Esophagus | ESCC | 1.79e-23 | 3.23e-01 | 0.0894 |
| 57404 | CYP20A1 | P40T-E | Human | Esophagus | ESCC | 1.63e-05 | 2.34e-01 | 0.109 |
| 57404 | CYP20A1 | P42T-E | Human | Esophagus | ESCC | 1.69e-17 | 6.44e-01 | 0.1175 |
| 57404 | CYP20A1 | P44T-E | Human | Esophagus | ESCC | 6.82e-15 | 2.71e-01 | 0.1096 |
| 57404 | CYP20A1 | P47T-E | Human | Esophagus | ESCC | 6.80e-12 | 1.41e-01 | 0.1067 |
| 57404 | CYP20A1 | P48T-E | Human | Esophagus | ESCC | 5.99e-26 | 3.82e-01 | 0.0959 |
| 57404 | CYP20A1 | P49T-E | Human | Esophagus | ESCC | 8.99e-06 | 9.55e-01 | 0.1768 |
| 57404 | CYP20A1 | P52T-E | Human | Esophagus | ESCC | 3.77e-27 | 5.15e-01 | 0.1555 |
| 57404 | CYP20A1 | P54T-E | Human | Esophagus | ESCC | 3.58e-29 | 7.55e-01 | 0.0975 |
| Page: 1 2 3 4 5 6 7 |
| Tissue | Expression Dynamics | Abbreviation |
| Colorectum (GSE201348) |  | FAP: Familial adenomatous polyposis |
| CRC: Colorectal cancer | ||
| Colorectum (HTA11) | 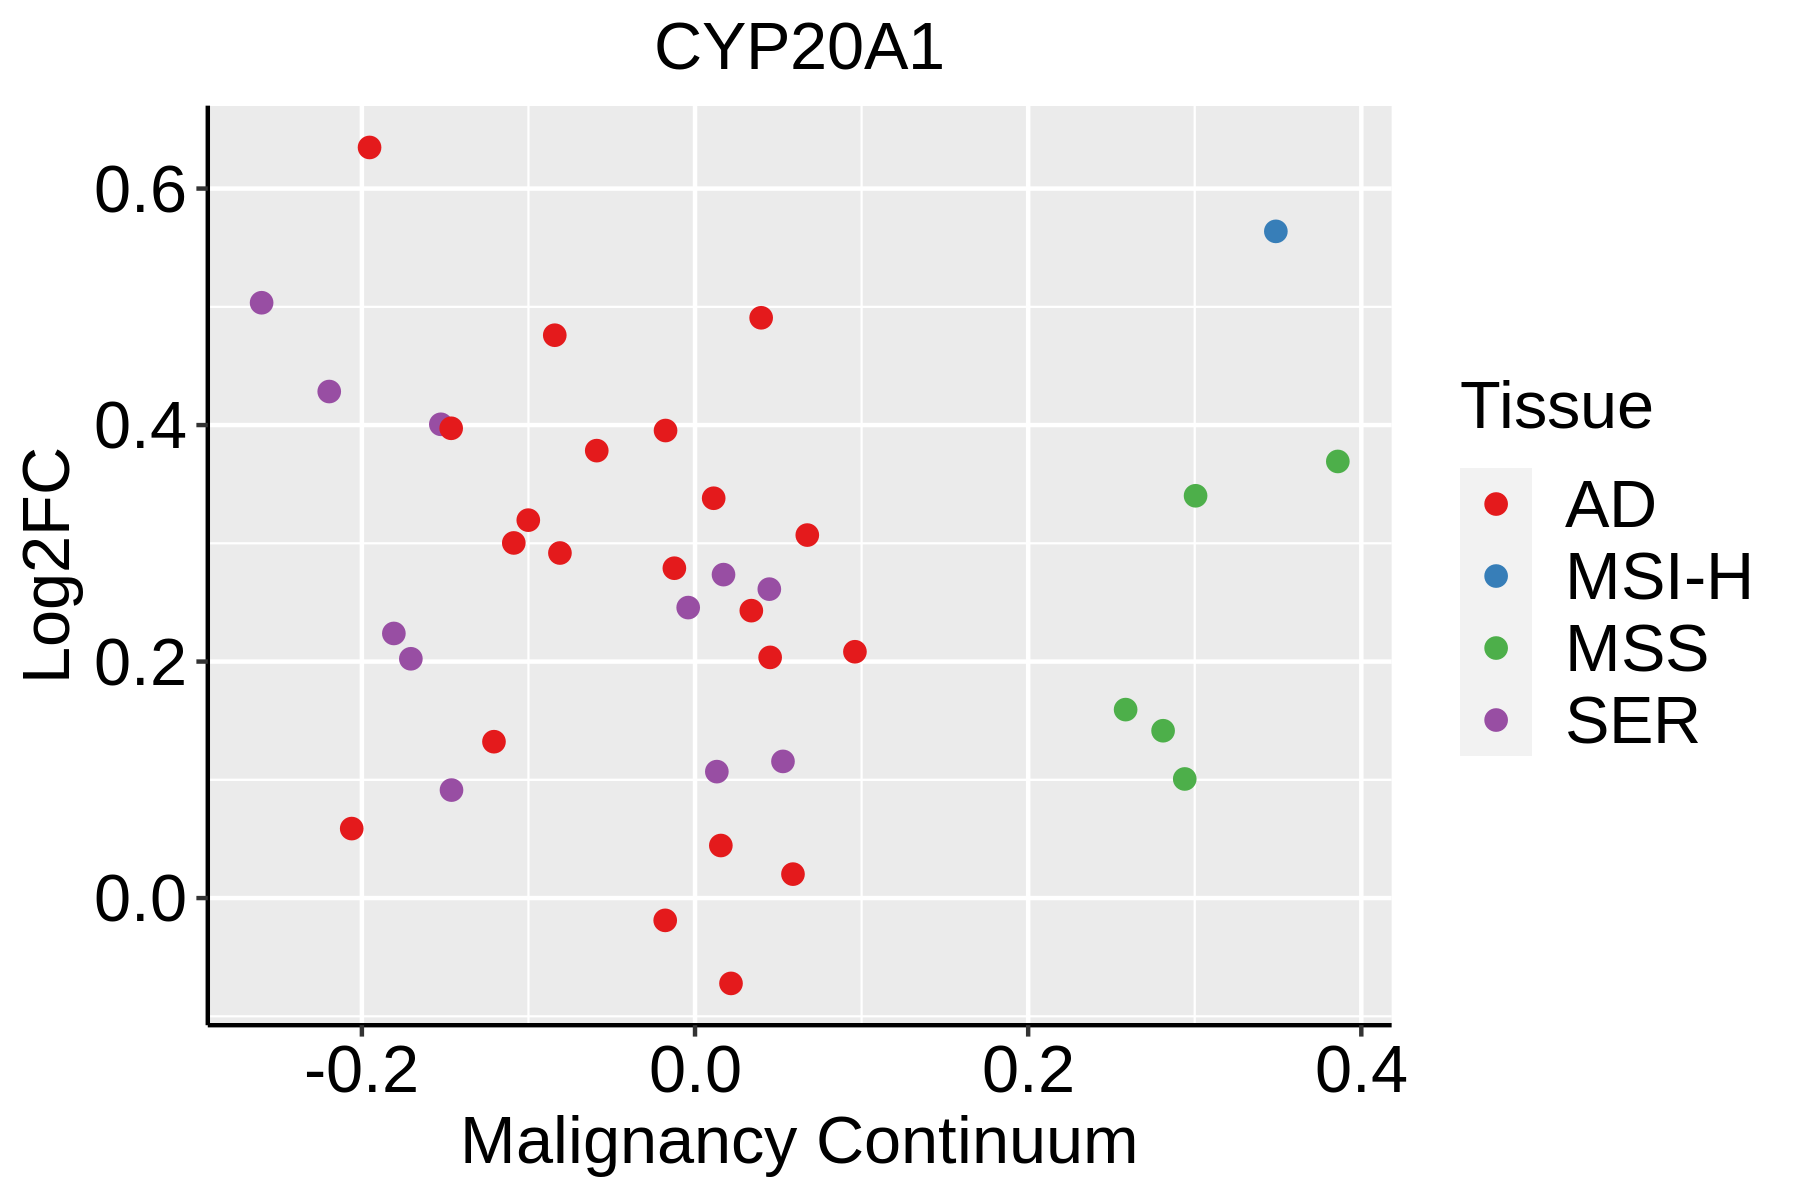 | AD: Adenomas |
| SER: Sessile serrated lesions | ||
| MSI-H: Microsatellite-high colorectal cancer | ||
| MSS: Microsatellite stable colorectal cancer | ||
| Esophagus |  | ESCC: Esophageal squamous cell carcinoma |
| HGIN: High-grade intraepithelial neoplasias | ||
| LGIN: Low-grade intraepithelial neoplasias | ||
| Liver |  | HCC: Hepatocellular carcinoma |
| NAFLD: Non-alcoholic fatty liver disease | ||
| Oral Cavity | 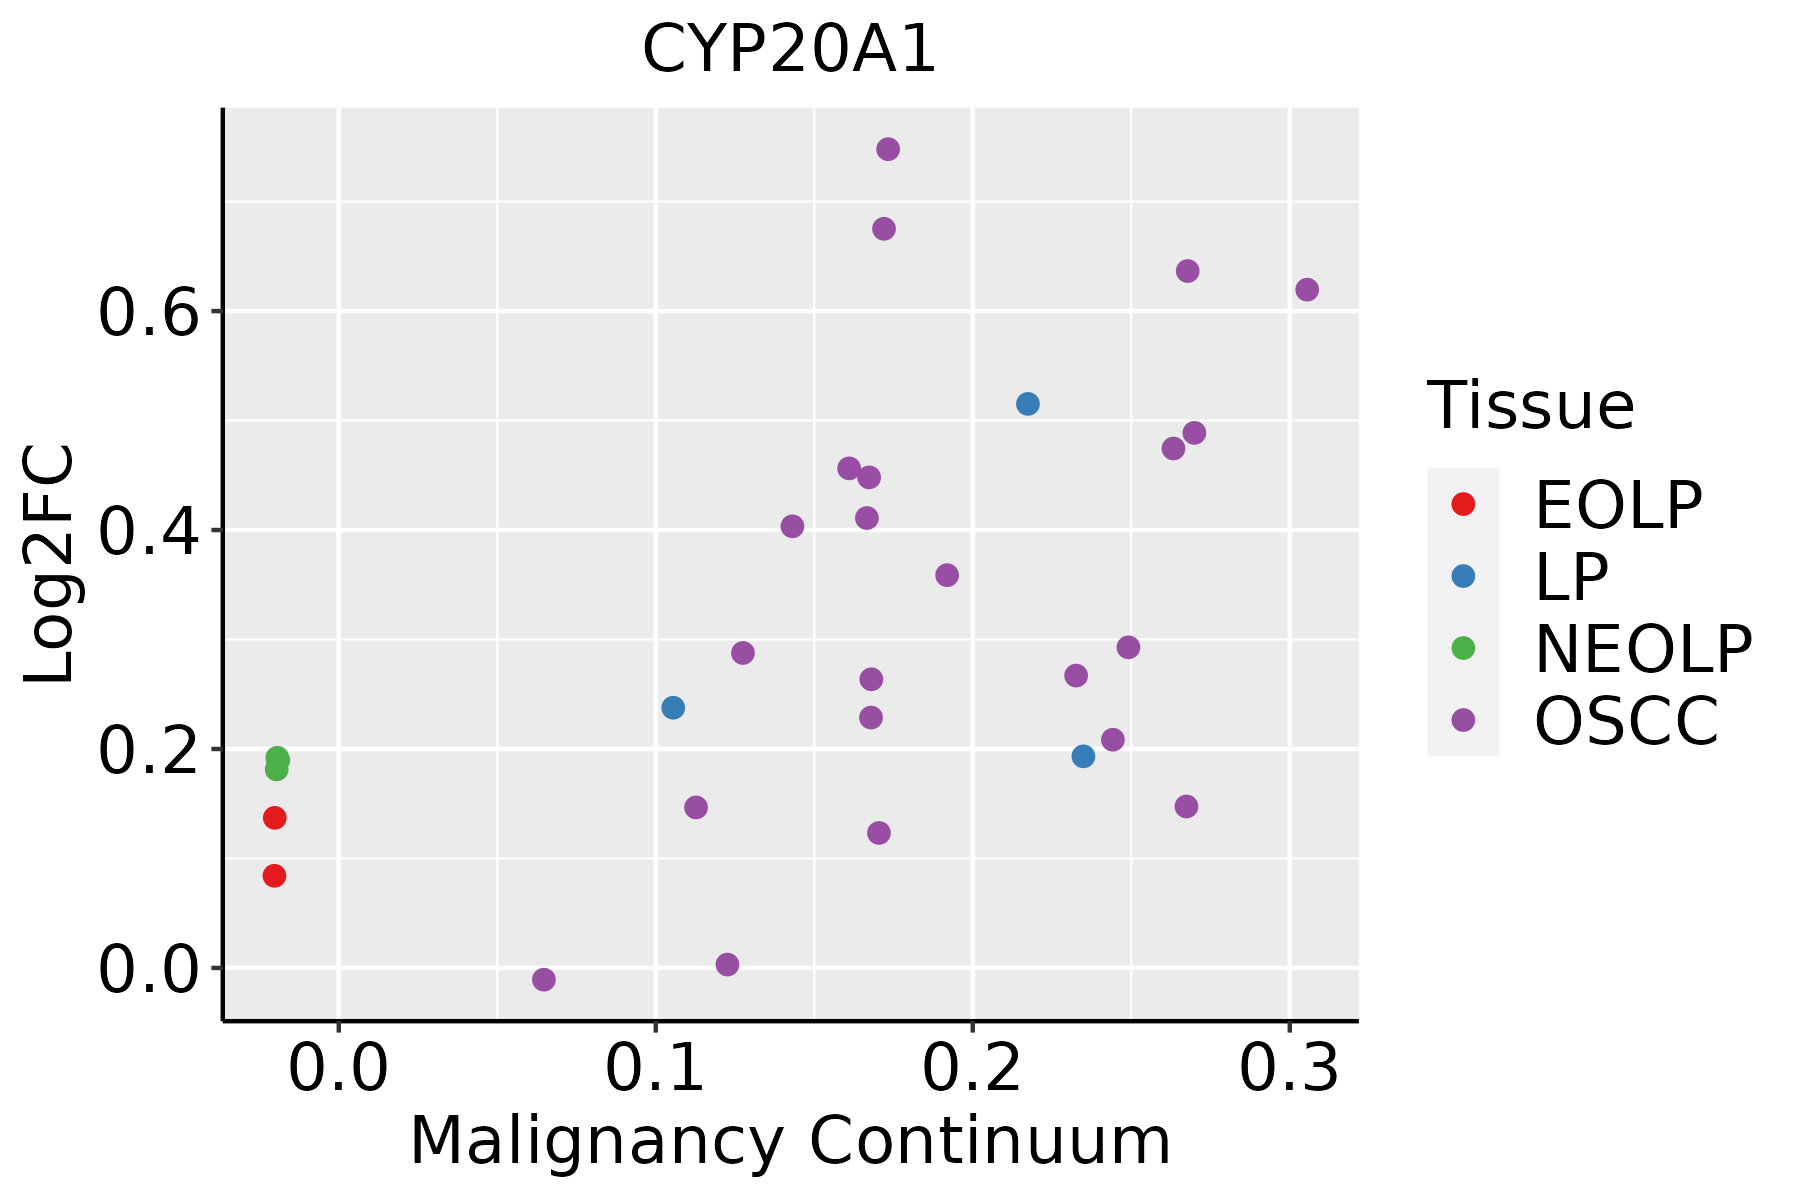 | EOLP: Erosive Oral lichen planus |
| LP: leukoplakia | ||
| NEOLP: Non-erosive oral lichen planus | ||
| OSCC: Oral squamous cell carcinoma | ||
| Thyroid | 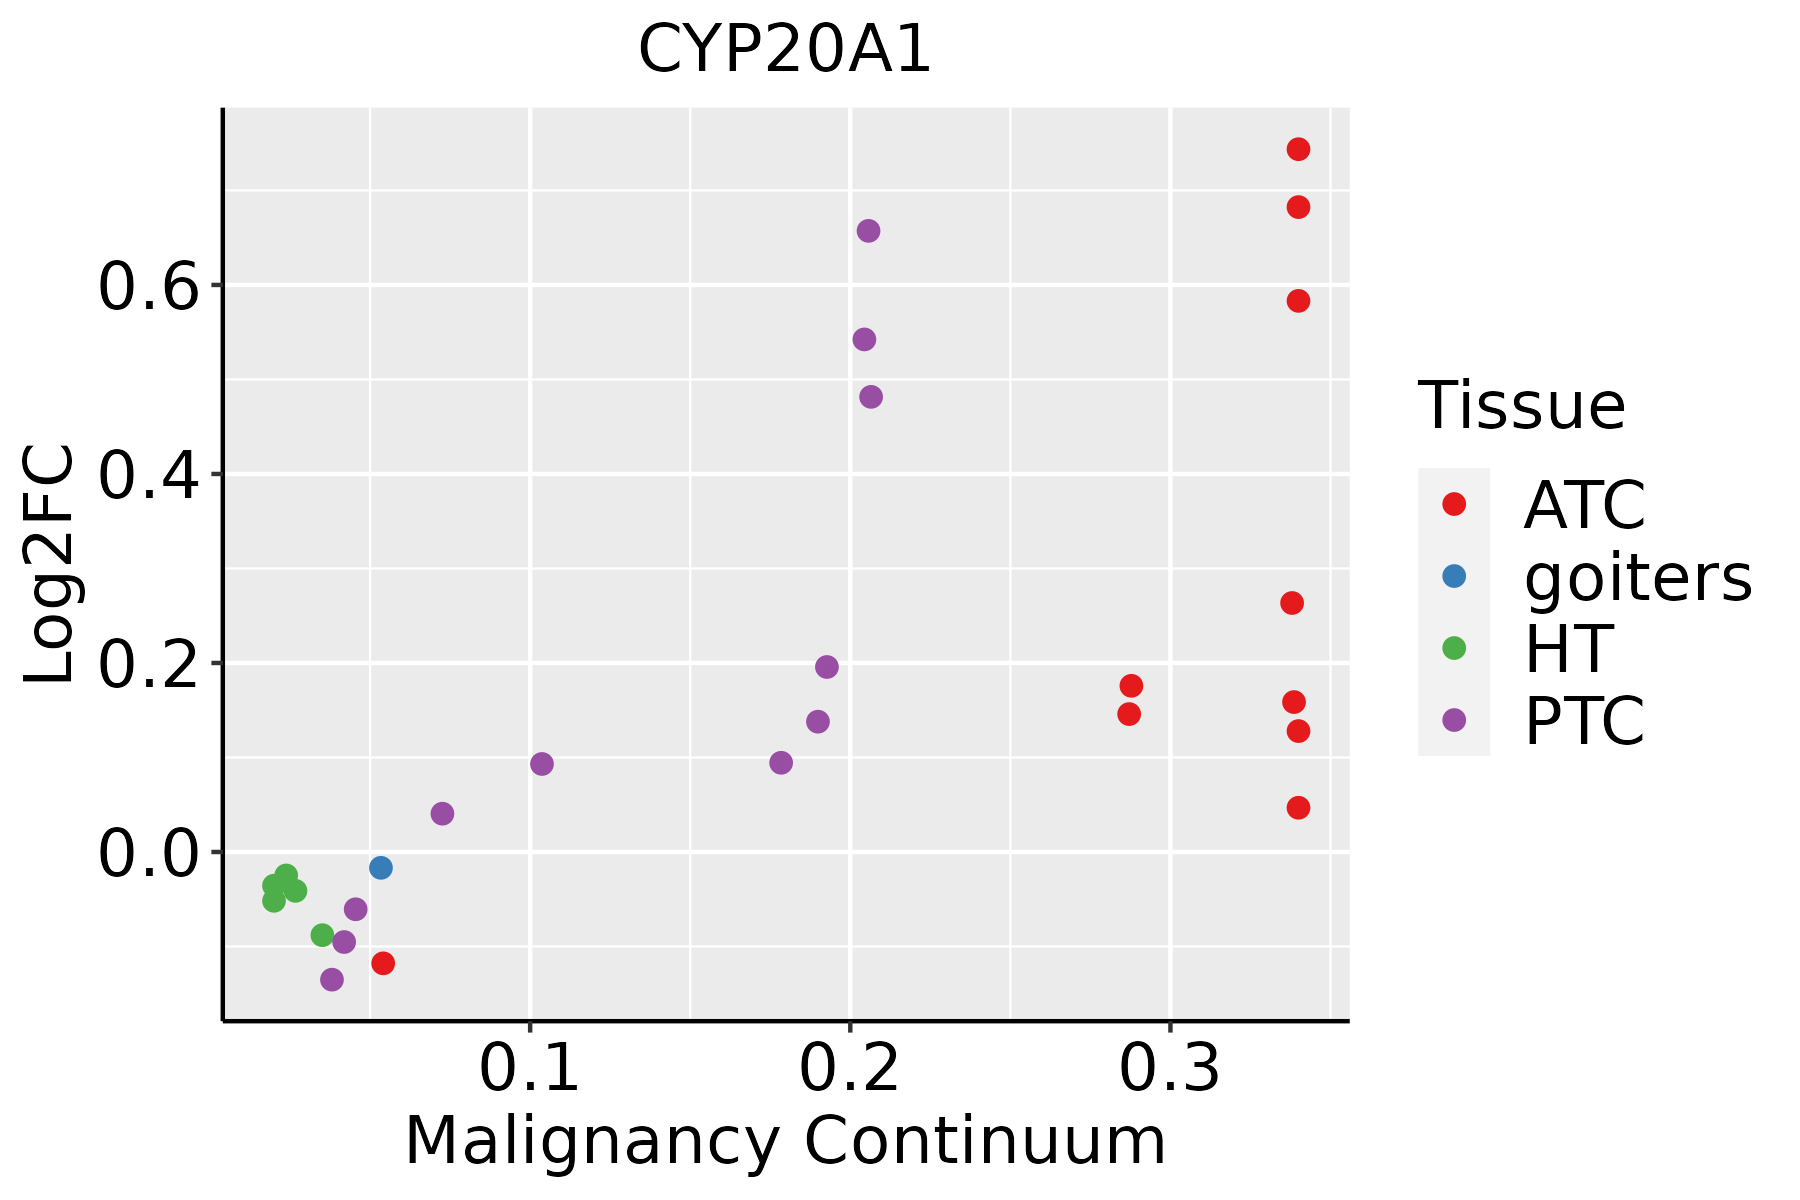 | ATC: Anaplastic thyroid cancer |
| HT: Hashimoto's thyroiditis | ||
| PTC: Papillary thyroid cancer |
| ∗log2FC in expression of this searched gene in stem-like cells from each diseased tissue sample relative to stem-like cells in normal samples in each tissue plotted against the malignancy continuum. Samples are colored based on if they are from different disease stage. |
Top |
Malignant transformation related pathway analysis |
| Find out the enriched GO biological processes and KEGG pathways involved in transition from healthy to precancer to cancer |
| Tissue | Disease Stage | Enriched GO biological Processes |
| Colorectum | AD |  |
| Colorectum | SER |  |
| Colorectum | MSS |  |
| Colorectum | MSI-H |  |
| Colorectum | FAP |  |
| ∗Top 15 enriched GO BP terms are showed in the bar plot of each disease state in each tissue. Each row represents a significant GO biological process which is colored according to the -log10(p.adjust). |
| Page: 1 2 3 4 5 6 7 8 9 |
| GO ID | Tissue | Disease Stage | Description | Gene Ratio | Bg Ratio | pvalue | p.adjust | Count |
| Page: 1 |
| Pathway ID | Tissue | Disease Stage | Description | Gene Ratio | Bg Ratio | pvalue | p.adjust | qvalue | Count |
| Page: 1 |
Top |
Cell-cell communication analysis |
| Identification of potential cell-cell interactions between two cell types and their ligand-receptor pairs for different disease states |
| Ligand | Receptor | LRpair | Pathway | Tissue | Disease Stage |
| Page: 1 |
Top |
Single-cell gene regulatory network inference analysis |
| Find out the significant the regulons (TFs) and the target genes of each regulon across cell types for different disease states |
| TF | Cell Type | Tissue | Disease Stage | Target Gene | RSS | Regulon Activity |
| ∗The dot plots of a searched regulon are shown for all cell subpopulations in each disease state of each tissue based on the regulon specific score inferred using pySCENIC and by calculating the average expression. |
| Page: 1 |
Top |
Somatic mutation of malignant transformation related genes |
| Annotation of somatic variants for genes involved in malignant transformation |
| Hugo Symbol | Variant Class | Variant Classification | dbSNP RS | HGVSc | HGVSp | HGVSp Short | SWISSPROT | BIOTYPE | SIFT | PolyPhen | Tumor Sample Barcode | Tissue | Histology | Sex | Age | Stage | Therapy Types | Drugs | Outcome |
| CYP20A1 | SNV | Missense_Mutation | c.401N>T | p.Ser134Phe | p.S134F | Q6UW02 | protein_coding | deleterious(0.01) | benign(0.034) | TCGA-BH-A0DX-01 | Breast | breast invasive carcinoma | Female | <65 | I/II | Chemotherapy | taxotere | CR | |
| CYP20A1 | SNV | Missense_Mutation | c.632N>G | p.Asp211Gly | p.D211G | Q6UW02 | protein_coding | tolerated(0.16) | benign(0.02) | TCGA-BH-A0E7-01 | Breast | breast invasive carcinoma | Female | >=65 | I/II | Hormone Therapy | arimidex | SD | |
| CYP20A1 | SNV | Missense_Mutation | novel | c.710A>G | p.Asn237Ser | p.N237S | Q6UW02 | protein_coding | tolerated(0.32) | benign(0) | TCGA-2W-A8YY-01 | Cervix | cervical & endocervical cancer | Female | <65 | I/II | Chemotherapy | cisplatin | CR |
| CYP20A1 | SNV | Missense_Mutation | c.534N>C | p.Gln178His | p.Q178H | Q6UW02 | protein_coding | deleterious(0.04) | benign(0.01) | TCGA-DR-A0ZM-01 | Cervix | cervical & endocervical cancer | Female | <65 | III/IV | Unspecific | Cisplatin | SD | |
| CYP20A1 | SNV | Missense_Mutation | c.1255N>G | p.Thr419Ala | p.T419A | Q6UW02 | protein_coding | tolerated(1) | benign(0.003) | TCGA-AA-3672-01 | Colorectum | colon adenocarcinoma | Female | >=65 | III/IV | Unknown | Unknown | SD | |
| CYP20A1 | SNV | Missense_Mutation | c.1175N>C | p.Glu392Ala | p.E392A | Q6UW02 | protein_coding | deleterious(0.05) | benign(0.098) | TCGA-AA-3856-01 | Colorectum | colon adenocarcinoma | Male | <65 | I/II | Unknown | Unknown | SD | |
| CYP20A1 | SNV | Missense_Mutation | rs778631685 | c.484N>A | p.Val162Met | p.V162M | Q6UW02 | protein_coding | deleterious(0.03) | benign(0.315) | TCGA-AY-6197-01 | Colorectum | colon adenocarcinoma | Male | <65 | I/II | Unknown | Unknown | SD |
| CYP20A1 | SNV | Missense_Mutation | novel | c.157N>G | p.Ser53Gly | p.S53G | Q6UW02 | protein_coding | tolerated(0.06) | possibly_damaging(0.779) | TCGA-CA-6717-01 | Colorectum | colon adenocarcinoma | Male | <65 | I/II | Chemotherapy | oxaliplatin | CR |
| CYP20A1 | SNV | Missense_Mutation | c.1058N>A | p.Ile353Asn | p.I353N | Q6UW02 | protein_coding | deleterious(0) | possibly_damaging(0.748) | TCGA-CK-4951-01 | Colorectum | colon adenocarcinoma | Female | >=65 | I/II | Unknown | Unknown | PD | |
| CYP20A1 | SNV | Missense_Mutation | c.58C>G | p.Leu20Val | p.L20V | Q6UW02 | protein_coding | tolerated(0.11) | benign(0.246) | TCGA-D5-6537-01 | Colorectum | colon adenocarcinoma | Male | <65 | III/IV | Unknown | Unknown | PD |
| Page: 1 2 3 4 5 6 |
Top |
Related drugs of malignant transformation related genes |
| Identification of chemicals and drugs interact with genes involved in malignant transfromation |
| (DGIdb 4.0) |
| Entrez ID | Symbol | Category | Interaction Types | Drug Claim Name | Drug Name | PMIDs |
| 57404 | CYP20A1 | CYTOCHROME P450, DRUGGABLE GENOME, ENZYME | MBC | 9347928 |
| Page: 1 |

Copyright 2023-Present -The University of Texas Health Science Center at Houston |