
|
|||||
|
 | |
| |
| |
| |
| |
| |
|
Gene: CREB3L1 |
Gene summary for CREB3L1 |
| Gene information | Species | Human | Gene symbol | CREB3L1 | Gene ID | 90993 |
| Gene name | cAMP responsive element binding protein 3 like 1 | |
| Gene Alias | OASIS | |
| Cytomap | 11p11.2 | |
| Gene Type | protein-coding | GO ID | GO:0000122 | UniProtAcc | B2RA75 |
Top |
Malignant transformation analysis |
| Identification of the aberrant gene expression in precancerous and cancerous lesions by comparing the gene expression of stem-like cells in diseased tissues with normal stem cells |
| Entrez ID | Symbol | Replicates | Species | Organ | Tissue | Adj P-value | Log2FC | Malignancy |
| 90993 | CREB3L1 | P94T-E | Human | Esophagus | ESCC | 3.37e-08 | 1.23e+00 | 0.0879 |
| 90993 | CREB3L1 | P104T-E | Human | Esophagus | ESCC | 5.11e-09 | 1.16e+00 | 0.0931 |
| 90993 | CREB3L1 | P127T-E | Human | Esophagus | ESCC | 8.85e-03 | 2.62e-01 | 0.0826 |
| 90993 | CREB3L1 | P128T-E | Human | Esophagus | ESCC | 1.00e-24 | 1.00e+00 | 0.1241 |
| 90993 | CREB3L1 | 047563_1562-all-cells | Human | Prostate | BPH | 2.69e-03 | -1.12e-01 | 0.0791 |
| 90993 | CREB3L1 | Dong_P1 | Human | Prostate | Tumor | 1.49e-24 | 3.36e-01 | 0.035 |
| 90993 | CREB3L1 | Dong_P3 | Human | Prostate | Tumor | 3.55e-05 | 5.73e-02 | 0.0278 |
| 90993 | CREB3L1 | Dong_P4 | Human | Prostate | Tumor | 1.53e-04 | 3.27e-01 | 0.0292 |
| 90993 | CREB3L1 | GSM5353236_PA_PR5251_T1_S7_L001 | Human | Prostate | Tumor | 2.28e-08 | 8.18e-01 | 0.1608 |
| 90993 | CREB3L1 | GSM5353240_PA_PR5254_T1_S15_L001 | Human | Prostate | Tumor | 5.98e-03 | 3.97e-01 | 0.1575 |
| 90993 | CREB3L1 | ATC08 | Human | Thyroid | ATC | 1.25e-02 | 1.41e-01 | 0.0541 |
| 90993 | CREB3L1 | ATC09 | Human | Thyroid | ATC | 8.38e-13 | 4.76e-01 | 0.2871 |
| 90993 | CREB3L1 | ATC11 | Human | Thyroid | ATC | 1.80e-12 | 1.06e+00 | 0.3386 |
| 90993 | CREB3L1 | ATC12 | Human | Thyroid | ATC | 1.70e-34 | 8.87e-01 | 0.34 |
| 90993 | CREB3L1 | ATC13 | Human | Thyroid | ATC | 8.02e-68 | 1.48e+00 | 0.34 |
| 90993 | CREB3L1 | ATC1 | Human | Thyroid | ATC | 8.56e-13 | 5.34e-01 | 0.2878 |
| 90993 | CREB3L1 | ATC2 | Human | Thyroid | ATC | 8.57e-18 | 1.13e+00 | 0.34 |
| 90993 | CREB3L1 | ATC3 | Human | Thyroid | ATC | 4.50e-20 | 1.02e+00 | 0.338 |
| 90993 | CREB3L1 | ATC4 | Human | Thyroid | ATC | 1.99e-45 | 1.18e+00 | 0.34 |
| 90993 | CREB3L1 | ATC5 | Human | Thyroid | ATC | 1.11e-71 | 1.59e+00 | 0.34 |
| Page: 1 2 3 |
| Tissue | Expression Dynamics | Abbreviation |
| Colorectum (GSE201348) |  | FAP: Familial adenomatous polyposis |
| CRC: Colorectal cancer | ||
| Colorectum (HTA11) |  | AD: Adenomas |
| SER: Sessile serrated lesions | ||
| MSI-H: Microsatellite-high colorectal cancer | ||
| MSS: Microsatellite stable colorectal cancer | ||
| Esophagus | 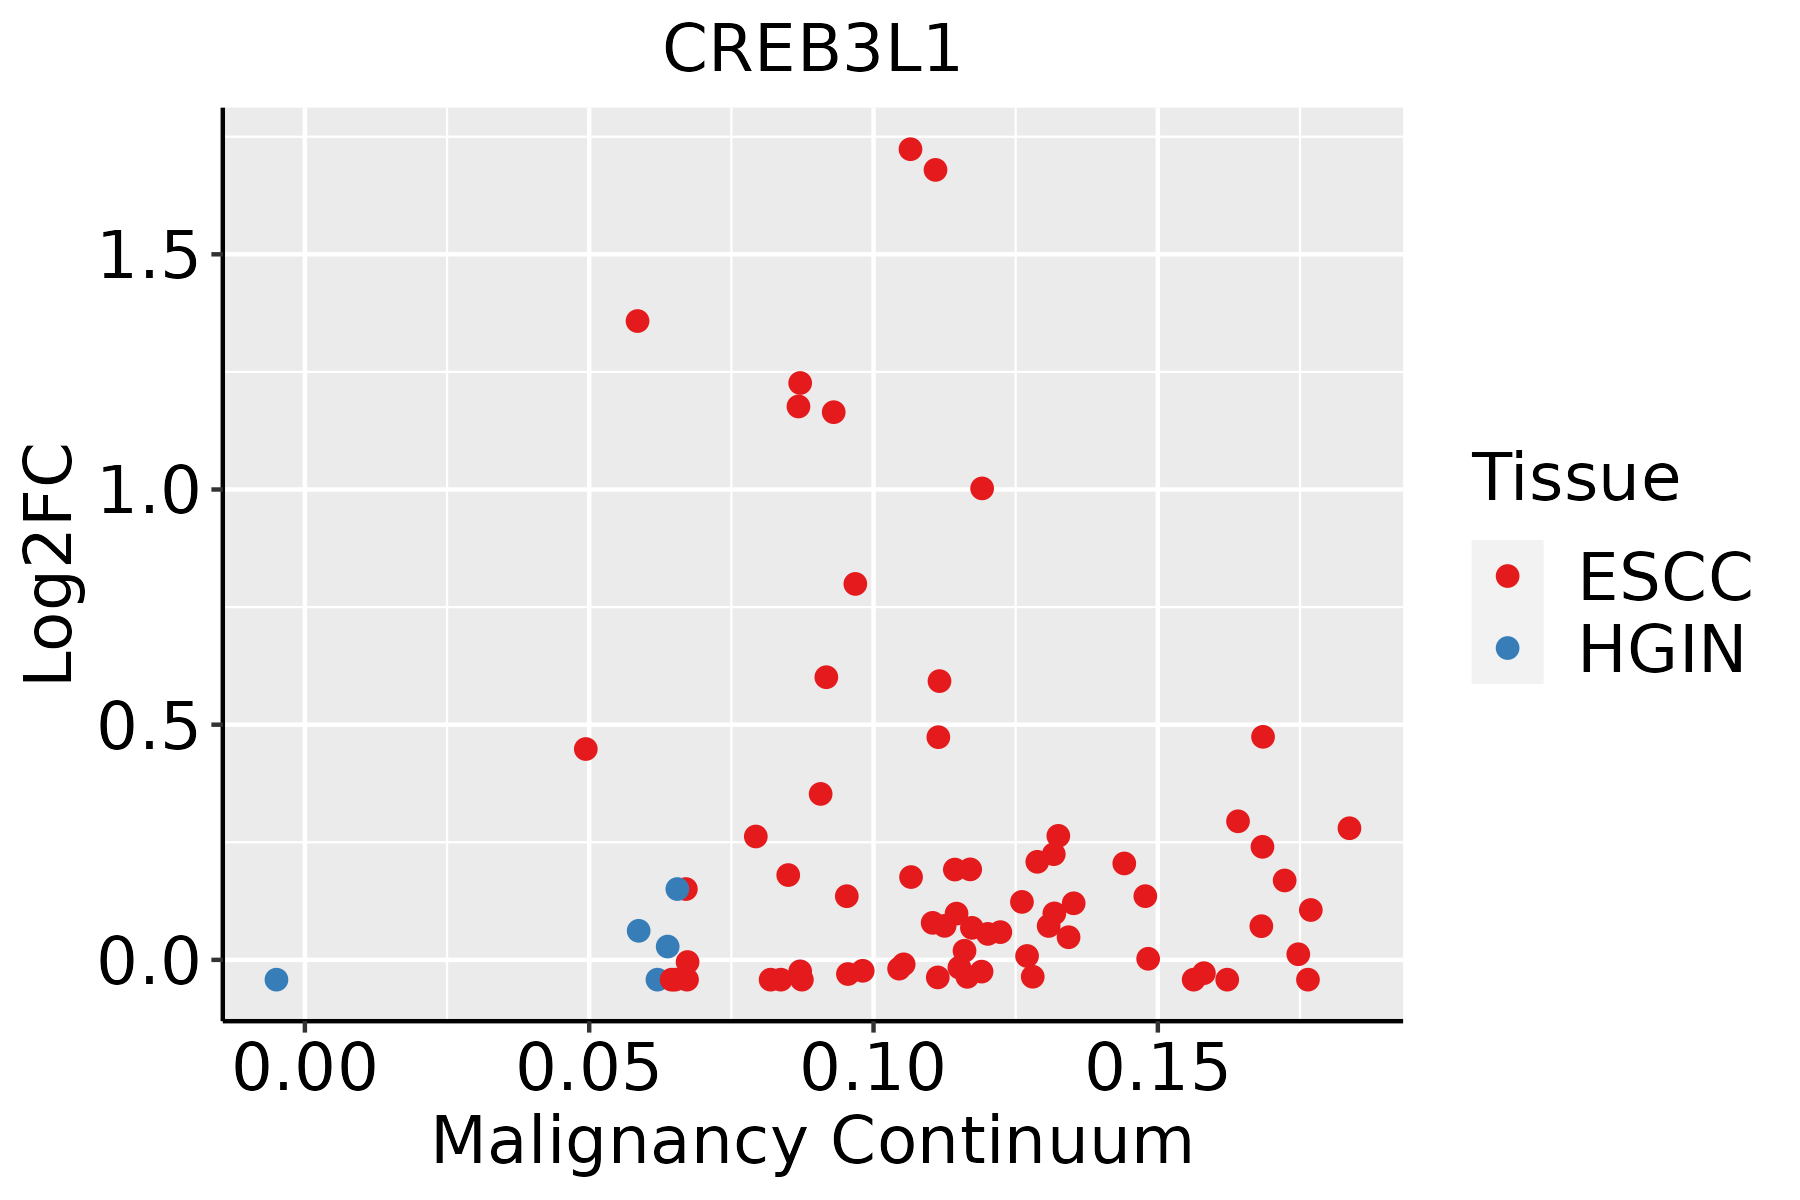 | ESCC: Esophageal squamous cell carcinoma |
| HGIN: High-grade intraepithelial neoplasias | ||
| LGIN: Low-grade intraepithelial neoplasias | ||
| Prostate | 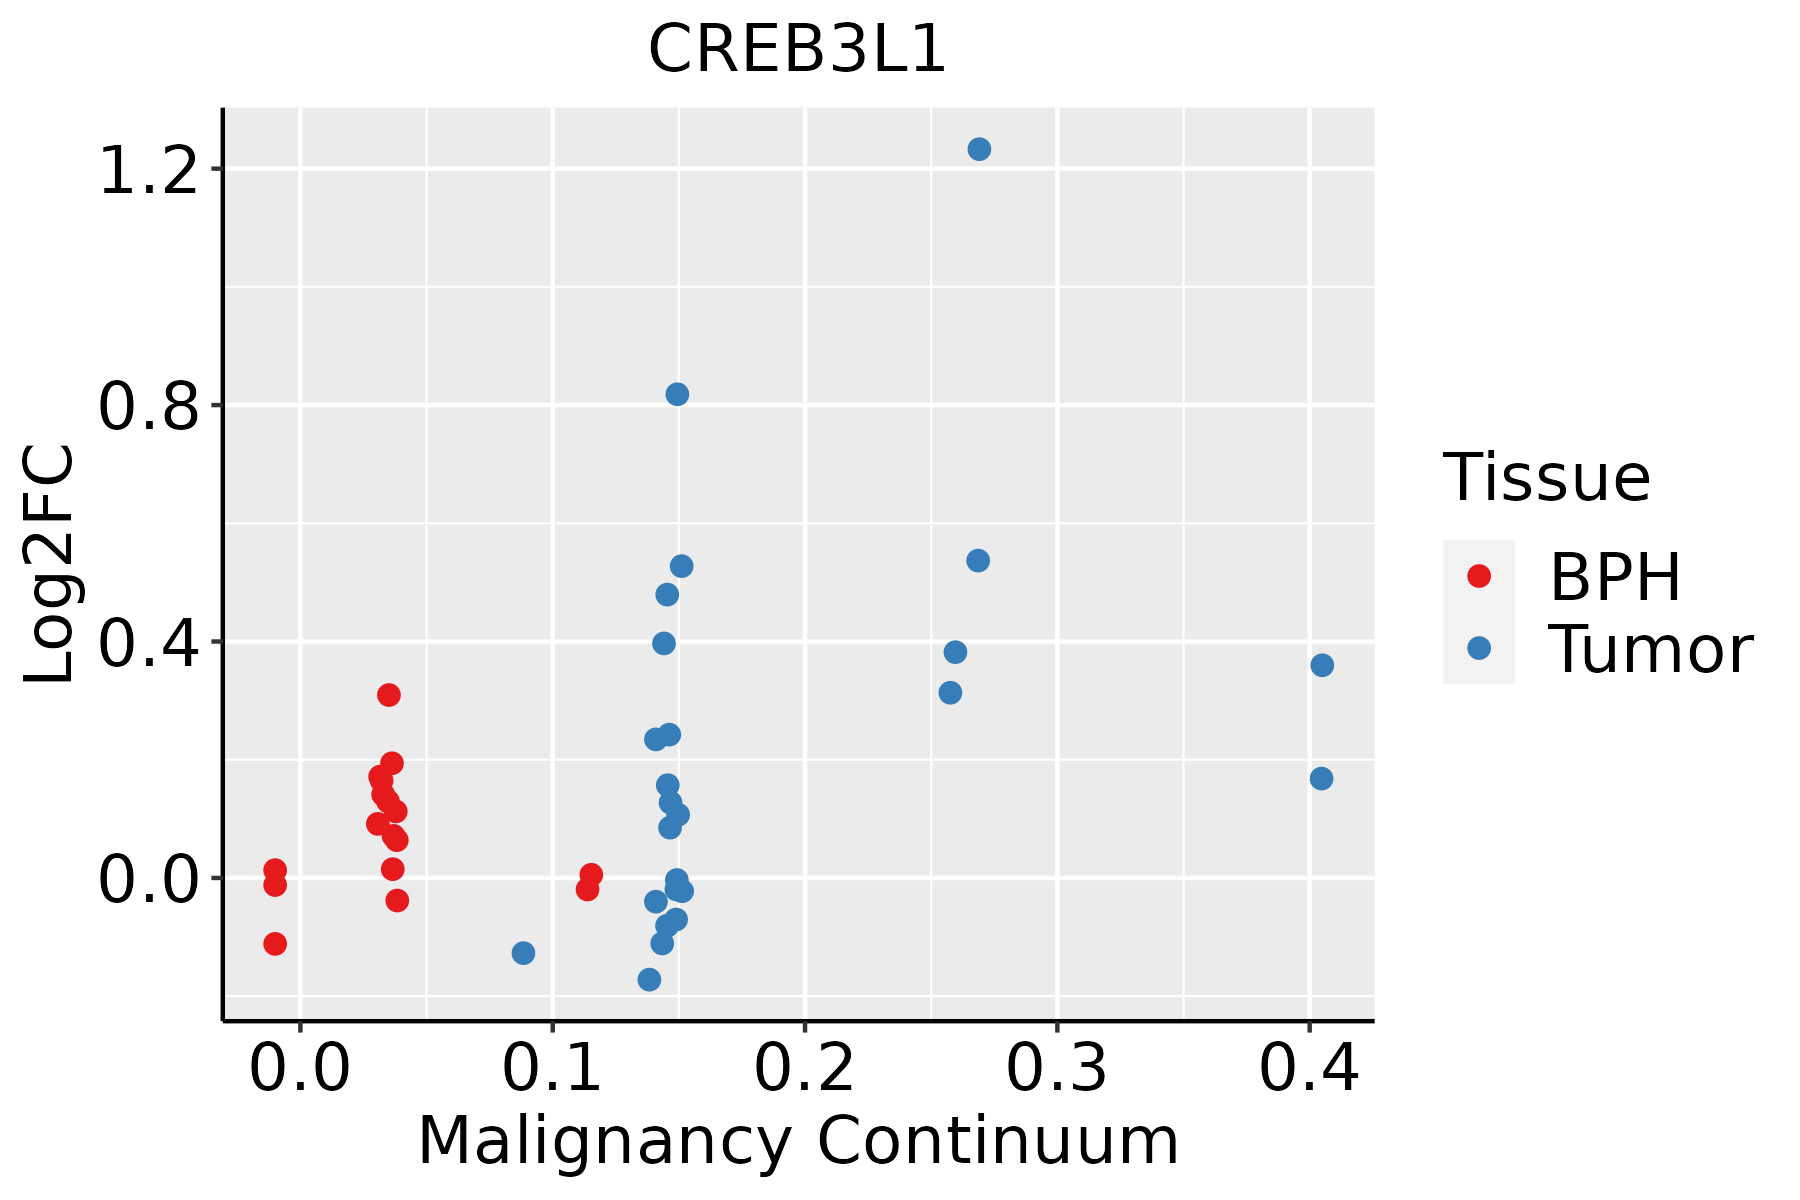 | BPH: Benign Prostatic Hyperplasia |
| Thyroid | 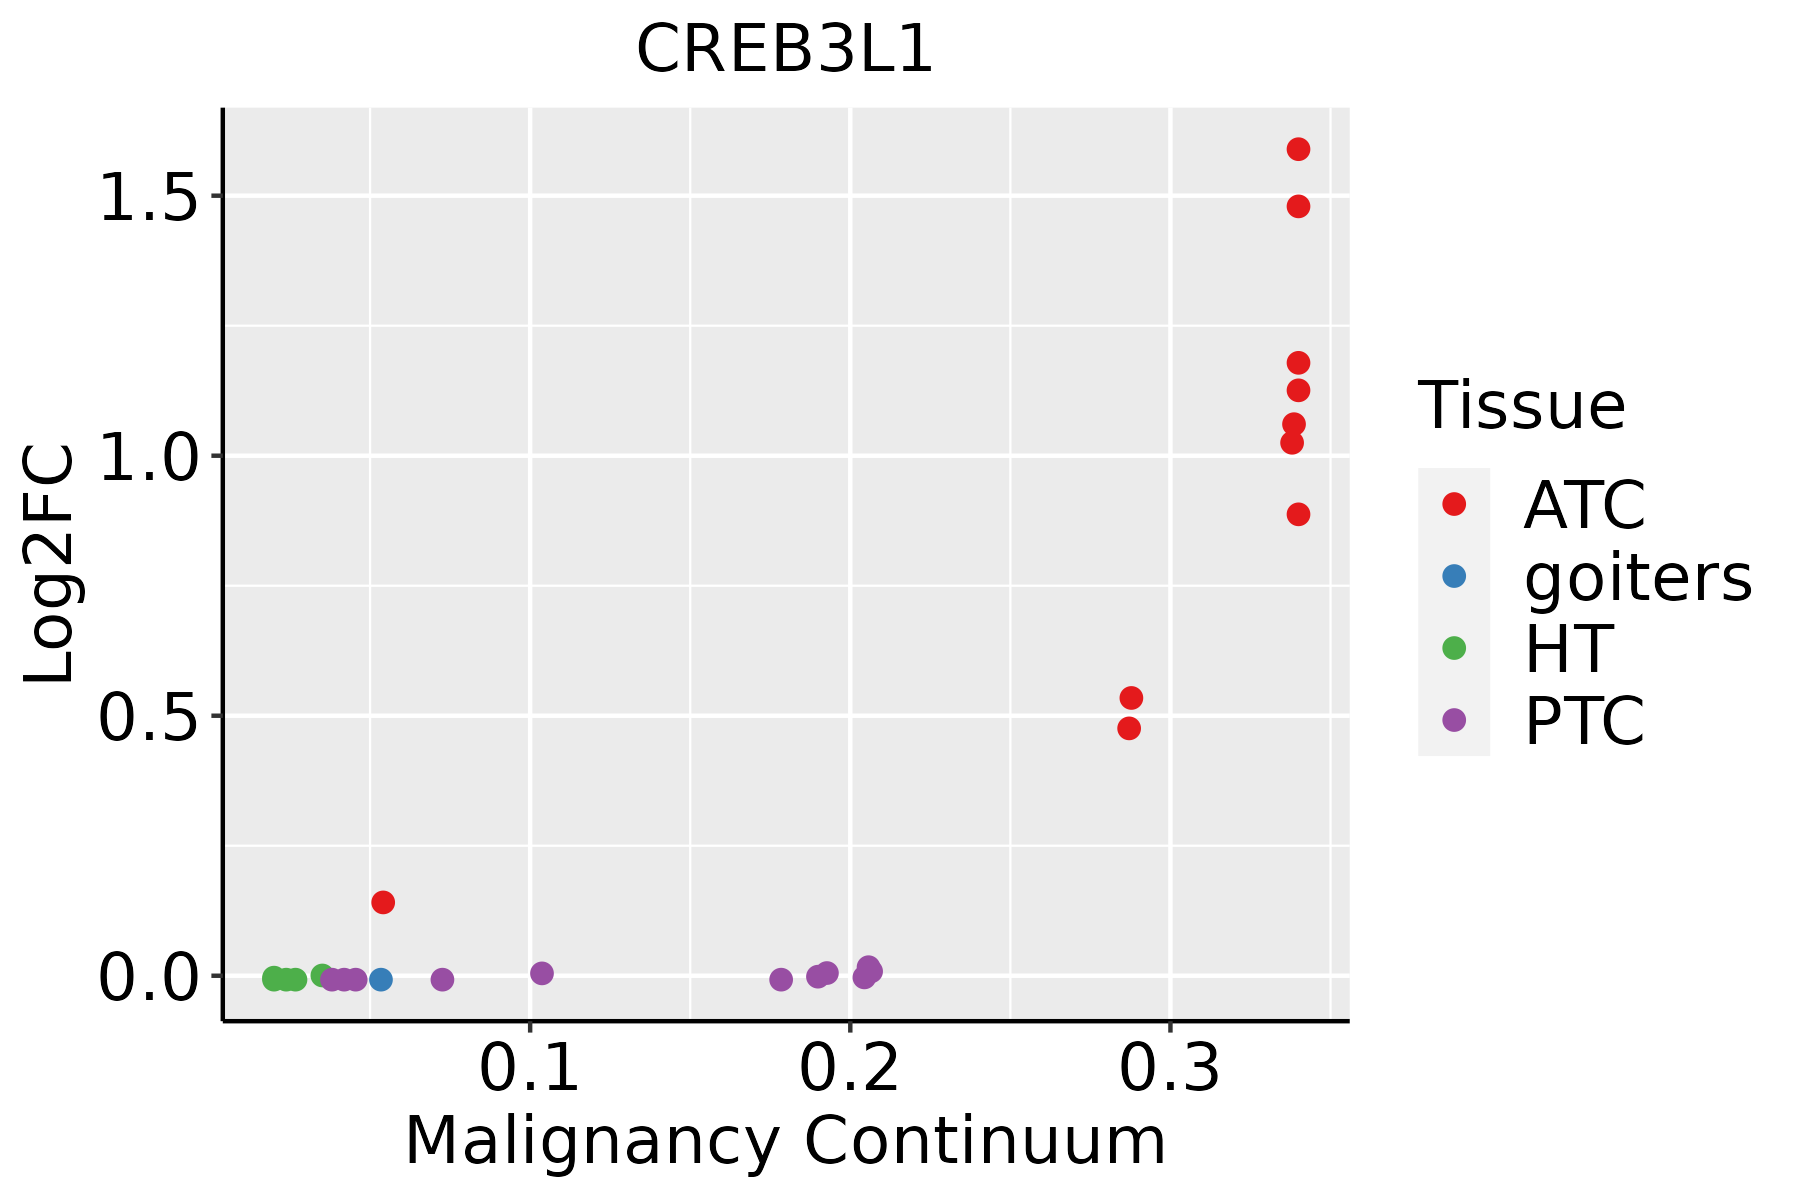 | ATC: Anaplastic thyroid cancer |
| HT: Hashimoto's thyroiditis | ||
| PTC: Papillary thyroid cancer |
| ∗log2FC in expression of this searched gene in stem-like cells from each diseased tissue sample relative to stem-like cells in normal samples in each tissue plotted against the malignancy continuum. Samples are colored based on if they are from different disease stage. |
Top |
Malignant transformation related pathway analysis |
| Find out the enriched GO biological processes and KEGG pathways involved in transition from healthy to precancer to cancer |
| Tissue | Disease Stage | Enriched GO biological Processes |
| Colorectum | AD |  |
| Colorectum | SER |  |
| Colorectum | MSS |  |
| Colorectum | MSI-H |  |
| Colorectum | FAP |  |
| ∗Top 15 enriched GO BP terms are showed in the bar plot of each disease state in each tissue. Each row represents a significant GO biological process which is colored according to the -log10(p.adjust). |
| Page: 1 2 3 4 5 6 7 8 9 |
| GO ID | Tissue | Disease Stage | Description | Gene Ratio | Bg Ratio | pvalue | p.adjust | Count |
| GO:0097193 | Colorectum | AD | intrinsic apoptotic signaling pathway | 108/3918 | 288/18723 | 6.25e-11 | 6.41e-09 | 108 |
| GO:2001242 | Colorectum | AD | regulation of intrinsic apoptotic signaling pathway | 67/3918 | 164/18723 | 4.94e-09 | 3.16e-07 | 67 |
| GO:2001233 | Colorectum | AD | regulation of apoptotic signaling pathway | 119/3918 | 356/18723 | 2.14e-08 | 1.21e-06 | 119 |
| GO:0034976 | Colorectum | AD | response to endoplasmic reticulum stress | 90/3918 | 256/18723 | 8.48e-08 | 4.28e-06 | 90 |
| GO:0070059 | Colorectum | AD | intrinsic apoptotic signaling pathway in response to endoplasmic reticulum stress | 29/3918 | 63/18723 | 7.03e-06 | 1.73e-04 | 29 |
| GO:2001234 | Colorectum | AD | negative regulation of apoptotic signaling pathway | 74/3918 | 224/18723 | 1.49e-05 | 3.18e-04 | 74 |
| GO:2001243 | Colorectum | AD | negative regulation of intrinsic apoptotic signaling pathway | 39/3918 | 98/18723 | 1.58e-05 | 3.34e-04 | 39 |
| GO:0035966 | Colorectum | AD | response to topologically incorrect protein | 54/3918 | 159/18723 | 8.85e-05 | 1.36e-03 | 54 |
| GO:0035967 | Colorectum | AD | cellular response to topologically incorrect protein | 42/3918 | 116/18723 | 1.04e-04 | 1.56e-03 | 42 |
| GO:1905897 | Colorectum | AD | regulation of response to endoplasmic reticulum stress | 32/3918 | 82/18723 | 1.37e-04 | 1.95e-03 | 32 |
| GO:0043620 | Colorectum | AD | regulation of DNA-templated transcription in response to stress | 23/3918 | 53/18723 | 1.86e-04 | 2.49e-03 | 23 |
| GO:0036003 | Colorectum | AD | positive regulation of transcription from RNA polymerase II promoter in response to stress | 13/3918 | 24/18723 | 3.45e-04 | 4.03e-03 | 13 |
| GO:0001649 | Colorectum | AD | osteoblast differentiation | 70/3918 | 229/18723 | 3.59e-04 | 4.18e-03 | 70 |
| GO:0043618 | Colorectum | AD | regulation of transcription from RNA polymerase II promoter in response to stress | 20/3918 | 47/18723 | 6.54e-04 | 6.75e-03 | 20 |
| GO:0006986 | Colorectum | AD | response to unfolded protein | 45/3918 | 137/18723 | 7.43e-04 | 7.48e-03 | 45 |
| GO:1902236 | Colorectum | AD | negative regulation of endoplasmic reticulum stress-induced intrinsic apoptotic signaling pathway | 11/3918 | 20/18723 | 8.39e-04 | 8.21e-03 | 11 |
| GO:0034620 | Colorectum | AD | cellular response to unfolded protein | 33/3918 | 96/18723 | 1.53e-03 | 1.29e-02 | 33 |
| GO:1903573 | Colorectum | AD | negative regulation of response to endoplasmic reticulum stress | 18/3918 | 44/18723 | 2.06e-03 | 1.64e-02 | 18 |
| GO:0001503 | Colorectum | AD | ossification | 106/3918 | 408/18723 | 7.68e-03 | 4.64e-02 | 106 |
| GO:20012421 | Colorectum | SER | regulation of intrinsic apoptotic signaling pathway | 59/2897 | 164/18723 | 8.42e-11 | 1.20e-08 | 59 |
| Page: 1 2 3 4 5 6 7 8 9 10 |
| Pathway ID | Tissue | Disease Stage | Description | Gene Ratio | Bg Ratio | pvalue | p.adjust | qvalue | Count |
| hsa05016 | Colorectum | AD | Huntington disease | 147/2092 | 306/8465 | 1.93e-19 | 9.26e-18 | 5.91e-18 | 147 |
| hsa04714 | Colorectum | AD | Thermogenesis | 120/2092 | 232/8465 | 2.76e-19 | 1.16e-17 | 7.37e-18 | 120 |
| hsa05020 | Colorectum | AD | Prion disease | 133/2092 | 273/8465 | 2.47e-18 | 8.29e-17 | 5.29e-17 | 133 |
| hsa04152 | Colorectum | AD | AMPK signaling pathway | 47/2092 | 121/8465 | 3.74e-04 | 2.82e-03 | 1.80e-03 | 47 |
| hsa04922 | Colorectum | AD | Glucagon signaling pathway | 41/2092 | 107/8465 | 1.18e-03 | 7.75e-03 | 4.94e-03 | 41 |
| hsa05163 | Colorectum | AD | Human cytomegalovirus infection | 75/2092 | 225/8465 | 2.00e-03 | 1.10e-02 | 7.01e-03 | 75 |
| hsa05166 | Colorectum | AD | Human T-cell leukemia virus 1 infection | 72/2092 | 222/8465 | 5.24e-03 | 2.44e-02 | 1.55e-02 | 72 |
| hsa04962 | Colorectum | AD | Vasopressin-regulated water reabsorption | 19/2092 | 44/8465 | 5.48e-03 | 2.48e-02 | 1.58e-02 | 19 |
| hsa04728 | Colorectum | AD | Dopaminergic synapse | 46/2092 | 132/8465 | 5.55e-03 | 2.48e-02 | 1.58e-02 | 46 |
| hsa04211 | Colorectum | AD | Longevity regulating pathway | 33/2092 | 89/8465 | 6.15e-03 | 2.68e-02 | 1.71e-02 | 33 |
| hsa04928 | Colorectum | AD | Parathyroid hormone synthesis, secretion and action | 38/2092 | 106/8465 | 6.60e-03 | 2.77e-02 | 1.76e-02 | 38 |
| hsa05215 | Colorectum | AD | Prostate cancer | 35/2092 | 97/8465 | 7.95e-03 | 3.13e-02 | 2.00e-02 | 35 |
| hsa050161 | Colorectum | AD | Huntington disease | 147/2092 | 306/8465 | 1.93e-19 | 9.26e-18 | 5.91e-18 | 147 |
| hsa047141 | Colorectum | AD | Thermogenesis | 120/2092 | 232/8465 | 2.76e-19 | 1.16e-17 | 7.37e-18 | 120 |
| hsa050201 | Colorectum | AD | Prion disease | 133/2092 | 273/8465 | 2.47e-18 | 8.29e-17 | 5.29e-17 | 133 |
| hsa041521 | Colorectum | AD | AMPK signaling pathway | 47/2092 | 121/8465 | 3.74e-04 | 2.82e-03 | 1.80e-03 | 47 |
| hsa049221 | Colorectum | AD | Glucagon signaling pathway | 41/2092 | 107/8465 | 1.18e-03 | 7.75e-03 | 4.94e-03 | 41 |
| hsa051631 | Colorectum | AD | Human cytomegalovirus infection | 75/2092 | 225/8465 | 2.00e-03 | 1.10e-02 | 7.01e-03 | 75 |
| hsa051661 | Colorectum | AD | Human T-cell leukemia virus 1 infection | 72/2092 | 222/8465 | 5.24e-03 | 2.44e-02 | 1.55e-02 | 72 |
| hsa049621 | Colorectum | AD | Vasopressin-regulated water reabsorption | 19/2092 | 44/8465 | 5.48e-03 | 2.48e-02 | 1.58e-02 | 19 |
| Page: 1 2 3 4 5 6 7 8 9 10 11 12 13 |
Top |
Cell-cell communication analysis |
| Identification of potential cell-cell interactions between two cell types and their ligand-receptor pairs for different disease states |
| Ligand | Receptor | LRpair | Pathway | Tissue | Disease Stage |
| Page: 1 |
Top |
Single-cell gene regulatory network inference analysis |
| Find out the significant the regulons (TFs) and the target genes of each regulon across cell types for different disease states |
| TF | Cell Type | Tissue | Disease Stage | Target Gene | RSS | Regulon Activity |
| CREB3L1 | STM | Endometrium | AEH | ACSL5,TNFRSF21,AC025580.1, etc. | 5.52e-01 |  |
| CREB3L1 | INCAF | Endometrium | ADJ | COL1A1,COL1A2,COL5A1, etc. | 6.14e-01 |  |
| CREB3L1 | INCAF | Endometrium | AEH | COL1A1,COL1A2,COL5A1, etc. | 5.92e-01 | |
| CREB3L1 | ACINAR | Pancreas | Healthy | CLPS,GATM,TC2N, etc. | 3.25e-01 |  |
| CREB3L1 | LUM | Prostate | Tumor | LINC01088,SPON2,PRKAA2, etc. | 7.49e-01 |  |
| CREB3L1 | STM | Skin | Healthy | COL6A2,SMOC2,BBX, etc. | 4.75e-01 |  |
| ∗The dot plots of a searched regulon are shown for all cell subpopulations in each disease state of each tissue based on the regulon specific score inferred using pySCENIC and by calculating the average expression. |
| Page: 1 |
Top |
Somatic mutation of malignant transformation related genes |
| Annotation of somatic variants for genes involved in malignant transformation |
| Hugo Symbol | Variant Class | Variant Classification | dbSNP RS | HGVSc | HGVSp | HGVSp Short | SWISSPROT | BIOTYPE | SIFT | PolyPhen | Tumor Sample Barcode | Tissue | Histology | Sex | Age | Stage | Therapy Types | Drugs | Outcome |
| CREB3L1 | SNV | Missense_Mutation | c.1376N>T | p.Ala459Val | p.A459V | Q96BA8 | protein_coding | tolerated_low_confidence(0.28) | benign(0) | TCGA-A8-A07U-01 | Breast | breast invasive carcinoma | Female | >=65 | III/IV | Chemotherapy | 5-fluorouracil | SD | |
| CREB3L1 | SNV | Missense_Mutation | c.960N>C | p.Lys320Asn | p.K320N | Q96BA8 | protein_coding | deleterious(0.03) | probably_damaging(0.998) | TCGA-BH-A0HP-01 | Breast | breast invasive carcinoma | Female | >=65 | III/IV | Chemotherapy | doxorubicin | SD | |
| CREB3L1 | insertion | Frame_Shift_Ins | novel | c.1297_1298insAAACCGAGGCCCAAAGAGAGTCTAT | p.Gly433GlufsTer46 | p.G433Efs*46 | Q96BA8 | protein_coding | TCGA-AR-A0TU-01 | Breast | breast invasive carcinoma | Female | <65 | I/II | Unspecific | Doxorubicin | SD | ||
| CREB3L1 | SNV | Missense_Mutation | c.403N>C | p.Glu135Gln | p.E135Q | Q96BA8 | protein_coding | tolerated(0.24) | possibly_damaging(0.709) | TCGA-IR-A3LK-01 | Cervix | cervical & endocervical cancer | Female | >=65 | I/II | Chemotherapy | cisplatin | PD | |
| CREB3L1 | SNV | Missense_Mutation | c.802C>T | p.Arg268Trp | p.R268W | Q96BA8 | protein_coding | deleterious(0) | probably_damaging(0.998) | TCGA-AA-3864-01 | Colorectum | colon adenocarcinoma | Male | >=65 | I/II | Unknown | Unknown | SD | |
| CREB3L1 | SNV | Missense_Mutation | c.1225C>A | p.Leu409Met | p.L409M | Q96BA8 | protein_coding | tolerated(0.36) | benign(0) | TCGA-AA-3864-01 | Colorectum | colon adenocarcinoma | Male | >=65 | I/II | Unknown | Unknown | SD | |
| CREB3L1 | SNV | Missense_Mutation | c.174N>A | p.Phe58Leu | p.F58L | Q96BA8 | protein_coding | tolerated(0.77) | probably_damaging(0.952) | TCGA-AA-A010-01 | Colorectum | colon adenocarcinoma | Female | <65 | I/II | Chemotherapy | folinic | CR | |
| CREB3L1 | SNV | Missense_Mutation | c.160C>A | p.Leu54Met | p.L54M | Q96BA8 | protein_coding | deleterious(0.04) | probably_damaging(0.996) | TCGA-D5-6530-01 | Colorectum | colon adenocarcinoma | Male | <65 | I/II | Unknown | Unknown | SD | |
| CREB3L1 | SNV | Missense_Mutation | rs749140671 | c.884N>A | p.Arg295Gln | p.R295Q | Q96BA8 | protein_coding | deleterious(0) | probably_damaging(0.942) | TCGA-G4-6320-01 | Colorectum | colon adenocarcinoma | Male | >=65 | III/IV | Chemotherapy | oxaliplatin | SD |
| CREB3L1 | SNV | Missense_Mutation | rs774678396 | c.1315C>T | p.Arg439Cys | p.R439C | Q96BA8 | protein_coding | tolerated(0.17) | benign(0.353) | TCGA-G4-6586-01 | Colorectum | colon adenocarcinoma | Female | >=65 | I/II | Unknown | Unknown | SD |
| Page: 1 2 3 4 |
Top |
Related drugs of malignant transformation related genes |
| Identification of chemicals and drugs interact with genes involved in malignant transfromation |
| (DGIdb 4.0) |
| Entrez ID | Symbol | Category | Interaction Types | Drug Claim Name | Drug Name | PMIDs |
| Page: 1 |

Copyright 2023-Present -The University of Texas Health Science Center at Houston |