Schematic overview of the cellular and molecular mechanisms involved in the cancer progression, including the proposed cellular and molecular mechanisms in cancer cells trajectory. AT1: alveolar type 1 cells; AT2: alveolar type 2 cells; AAH: atypical adenomatous hyperplasia; AIS: adenocarcinoma in situ; MIA: minimally invasive adenocarcinoma; IA: invasive adenocarcinoma; EMT: epithelial-mesenchymal transition

Home

Download

Statistics

Help

Contact

Center for Computational Systems Medicine
leaf

Gene summary

leaf

Malignant transformation analysis

leaf

Malignant transformation related pathway analysis

leaf

Cell-cell communication analysis

leaf

Single-cell gene regulatory network inference analysis

leaf

Somatic mutation of malignant transformation related genes

leaf

Related drugs of malignant transformation related genes

Gene: CPD

Gene summary for CPD

check button Gene summary.

Gene informationSpeciesHuman
Gene symbol

CPD

Gene ID

1362

Gene namecarboxypeptidase D
Gene AliasGP180
Cytomap17q11.2
Gene Typeprotein-coding
GO ID

GO:0006508

UniProtAcc

O75976


Top

Malignant transformation analysis

check button Identification of the aberrant gene expression in precancerous and cancerous lesions by comparing the gene expression of stem-like cells in diseased tissues with normal stem cells
check button Malignant transformation involving gene list.
Entrez IDSymbolReplicatesSpeciesOrganTissueAdj P-valueLog2FCMalignancy
1362CPDP54T-EHumanEsophagusESCC2.21e-101.99e-010.0975
1362CPDP56T-EHumanEsophagusESCC4.17e-081.28e+000.1613
1362CPDP57T-EHumanEsophagusESCC5.74e-183.72e-010.0926
1362CPDP61T-EHumanEsophagusESCC5.76e-206.14e-010.099
1362CPDP62T-EHumanEsophagusESCC2.73e-224.23e-010.1302
1362CPDP65T-EHumanEsophagusESCC1.34e-103.19e-010.0978
1362CPDP74T-EHumanEsophagusESCC2.39e-061.77e-010.1479
1362CPDP75T-EHumanEsophagusESCC1.25e-223.85e-010.1125
1362CPDP76T-EHumanEsophagusESCC9.45e-255.23e-010.1207
1362CPDP79T-EHumanEsophagusESCC1.04e-162.43e-010.1154
1362CPDP80T-EHumanEsophagusESCC1.26e-163.88e-010.155
1362CPDP82T-EHumanEsophagusESCC2.77e-127.25e-010.1072
1362CPDP83T-EHumanEsophagusESCC9.39e-269.14e-010.1738
1362CPDP91T-EHumanEsophagusESCC3.26e-077.21e-010.1828
1362CPDP94T-EHumanEsophagusESCC3.86e-027.61e-010.0879
1362CPDP104T-EHumanEsophagusESCC8.90e-084.50e-010.0931
1362CPDP107T-EHumanEsophagusESCC2.81e-133.12e-010.171
1362CPDP126T-EHumanEsophagusESCC7.94e-069.89e-010.1125
1362CPDP127T-EHumanEsophagusESCC1.17e-133.13e-010.0826
1362CPDP128T-EHumanEsophagusESCC1.44e-291.15e+000.1241
Page: 1 2 3 4 5 6 7 

check button Transcriptomic changes along malignancy continuum.
TissueExpression DynamicsAbbreviation
EsophagusThe image shows the transcriptomic changes along malignancy continuum.log2FC in expression of this searched gene in stem-like cells from each diseased tissue sample relative to stem-like cells in normal samples in each tissue plotted against the malignancy continuum. Samples are colored based on if they are from different disease stage.
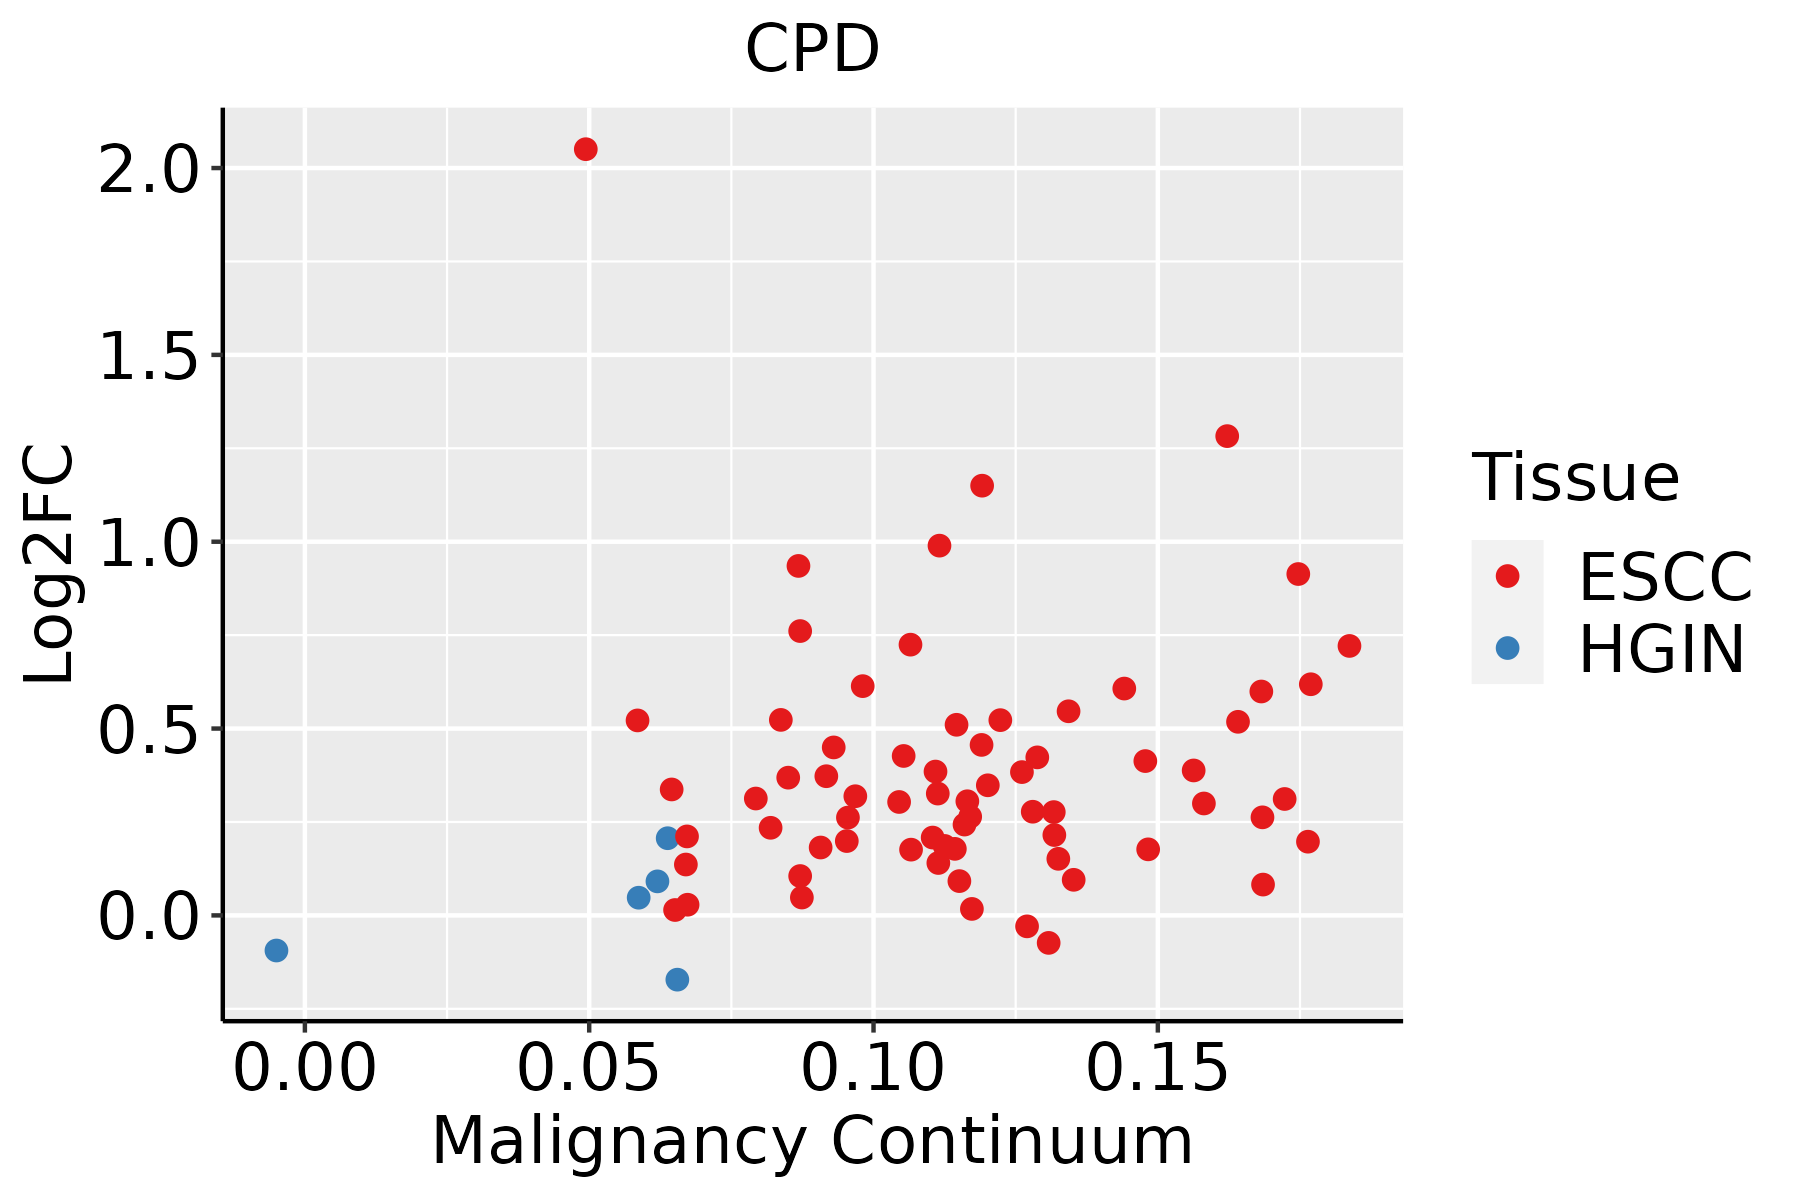
ESCC: Esophageal squamous cell carcinoma
HGIN: High-grade intraepithelial neoplasias
LGIN: Low-grade intraepithelial neoplasias
LiverThe image shows the transcriptomic changes along malignancy continuum.log2FC in expression of this searched gene in stem-like cells from each diseased tissue sample relative to stem-like cells in normal samples in each tissue plotted against the malignancy continuum. Samples are colored based on if they are from different disease stage.
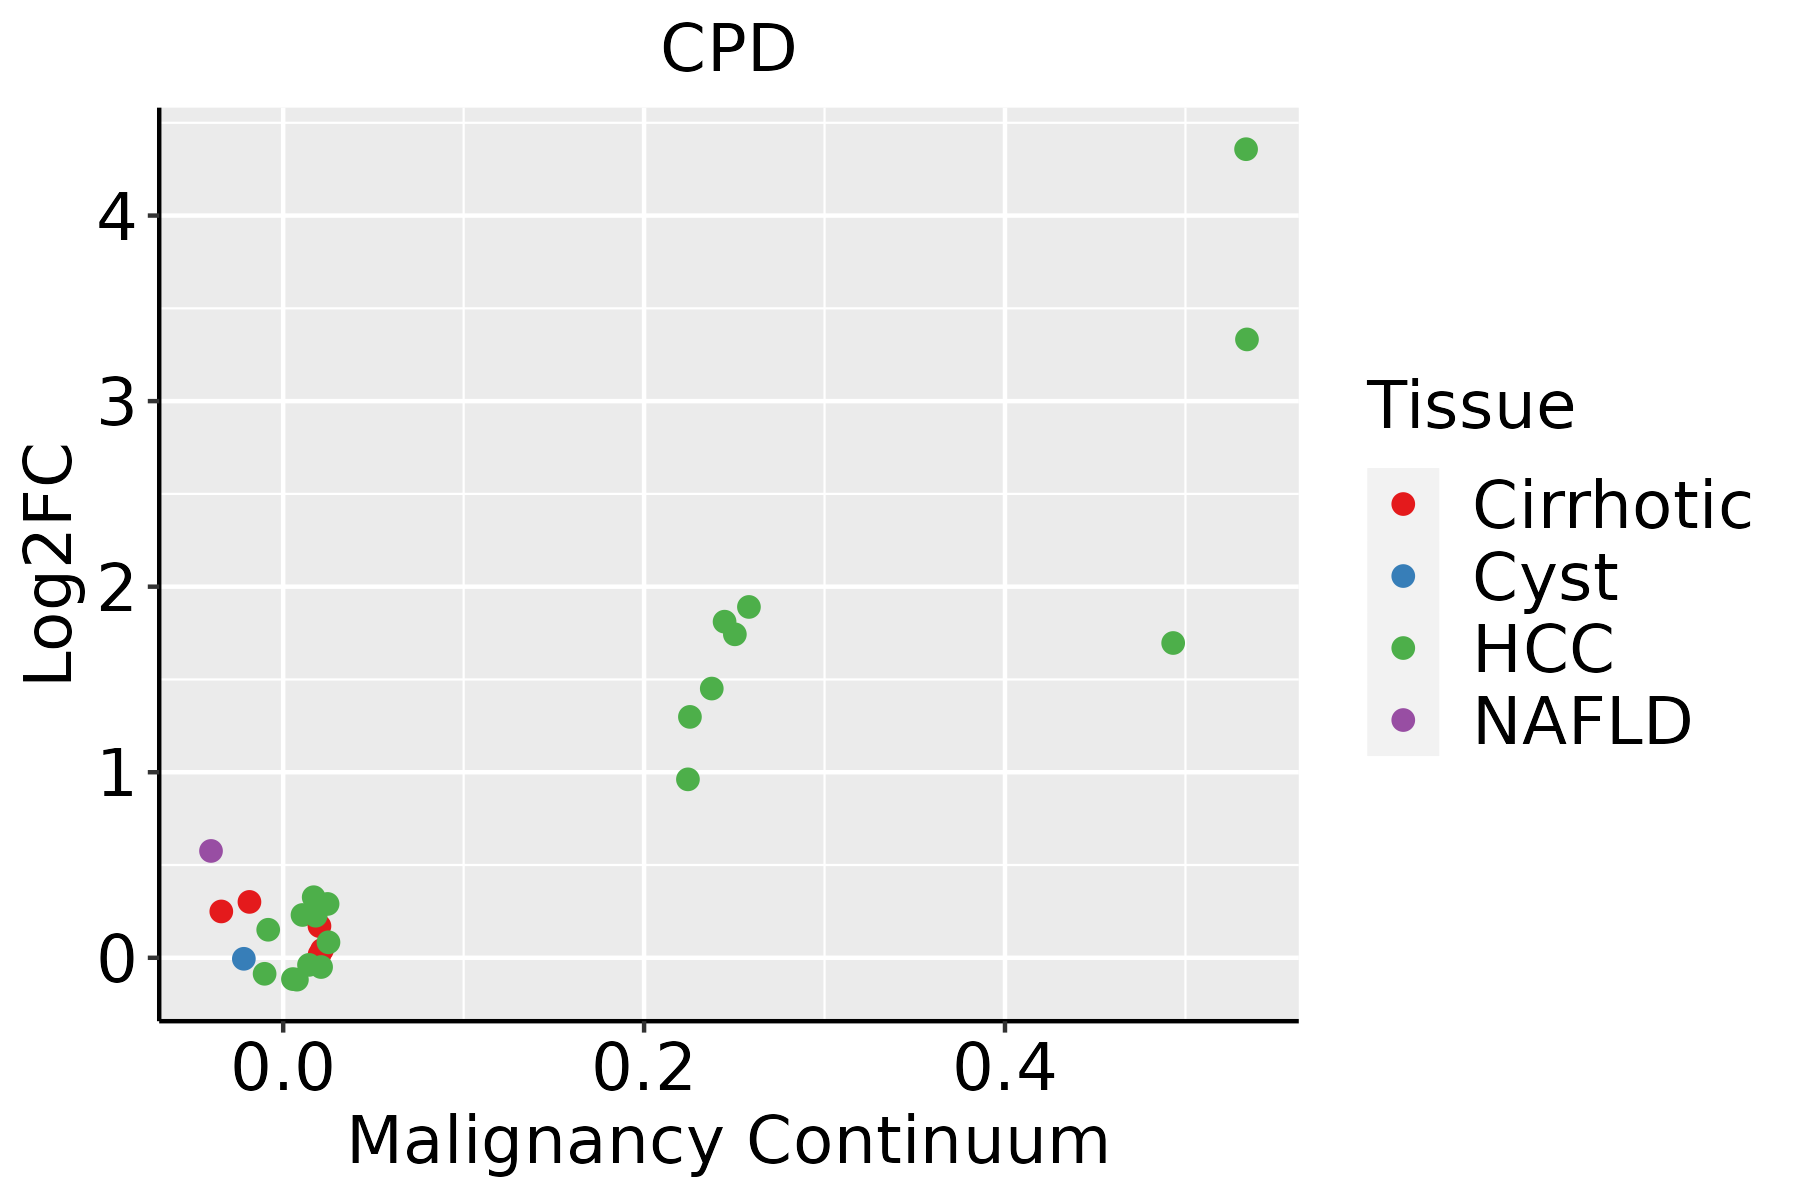
HCC: Hepatocellular carcinoma
NAFLD: Non-alcoholic fatty liver disease
LungThe image shows the transcriptomic changes along malignancy continuum.log2FC in expression of this searched gene in stem-like cells from each diseased tissue sample relative to stem-like cells in normal samples in each tissue plotted against the malignancy continuum. Samples are colored based on if they are from different disease stage.
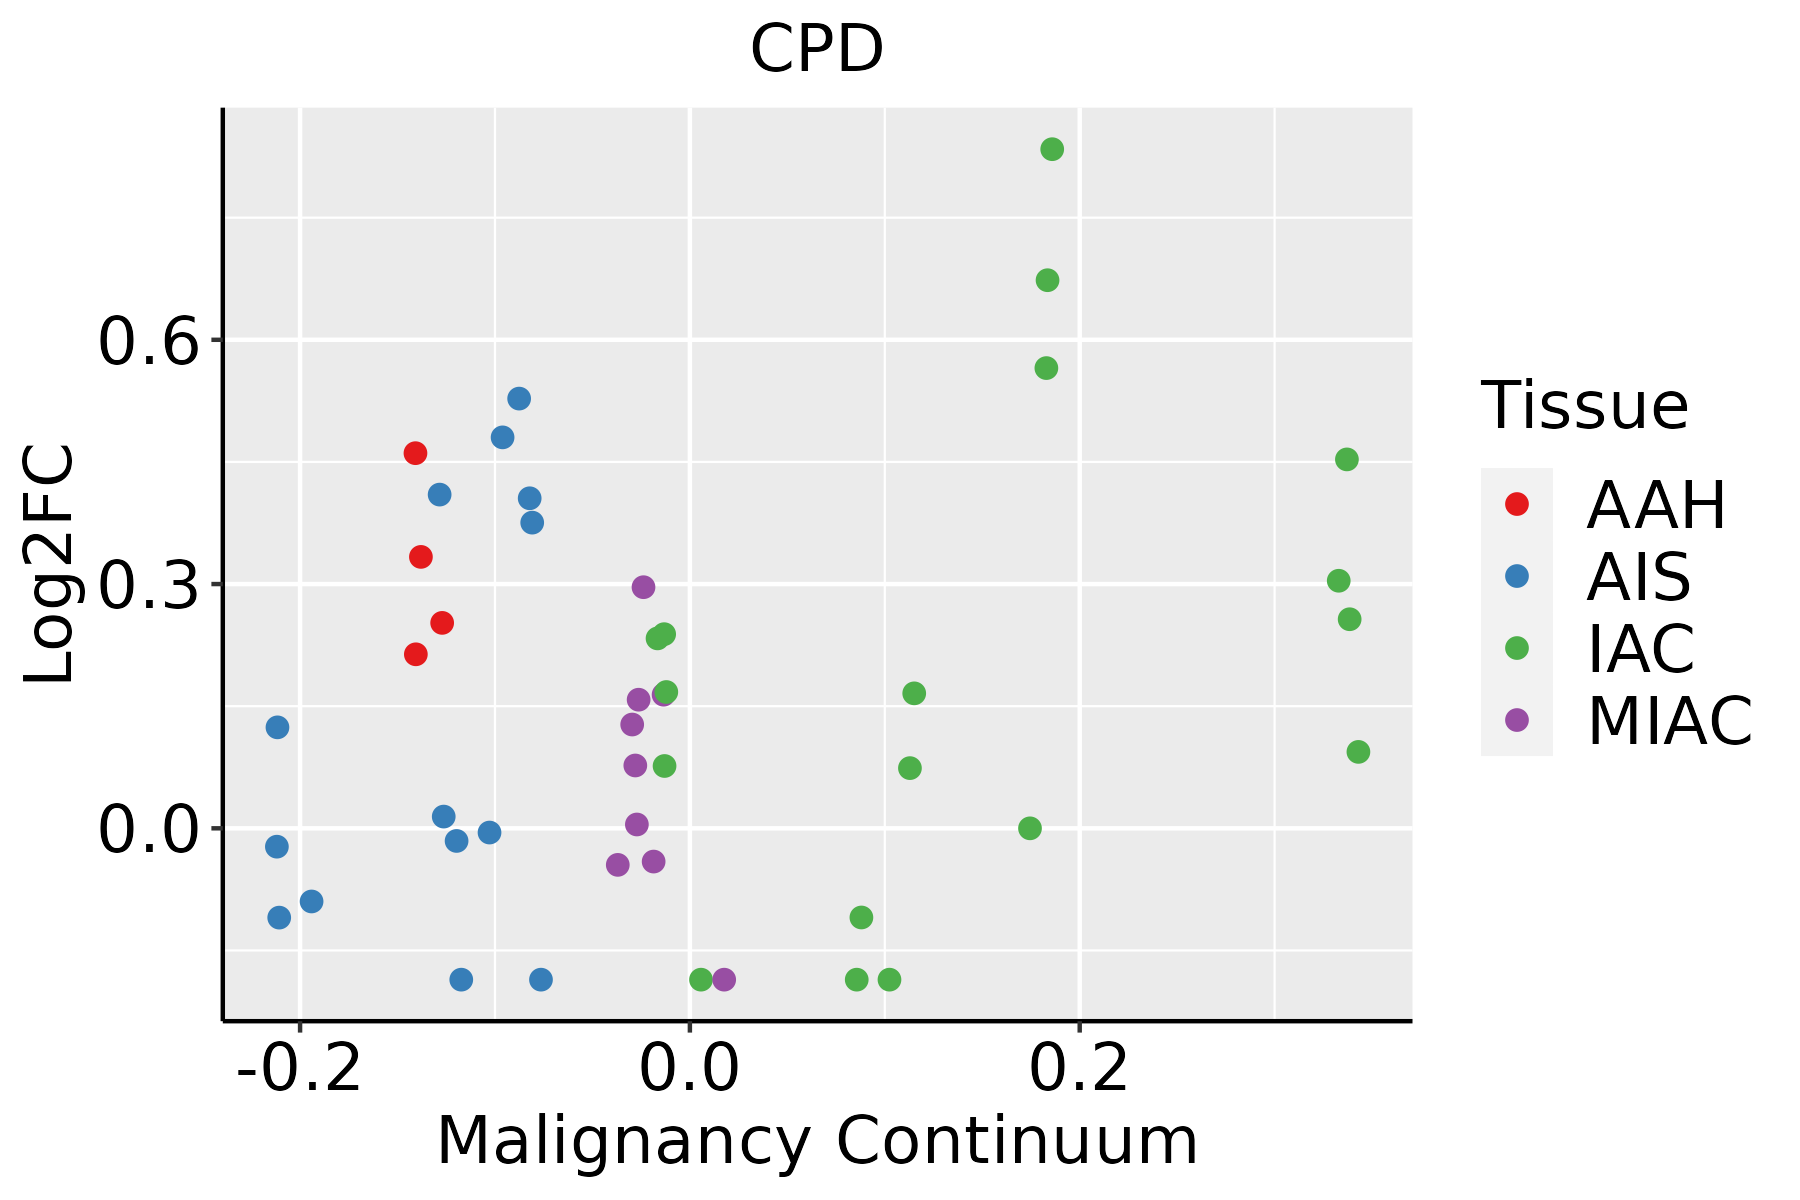
AAH: Atypical adenomatous hyperplasia
AIS: Adenocarcinoma in situ
IAC: Invasive lung adenocarcinoma
MIA: Minimally invasive adenocarcinoma
Oral CavityThe image shows the transcriptomic changes along malignancy continuum.log2FC in expression of this searched gene in stem-like cells from each diseased tissue sample relative to stem-like cells in normal samples in each tissue plotted against the malignancy continuum. Samples are colored based on if they are from different disease stage.
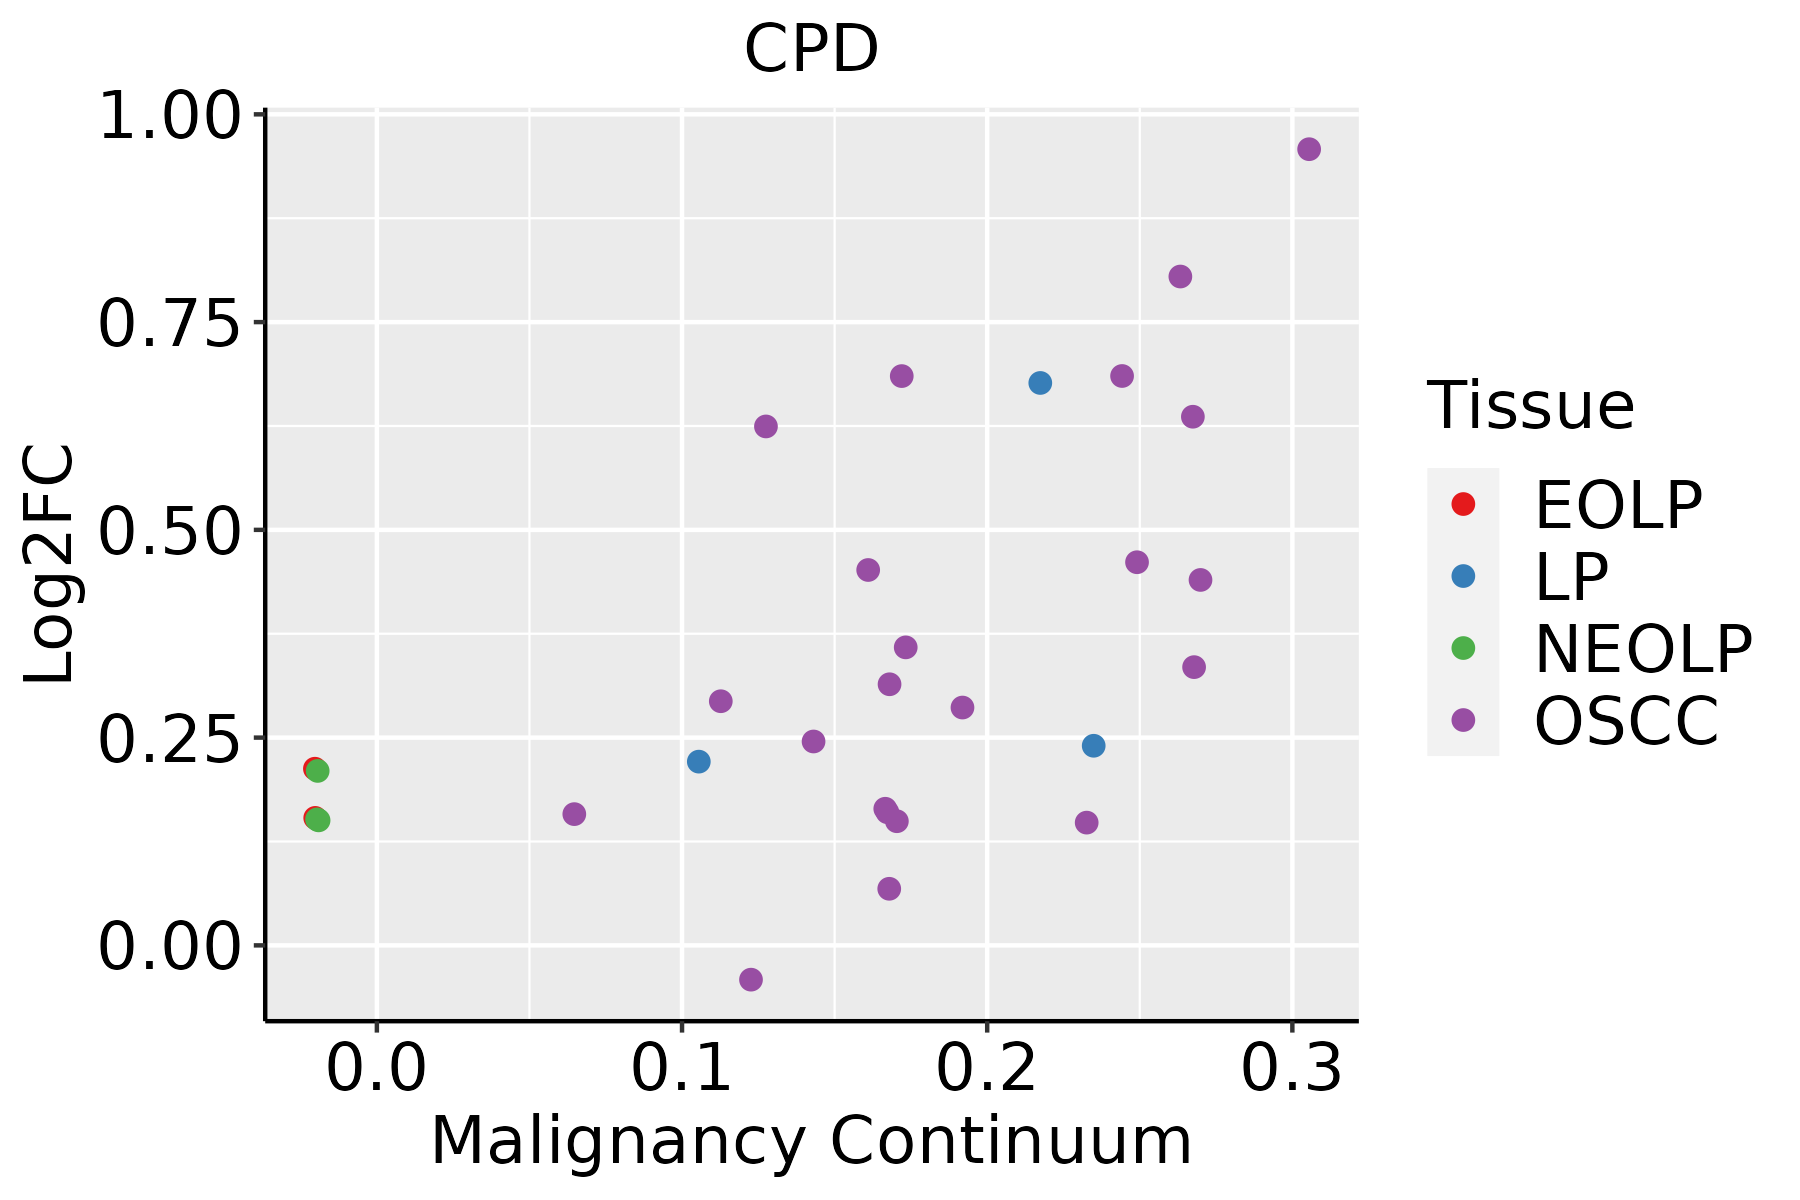
EOLP: Erosive Oral lichen planus
LP: leukoplakia
NEOLP: Non-erosive oral lichen planus
OSCC: Oral squamous cell carcinoma
ProstateThe image shows the transcriptomic changes along malignancy continuum.log2FC in expression of this searched gene in stem-like cells from each diseased tissue sample relative to stem-like cells in normal samples in each tissue plotted against the malignancy continuum. Samples are colored based on if they are from different disease stage.
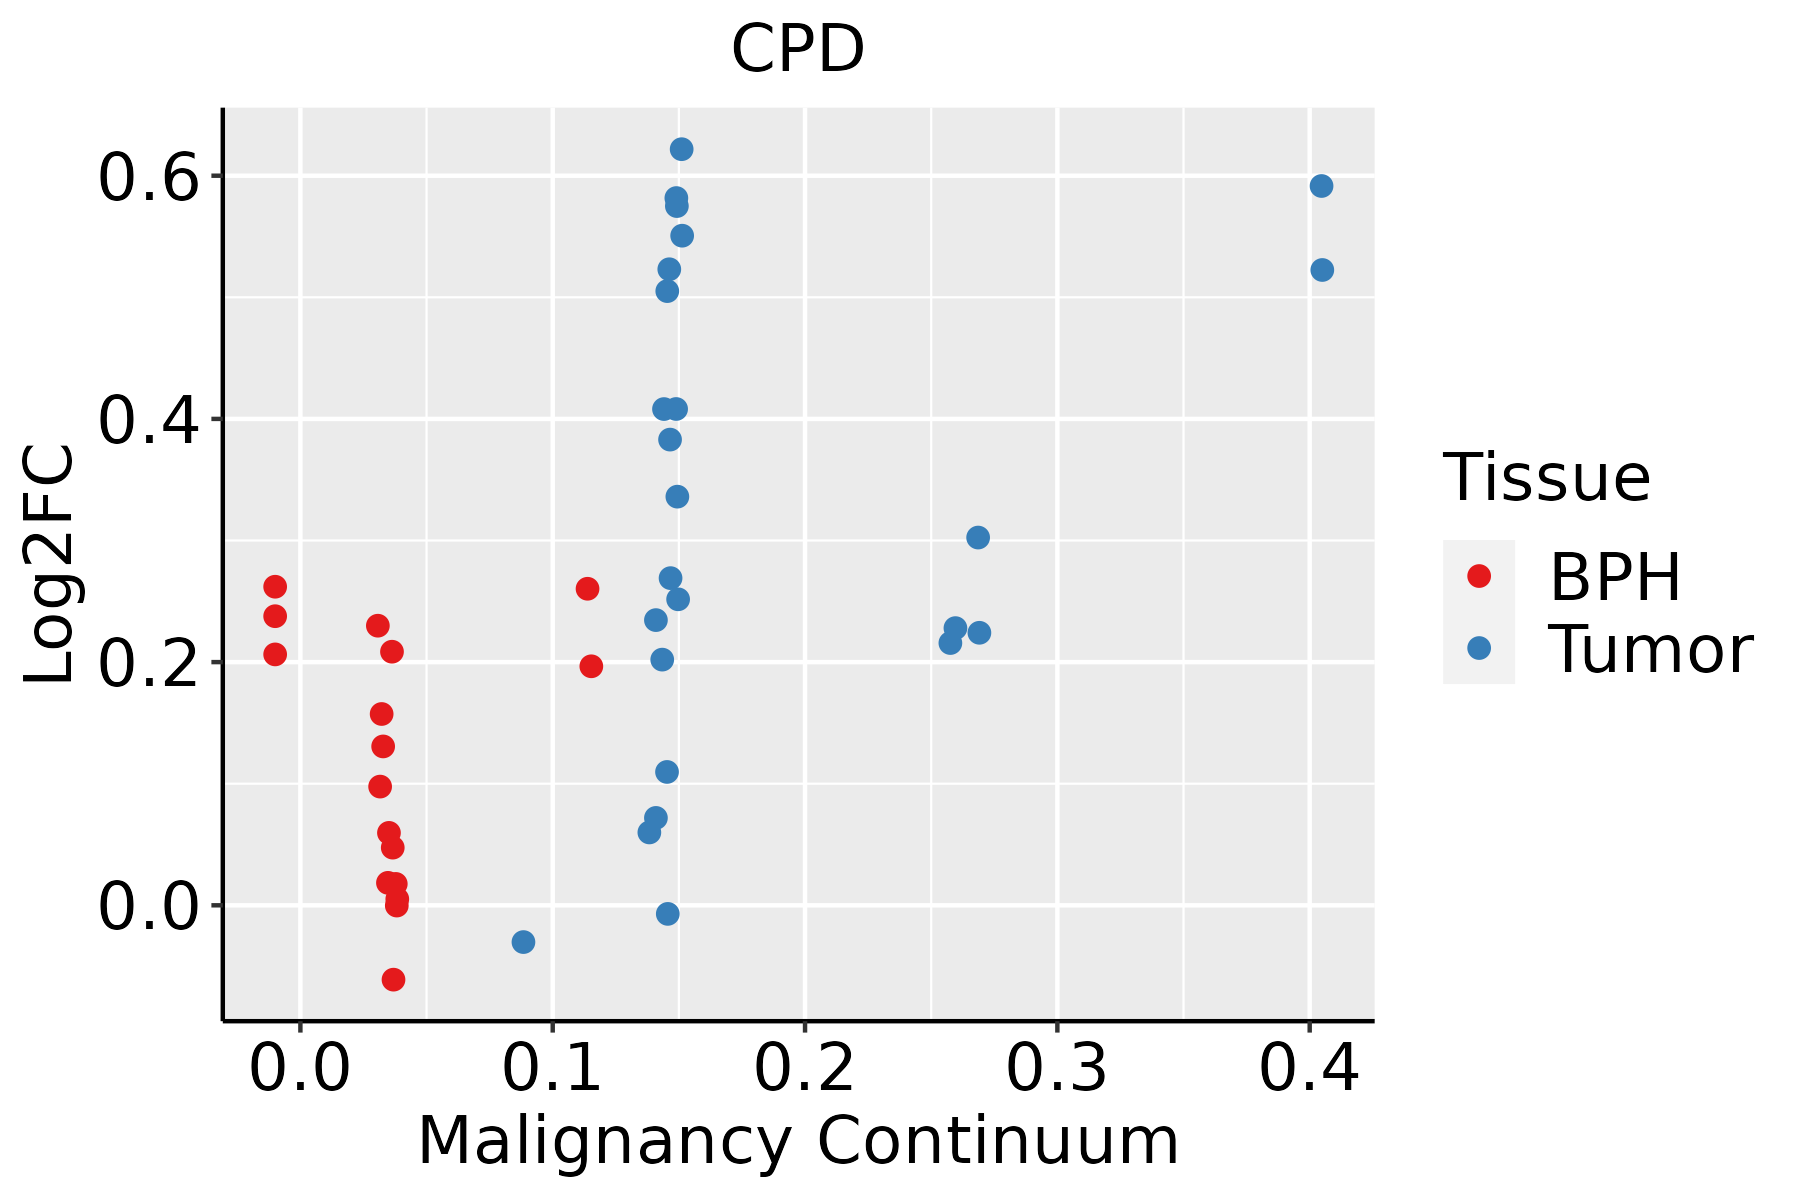
BPH: Benign Prostatic Hyperplasia
ThyroidThe image shows the transcriptomic changes along malignancy continuum.log2FC in expression of this searched gene in stem-like cells from each diseased tissue sample relative to stem-like cells in normal samples in each tissue plotted against the malignancy continuum. Samples are colored based on if they are from different disease stage.
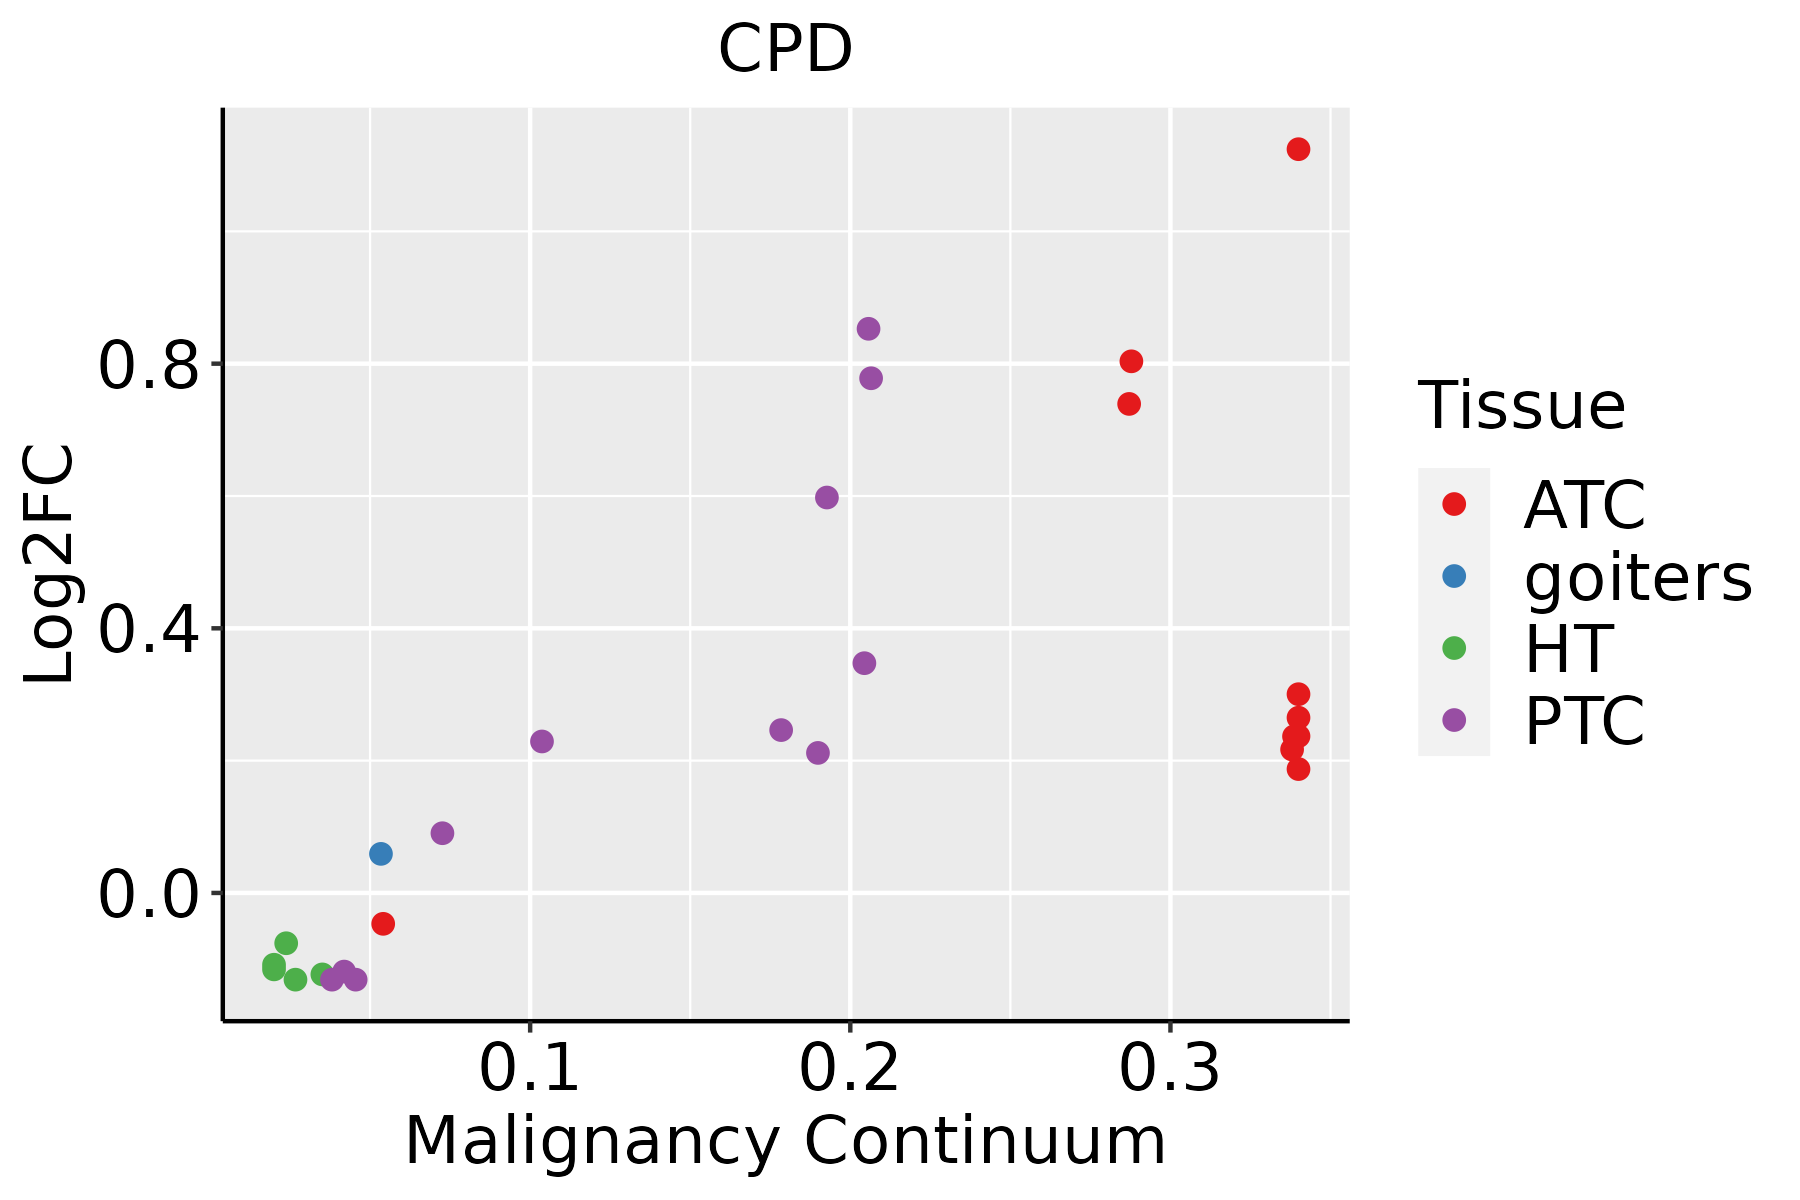
ATC: Anaplastic thyroid cancer
HT: Hashimoto's thyroiditis
PTC: Papillary thyroid cancer
∗log2FC in expression of this searched gene in stem-like cells from each diseased tissue sample relative to stem-like cells in normal samples in each tissue plotted against the malignancy continuum. Samples are colored based on if they are from different disease stage.

Top

Malignant transformation related pathway analysis

check buttonFind out the enriched GO biological processes and KEGG pathways involved in transition from healthy to precancer to cancer
check button Figure of enriched GO biological processes.
TissueDisease StageEnriched GO biological Processes
ColorectumADGO analysis - Figure of enriched GO biological processes: Top 15 enriched GO BP terms are showed in the bar plot of each disease state in each tissue. Each row represents a significant GO biological process which is colored according to the -log10(p.adjust).
ColorectumSERGO analysis - Figure of enriched GO biological processes: Top 15 enriched GO BP terms are showed in the bar plot of each disease state in each tissue. Each row represents a significant GO biological process which is colored according to the -log10(p.adjust).
ColorectumMSSGO analysis - Figure of enriched GO biological processes: Top 15 enriched GO BP terms are showed in the bar plot of each disease state in each tissue. Each row represents a significant GO biological process which is colored according to the -log10(p.adjust).
ColorectumMSI-HGO analysis - Figure of enriched GO biological processes: Top 15 enriched GO BP terms are showed in the bar plot of each disease state in each tissue. Each row represents a significant GO biological process which is colored according to the -log10(p.adjust).
ColorectumFAPGO analysis - Figure of enriched GO biological processes: Top 15 enriched GO BP terms are showed in the bar plot of each disease state in each tissue. Each row represents a significant GO biological process which is colored according to the -log10(p.adjust).
∗Top 15 enriched GO BP terms are showed in the bar plot of each disease state in each tissue. Each row represents a significant GO biological process which is colored according to the -log10(p.adjust).
Page: 1 2 3 4 5 6 7 8 9 

check button Enriched GO biological processes.
GO IDTissueDisease StageDescriptionGene RatioBg Ratiopvaluep.adjustCount
GO:00605375CervixCCmuscle tissue development76/2311403/187239.76e-051.27e-0376
GO:00147064CervixCCstriated muscle tissue development72/2311384/187231.76e-042.07e-0372
GO:00075173CervixCCmuscle organ development58/2311327/187232.73e-031.85e-0258
GO:00075192CervixCCskeletal muscle tissue development30/2311155/187237.97e-034.18e-0230
GO:00160422ColorectumMSSlipid catabolic process77/3467320/187237.43e-034.71e-0277
GO:00442422ColorectumFAPcellular lipid catabolic process49/2622214/187232.87e-043.77e-0349
GO:00160423ColorectumFAPlipid catabolic process65/2622320/187231.13e-031.08e-0265
GO:00066502ColorectumFAPglycerophospholipid metabolic process62/2622306/187231.54e-031.38e-0262
GO:00066442ColorectumFAPphospholipid metabolic process74/2622383/187232.24e-031.83e-0274
GO:00066503ColorectumCRCglycerophospholipid metabolic process55/2078306/187232.10e-043.55e-0355
GO:00066443ColorectumCRCphospholipid metabolic process65/2078383/187233.21e-044.95e-0365
GO:00464861ColorectumCRCglycerolipid metabolic process64/2078392/187231.01e-031.19e-0264
GO:00160424ColorectumCRClipid catabolic process53/2078320/187231.89e-031.93e-0253
GO:0060537ColorectumCRCmuscle tissue development63/2078403/187233.17e-032.78e-0263
GO:00442423ColorectumCRCcellular lipid catabolic process37/2078214/187234.16e-033.40e-0237
GO:0014706ColorectumCRCstriated muscle tissue development59/2078384/187236.11e-034.47e-0259
GO:00605376EndometriumAEHmuscle tissue development83/2100403/187232.57e-081.50e-0683
GO:00147065EndometriumAEHstriated muscle tissue development75/2100384/187231.06e-063.62e-0575
GO:00075174EndometriumAEHmuscle organ development60/2100327/187238.19e-051.22e-0360
GO:00605382EndometriumAEHskeletal muscle organ development30/2100166/187235.64e-033.46e-0230
Page: 1 2 3 4 5 6 

check button Enriched KEGG pathways.
Pathway IDTissueDisease StageDescriptionGene RatioBg Ratiopvaluep.adjustqvalueCount
Page: 1 

Top

Cell-cell communication analysis

check buttonIdentification of potential cell-cell interactions between two cell types and their ligand-receptor pairs for different disease states
LigandReceptorLRpairPathwayTissueDisease Stage
Page: 1 

Top

Single-cell gene regulatory network inference analysis

check buttonFind out the significant the regulons (TFs) and the target genes of each regulon across cell types for different disease states
TFCell TypeTissueDisease StageTarget GeneRSSRegulon Activity
∗The dot plots of a searched regulon are shown for all cell subpopulations in each disease state of each tissue based on the regulon specific score inferred using pySCENIC and by calculating the average expression.
Page: 1 

Top

Somatic mutation of malignant transformation related genes

check buttonAnnotation of somatic variants for genes involved in malignant transformation
Hugo SymbolVariant ClassVariant ClassificationdbSNP RSHGVScHGVSpHGVSp ShortSWISSPROTBIOTYPESIFTPolyPhenTumor Sample BarcodeTissueHistologySexAgeStageTherapy TypesDrugsOutcome
CPDSNVMissense_Mutationrs375764127c.1927N>Gp.Gln643Glup.Q643EO75976protein_codingtolerated(1)benign(0.007)TCGA-AC-A23H-01Breastbreast invasive carcinomaFemale>=65I/IIUnknownUnknownPD
CPDSNVMissense_Mutationc.3388N>Ap.His1130Asnp.H1130NO75976protein_codingtolerated(0.14)probably_damaging(0.998)TCGA-AC-A23H-01Breastbreast invasive carcinomaFemale>=65I/IIUnknownUnknownPD
CPDSNVMissense_Mutationnovelc.4027N>Ap.Glu1343Lysp.E1343KO75976protein_codingdeleterious_low_confidence(0.02)benign(0.073)TCGA-BH-A0B6-01Breastbreast invasive carcinomaFemale<65I/IIUnknownUnknownSD
CPDSNVMissense_Mutationc.2153N>Cp.Arg718Thrp.R718TO75976protein_codingtolerated(0.74)benign(0.01)TCGA-E2-A1LH-01Breastbreast invasive carcinomaFemale<65I/IIChemotherapyadriamycinSD
CPDSNVMissense_Mutationnovelc.2509N>Tp.Pro837Serp.P837SO75976protein_codingdeleterious(0)possibly_damaging(0.904)TCGA-GM-A2D9-01Breastbreast invasive carcinomaFemale>=65I/IIHormone TherapyarimidexSD
CPDSNVMissense_Mutationnovelc.3812N>Tp.Ser1271Leup.S1271LO75976protein_codingtolerated(0.22)benign(0.076)TCGA-OL-A66L-01Breastbreast invasive carcinomaFemale>=65I/IIUnknownUnknownSD
CPDinsertionIn_Frame_Insnovelc.2107_2108insATCAAAAACTTTp.Ile703delinsAsnGlnLysLeuLeup.I703delinsNQKLLO75976protein_codingTCGA-AQ-A04H-01Breastbreast invasive carcinomaFemale<65III/IVChemotherapytaxotereSD
CPDinsertionFrame_Shift_Insnovelc.2109_2110insTp.Ala704CysfsTer15p.A704Cfs*15O75976protein_codingTCGA-AQ-A04H-01Breastbreast invasive carcinomaFemale<65III/IVChemotherapytaxotereSD
CPDSNVMissense_Mutationrs377211802c.1088N>Ap.Arg363Glnp.R363QO75976protein_codingtolerated(0.68)benign(0.007)TCGA-2W-A8YY-01Cervixcervical & endocervical cancerFemale<65I/IIChemotherapycisplatinCR
CPDSNVMissense_Mutationnovelc.2840N>Cp.Val947Alap.V947AO75976protein_codingtolerated(0.52)benign(0.171)TCGA-2W-A8YY-01Cervixcervical & endocervical cancerFemale<65I/IIChemotherapycisplatinCR
Page: 1 2 3 4 5 6 7 8 9 10 11 

Top

Related drugs of malignant transformation related genes

check buttonIdentification of chemicals and drugs interact with genes involved in malignant transfromation
(DGIdb 4.0)
Entrez IDSymbolCategoryInteraction TypesDrug Claim NameDrug NamePMIDs
1362CPDENZYME, DRUGGABLE GENOME, PROTEASEANTISERUM9490632
Page: 1