
|
|||||
|
 | |
| |
| |
| |
| |
| |
|
Gene: COTL1 |
Gene summary for COTL1 |
| Gene information | Species | Human | Gene symbol | COTL1 | Gene ID | 23406 |
| Gene name | coactosin like F-actin binding protein 1 | |
| Gene Alias | CLP | |
| Cytomap | 16q24.1 | |
| Gene Type | protein-coding | GO ID | GO:0002376 | UniProtAcc | Q14019 |
Top |
Malignant transformation analysis |
| Identification of the aberrant gene expression in precancerous and cancerous lesions by comparing the gene expression of stem-like cells in diseased tissues with normal stem cells |
| Entrez ID | Symbol | Replicates | Species | Organ | Tissue | Adj P-value | Log2FC | Malignancy |
| 23406 | COTL1 | HTA11_99999970781_79442 | Human | Colorectum | MSS | 8.78e-13 | 5.91e-01 | 0.294 |
| 23406 | COTL1 | HTA11_99999974143_84620 | Human | Colorectum | MSS | 1.56e-25 | 1.00e+00 | 0.3005 |
| 23406 | COTL1 | A015-C-203 | Human | Colorectum | FAP | 1.87e-02 | -9.48e-02 | -0.1294 |
| 23406 | COTL1 | A002-C-203 | Human | Colorectum | FAP | 5.13e-04 | -1.18e-01 | 0.2786 |
| 23406 | COTL1 | A001-C-108 | Human | Colorectum | FAP | 3.11e-05 | -1.46e-01 | -0.0272 |
| 23406 | COTL1 | A001-C-104 | Human | Colorectum | FAP | 2.20e-05 | -1.45e-01 | 0.0184 |
| 23406 | COTL1 | A015-C-106 | Human | Colorectum | FAP | 4.46e-05 | -1.58e-01 | -0.0511 |
| 23406 | COTL1 | A015-C-104 | Human | Colorectum | FAP | 4.41e-04 | -1.26e-01 | -0.1899 |
| 23406 | COTL1 | A002-C-016 | Human | Colorectum | FAP | 2.29e-02 | -1.03e-01 | 0.0521 |
| 23406 | COTL1 | A001-C-203 | Human | Colorectum | FAP | 4.73e-04 | -1.02e-01 | -0.0481 |
| 23406 | COTL1 | A002-C-116 | Human | Colorectum | FAP | 3.69e-06 | -1.46e-01 | -0.0452 |
| 23406 | COTL1 | F034 | Human | Colorectum | FAP | 1.38e-04 | -1.41e-01 | -0.0665 |
| 23406 | COTL1 | F072B | Human | Colorectum | FAP | 7.76e-04 | -1.46e-01 | 0.257 |
| 23406 | COTL1 | CRC-1-8810 | Human | Colorectum | CRC | 1.96e-03 | -1.47e-01 | 0.6257 |
| 23406 | COTL1 | LZE4T | Human | Esophagus | ESCC | 3.19e-04 | 7.19e-02 | 0.0811 |
| 23406 | COTL1 | LZE20T | Human | Esophagus | ESCC | 3.30e-04 | 3.46e-01 | 0.0662 |
| 23406 | COTL1 | LZE22T | Human | Esophagus | ESCC | 1.19e-06 | 1.03e+00 | 0.068 |
| 23406 | COTL1 | LZE24T | Human | Esophagus | ESCC | 1.20e-15 | 5.49e-01 | 0.0596 |
| 23406 | COTL1 | LZE21T | Human | Esophagus | ESCC | 1.21e-02 | 6.52e-01 | 0.0655 |
| 23406 | COTL1 | LZE6T | Human | Esophagus | ESCC | 3.23e-08 | 2.35e-01 | 0.0845 |
| Page: 1 2 3 4 5 6 7 8 9 10 |
| Tissue | Expression Dynamics | Abbreviation |
| Breast | 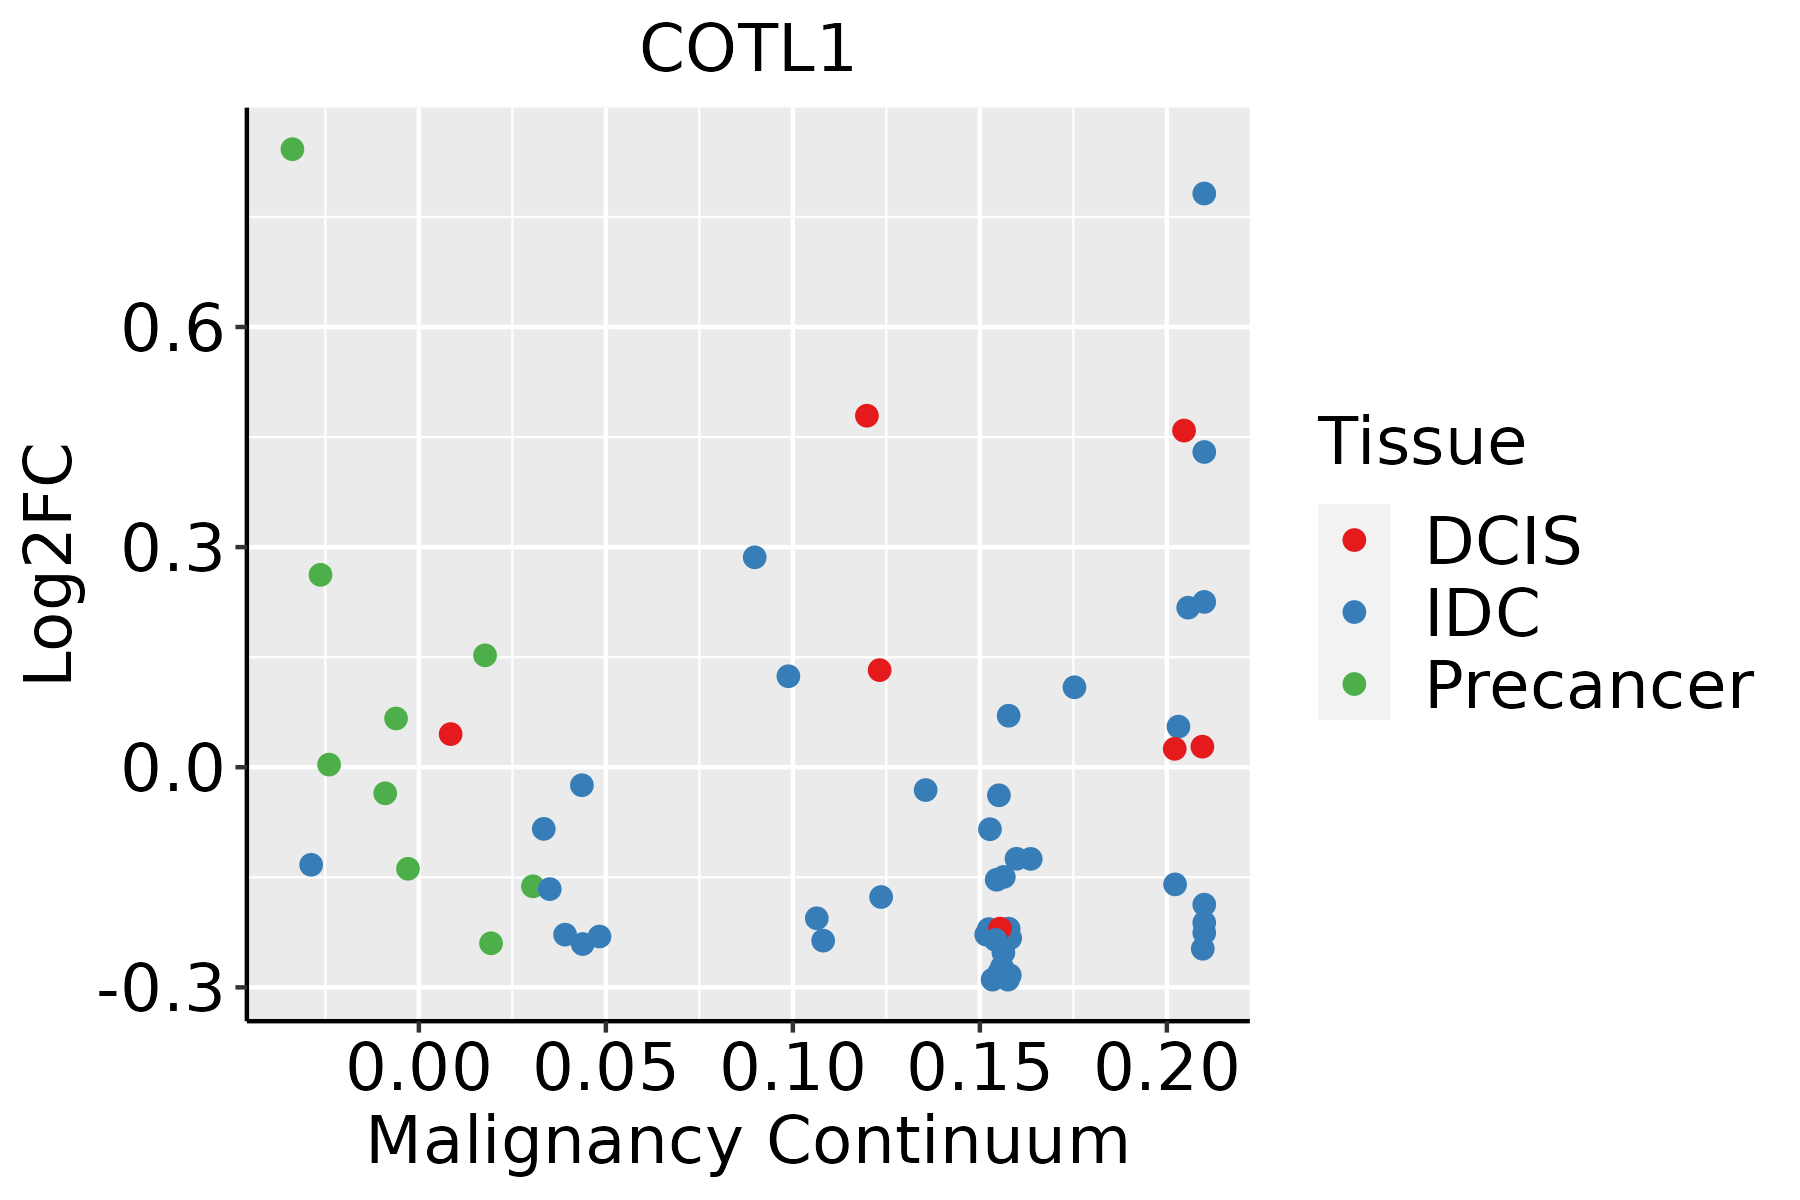 | IDC: Invasive ductal carcinoma |
| DCIS: Ductal carcinoma in situ | ||
| Precancer(BRCA1-mut): Precancerous lesion from BRCA1 mutation carriers | ||
| Cervix | 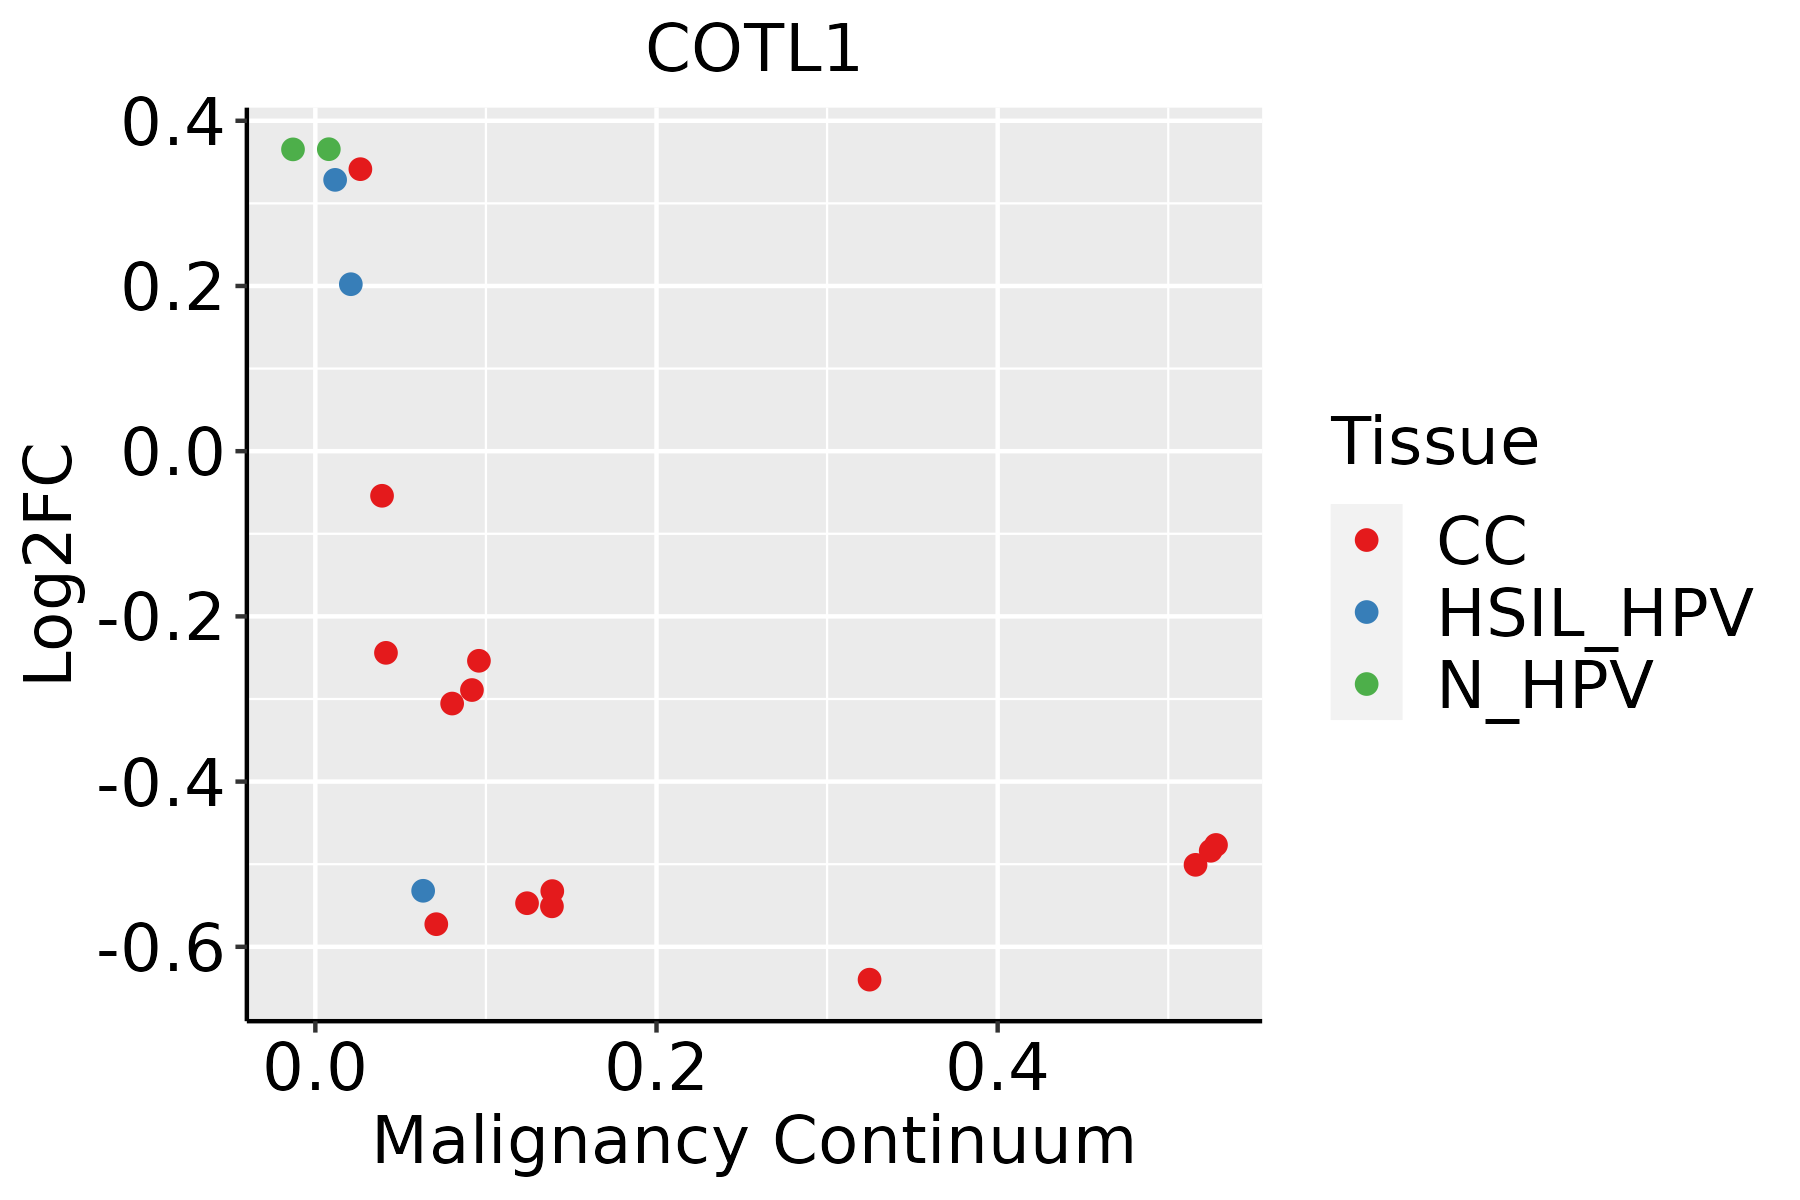 | CC: Cervix cancer |
| HSIL_HPV: HPV-infected high-grade squamous intraepithelial lesions | ||
| N_HPV: HPV-infected normal cervix | ||
| Colorectum (GSE201348) |  | FAP: Familial adenomatous polyposis |
| CRC: Colorectal cancer | ||
| Colorectum (HTA11) |  | AD: Adenomas |
| SER: Sessile serrated lesions | ||
| MSI-H: Microsatellite-high colorectal cancer | ||
| MSS: Microsatellite stable colorectal cancer | ||
| Esophagus | 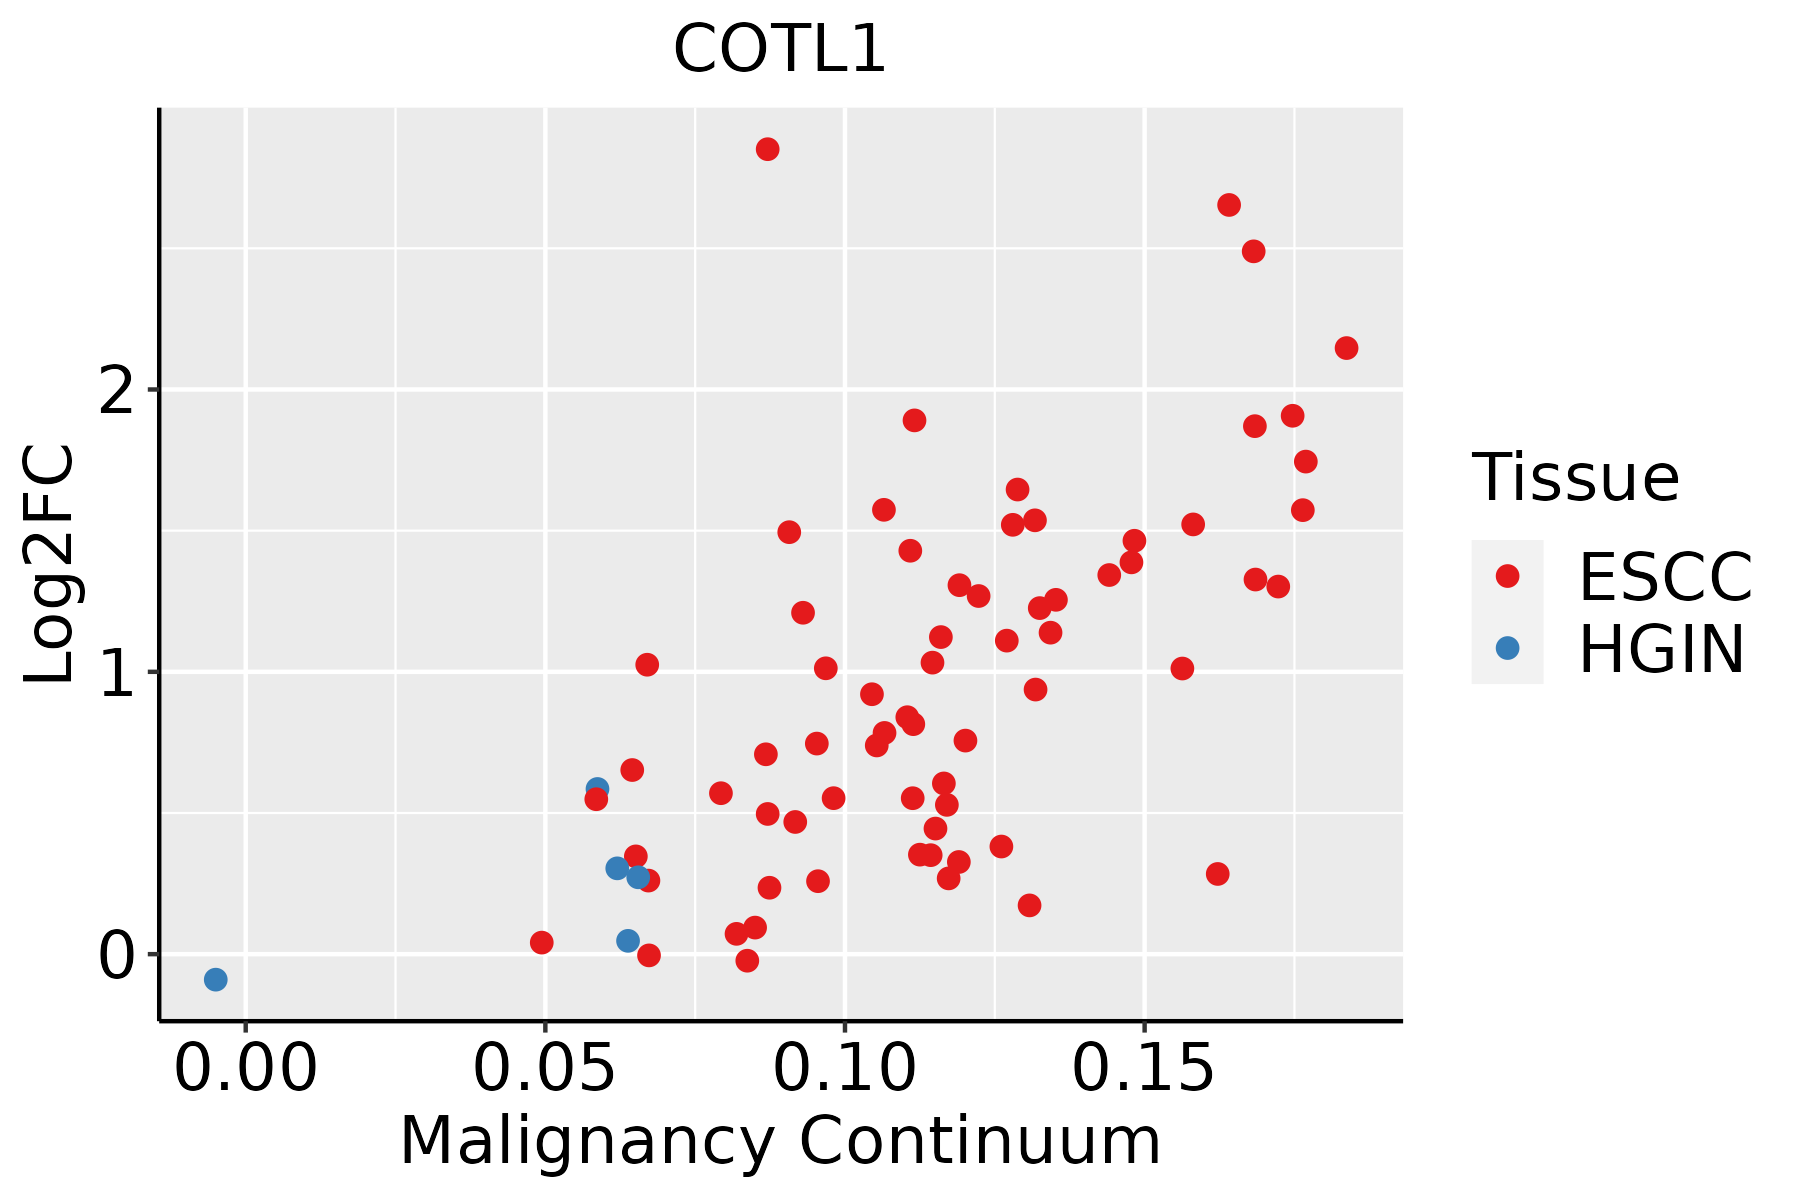 | ESCC: Esophageal squamous cell carcinoma |
| HGIN: High-grade intraepithelial neoplasias | ||
| LGIN: Low-grade intraepithelial neoplasias | ||
| GC | 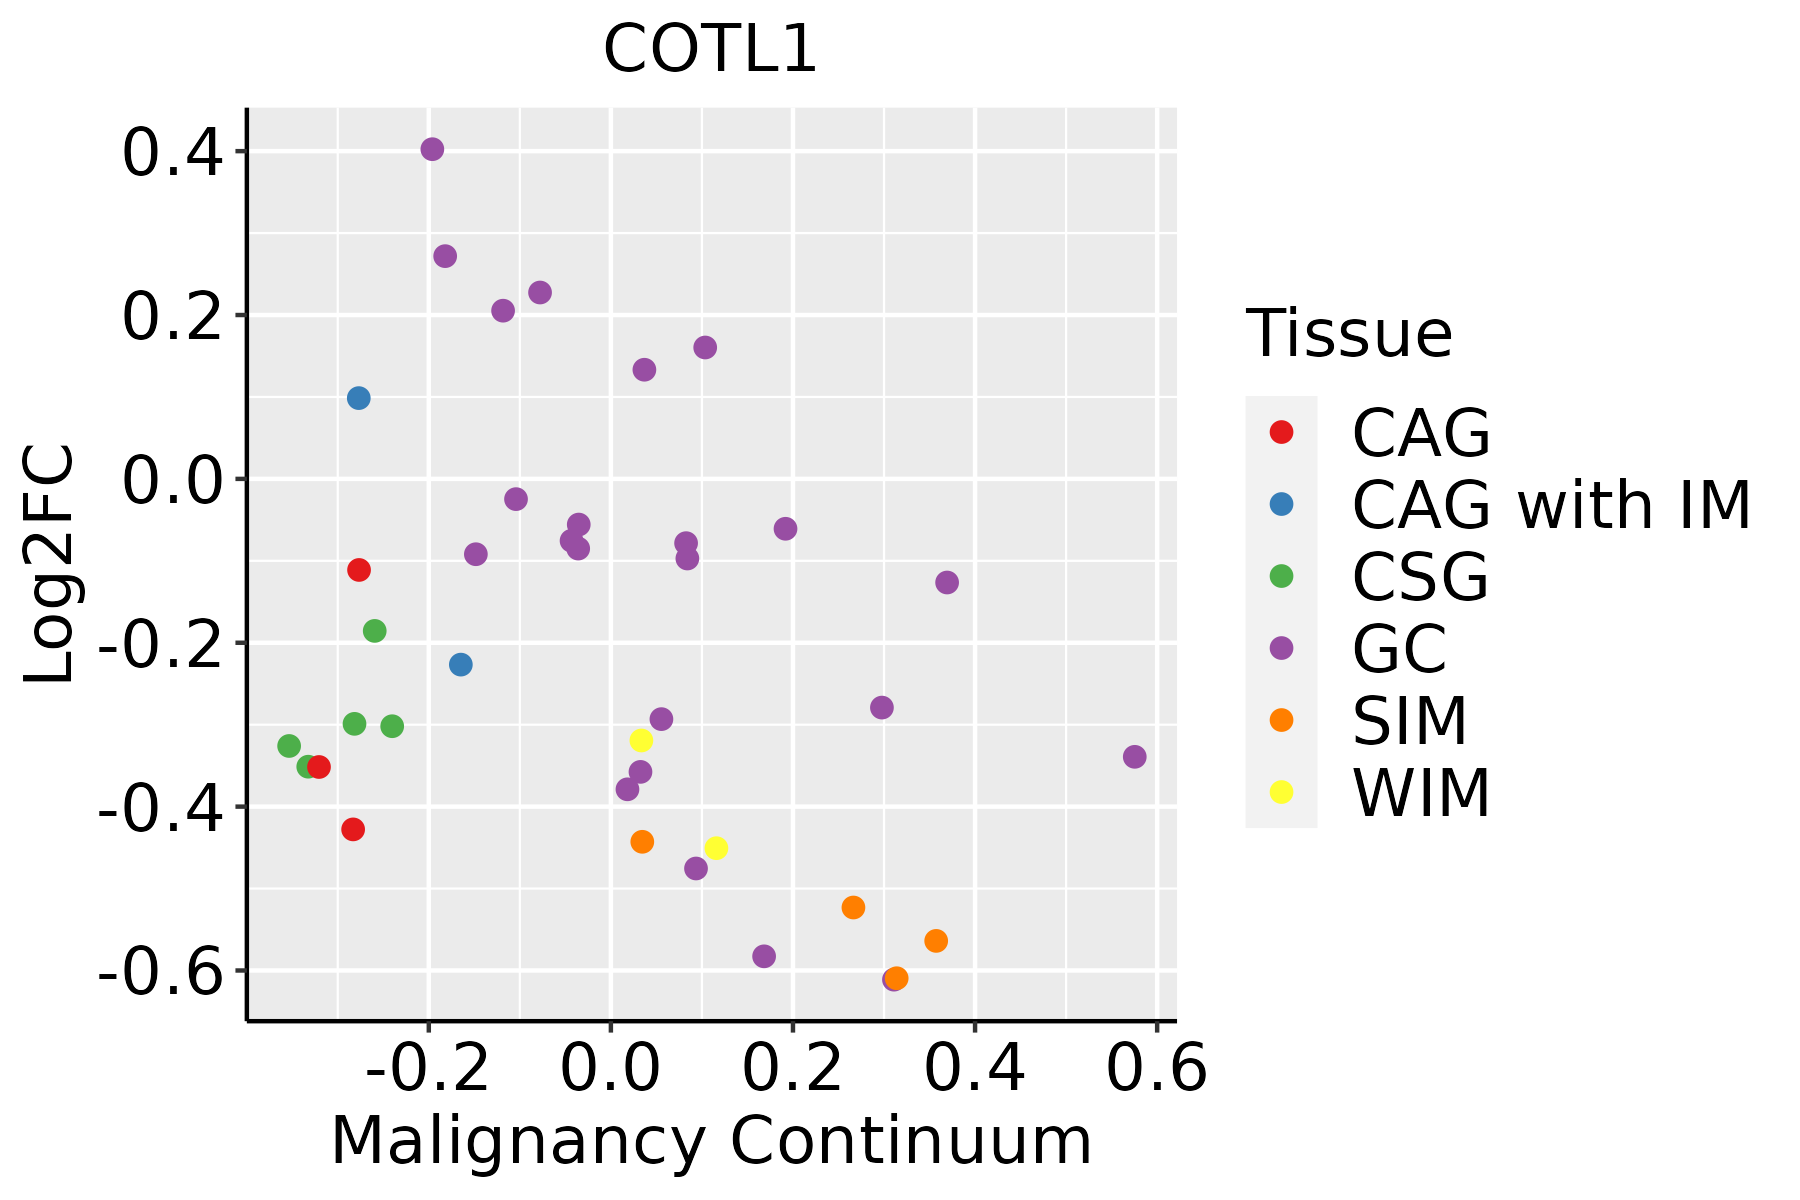 | CAG: Chronic atrophic gastritis |
| CAG with IM: Chronic atrophic gastritis with intestinal metaplasia | ||
| CSG: Chronic superficial gastritis | ||
| GC: Gastric cancer | ||
| SIM: Severe intestinal metaplasia | ||
| WIM: Wild intestinal metaplasia | ||
| Liver | 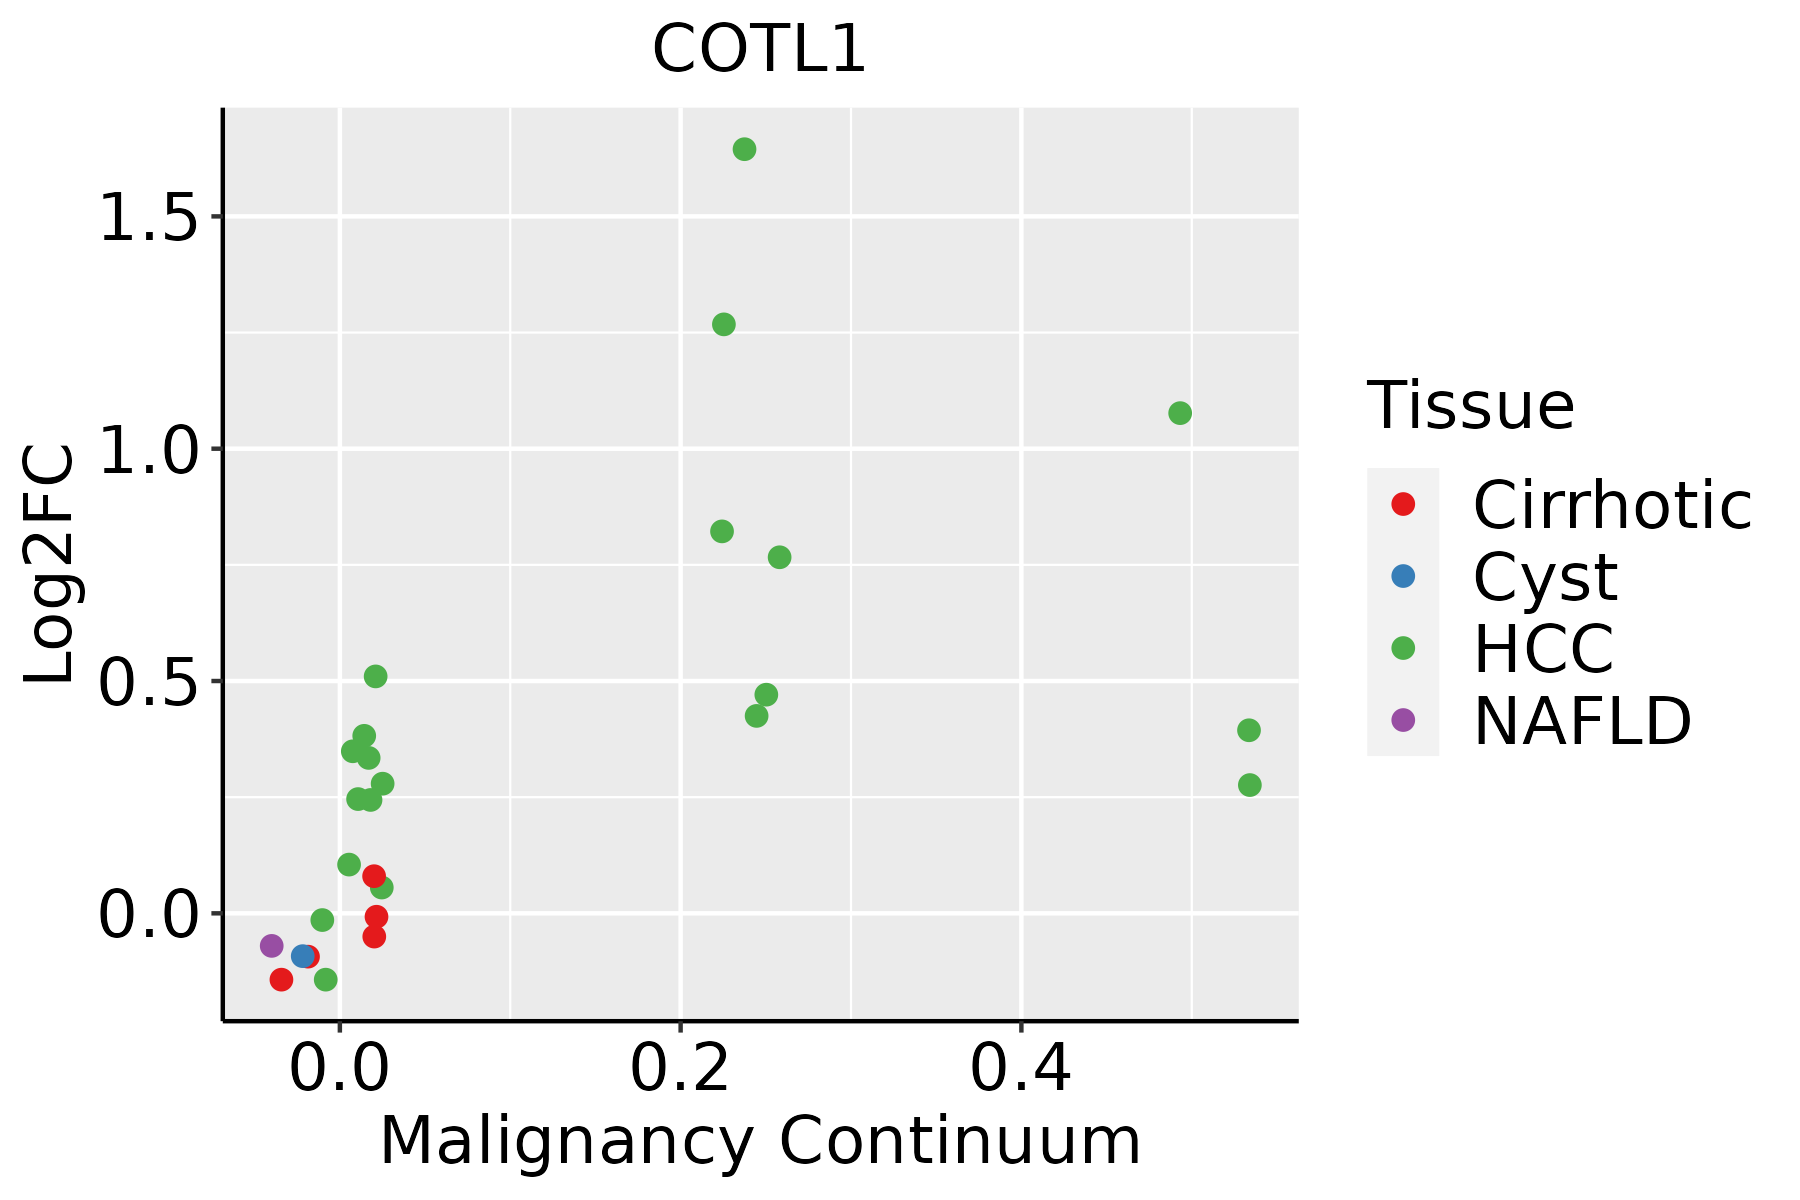 | HCC: Hepatocellular carcinoma |
| NAFLD: Non-alcoholic fatty liver disease | ||
| Oral Cavity | 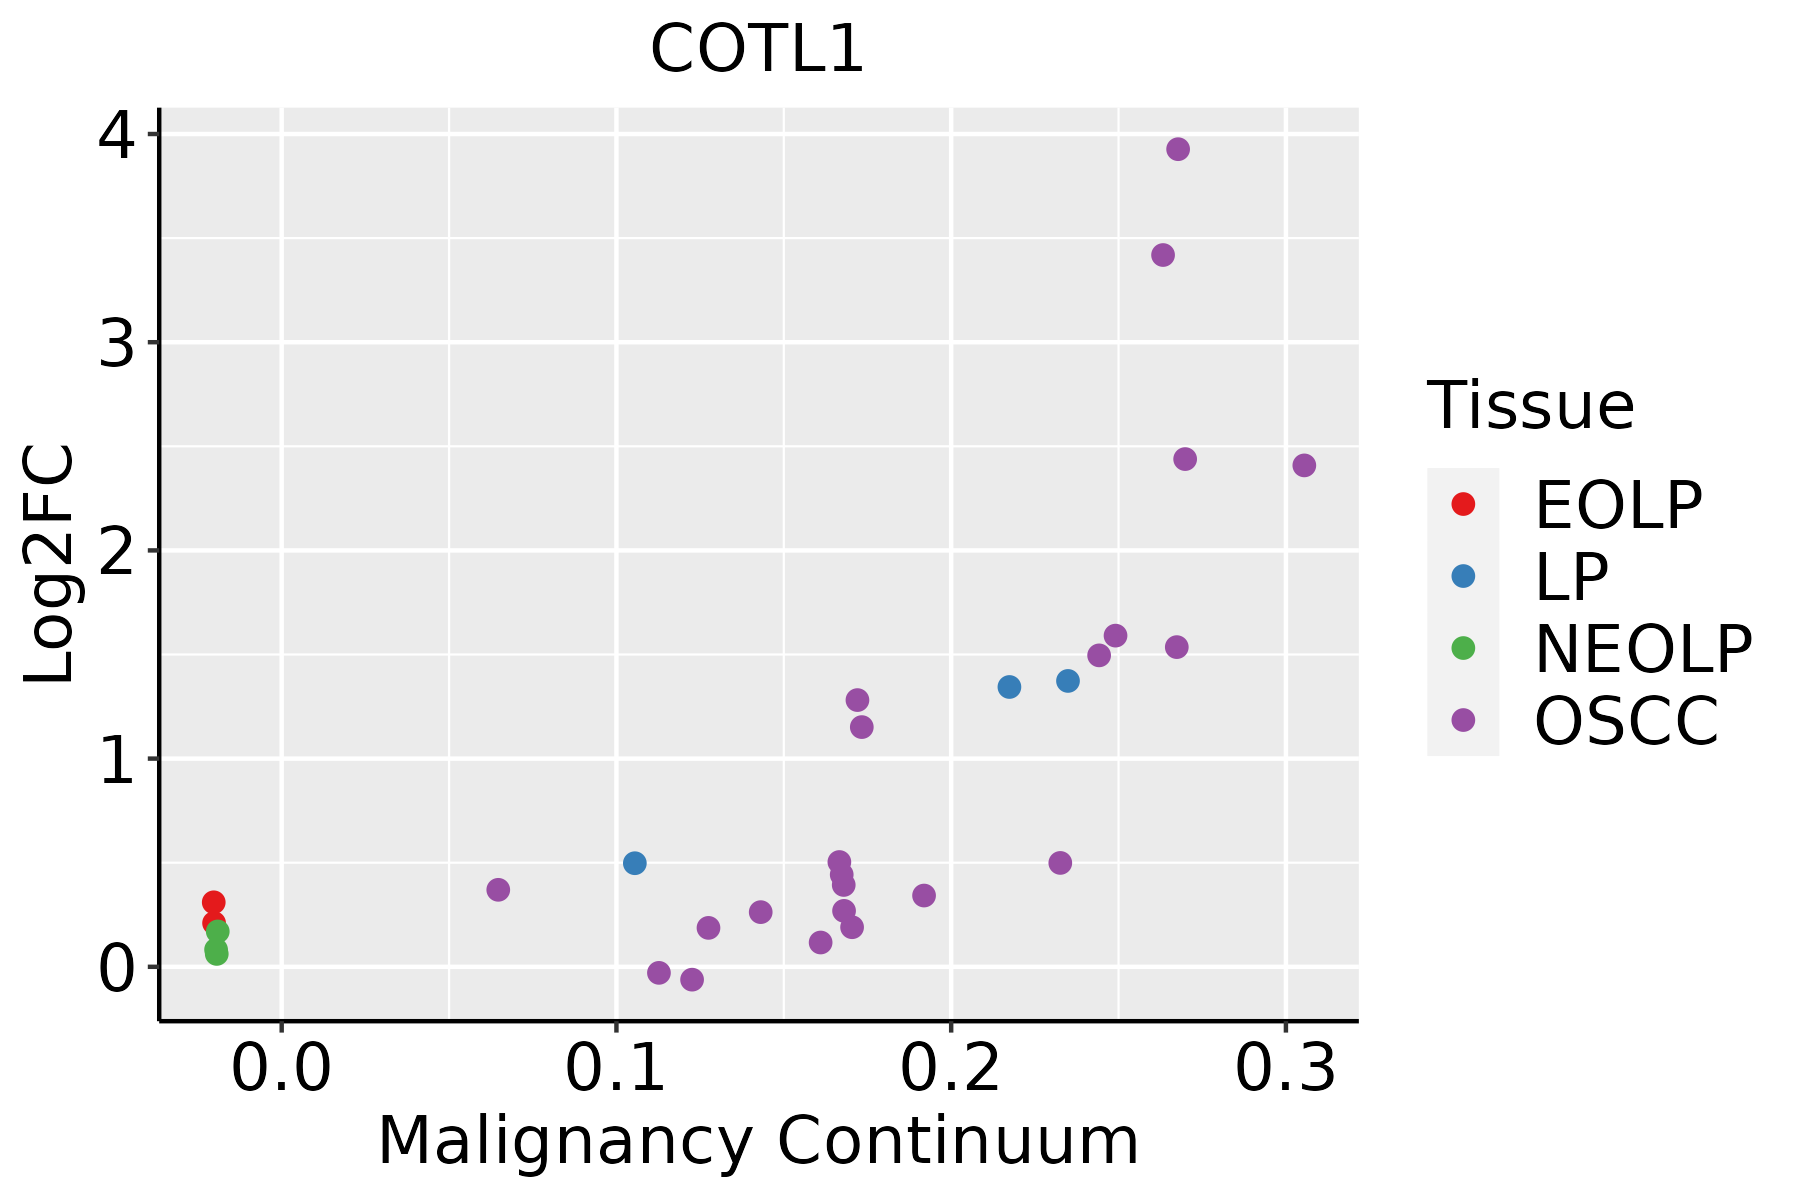 | EOLP: Erosive Oral lichen planus |
| LP: leukoplakia | ||
| NEOLP: Non-erosive oral lichen planus | ||
| OSCC: Oral squamous cell carcinoma | ||
| Skin | 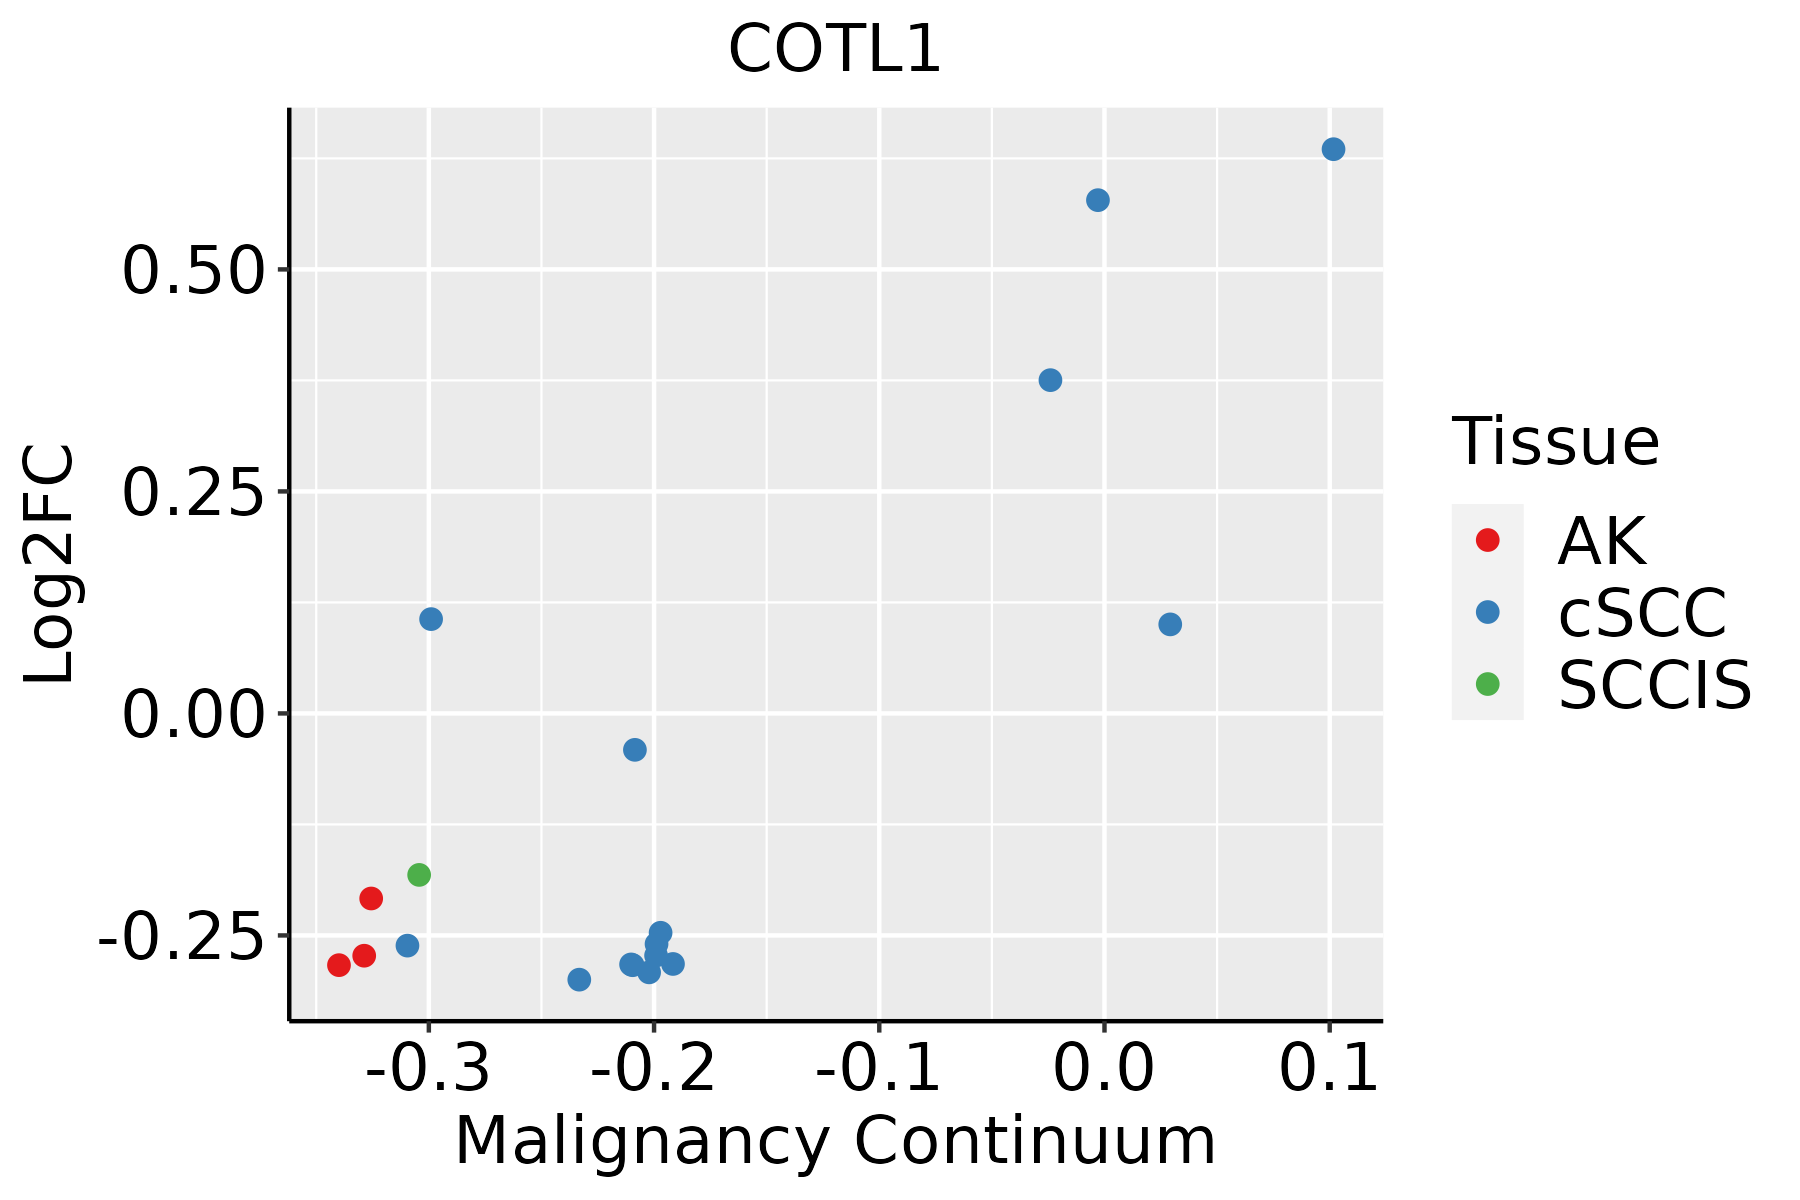 | AK: Actinic keratosis |
| cSCC: Cutaneous squamous cell carcinoma | ||
| SCCIS:squamous cell carcinoma in situ | ||
| Thyroid | 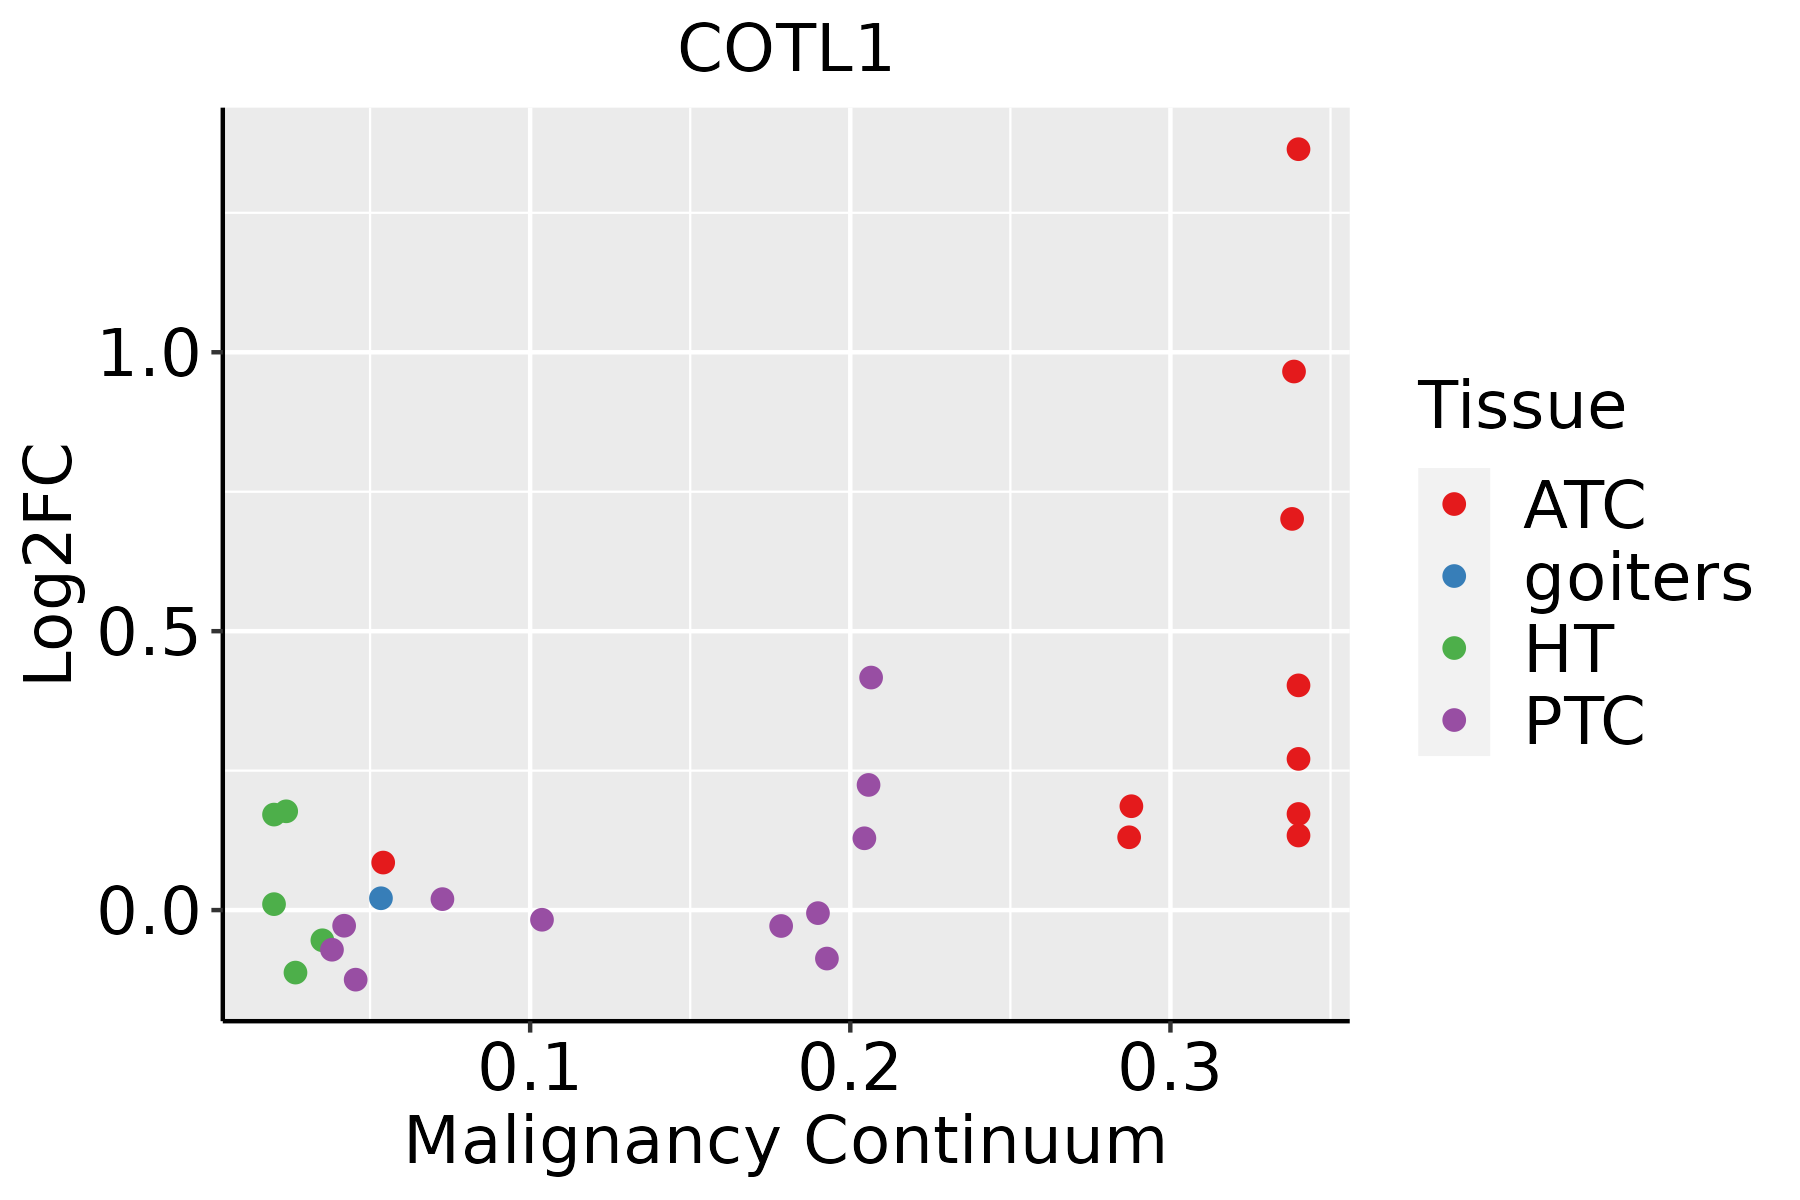 | ATC: Anaplastic thyroid cancer |
| HT: Hashimoto's thyroiditis | ||
| PTC: Papillary thyroid cancer |
| ∗log2FC in expression of this searched gene in stem-like cells from each diseased tissue sample relative to stem-like cells in normal samples in each tissue plotted against the malignancy continuum. Samples are colored based on if they are from different disease stage. |
Top |
Malignant transformation related pathway analysis |
| Find out the enriched GO biological processes and KEGG pathways involved in transition from healthy to precancer to cancer |
| Tissue | Disease Stage | Enriched GO biological Processes |
| Colorectum | AD |  |
| Colorectum | SER |  |
| Colorectum | MSS |  |
| Colorectum | MSI-H |  |
| Colorectum | FAP |  |
| ∗Top 15 enriched GO BP terms are showed in the bar plot of each disease state in each tissue. Each row represents a significant GO biological process which is colored according to the -log10(p.adjust). |
| Page: 1 2 3 4 5 6 7 8 9 |
| GO ID | Tissue | Disease Stage | Description | Gene Ratio | Bg Ratio | pvalue | p.adjust | Count |
| GO:00432549 | Breast | Precancer | regulation of protein-containing complex assembly | 50/1080 | 428/18723 | 1.63e-06 | 5.97e-05 | 50 |
| GO:19029039 | Breast | Precancer | regulation of supramolecular fiber organization | 42/1080 | 383/18723 | 4.92e-05 | 1.04e-03 | 42 |
| GO:00329709 | Breast | Precancer | regulation of actin filament-based process | 42/1080 | 397/18723 | 1.11e-04 | 2.01e-03 | 42 |
| GO:00070159 | Breast | Precancer | actin filament organization | 44/1080 | 442/18723 | 3.02e-04 | 4.35e-03 | 44 |
| GO:00329569 | Breast | Precancer | regulation of actin cytoskeleton organization | 36/1080 | 358/18723 | 8.56e-04 | 9.88e-03 | 36 |
| GO:01100539 | Breast | Precancer | regulation of actin filament organization | 29/1080 | 278/18723 | 1.50e-03 | 1.55e-02 | 29 |
| GO:004325414 | Breast | IDC | regulation of protein-containing complex assembly | 61/1434 | 428/18723 | 1.77e-06 | 7.31e-05 | 61 |
| GO:003297014 | Breast | IDC | regulation of actin filament-based process | 56/1434 | 397/18723 | 6.37e-06 | 1.99e-04 | 56 |
| GO:190290314 | Breast | IDC | regulation of supramolecular fiber organization | 54/1434 | 383/18723 | 9.40e-06 | 2.66e-04 | 54 |
| GO:003295614 | Breast | IDC | regulation of actin cytoskeleton organization | 48/1434 | 358/18723 | 1.03e-04 | 1.96e-03 | 48 |
| GO:000701514 | Breast | IDC | actin filament organization | 55/1434 | 442/18723 | 2.45e-04 | 3.84e-03 | 55 |
| GO:011005314 | Breast | IDC | regulation of actin filament organization | 37/1434 | 278/18723 | 7.01e-04 | 8.58e-03 | 37 |
| GO:00322719 | Breast | IDC | regulation of protein polymerization | 32/1434 | 233/18723 | 9.19e-04 | 1.05e-02 | 32 |
| GO:00512589 | Breast | IDC | protein polymerization | 38/1434 | 297/18723 | 1.26e-03 | 1.34e-02 | 38 |
| GO:00325358 | Breast | IDC | regulation of cellular component size | 45/1434 | 383/18723 | 2.72e-03 | 2.41e-02 | 45 |
| GO:004325424 | Breast | DCIS | regulation of protein-containing complex assembly | 61/1390 | 428/18723 | 6.32e-07 | 2.71e-05 | 61 |
| GO:003297024 | Breast | DCIS | regulation of actin filament-based process | 56/1390 | 397/18723 | 2.50e-06 | 8.74e-05 | 56 |
| GO:190290324 | Breast | DCIS | regulation of supramolecular fiber organization | 54/1390 | 383/18723 | 3.82e-06 | 1.16e-04 | 54 |
| GO:003295624 | Breast | DCIS | regulation of actin cytoskeleton organization | 48/1390 | 358/18723 | 4.82e-05 | 9.92e-04 | 48 |
| GO:000701524 | Breast | DCIS | actin filament organization | 56/1390 | 442/18723 | 5.90e-05 | 1.19e-03 | 56 |
| Page: 1 2 3 4 5 6 7 8 9 10 11 12 13 14 15 16 |
| Pathway ID | Tissue | Disease Stage | Description | Gene Ratio | Bg Ratio | pvalue | p.adjust | qvalue | Count |
| Page: 1 |
Top |
Cell-cell communication analysis |
| Identification of potential cell-cell interactions between two cell types and their ligand-receptor pairs for different disease states |
| Ligand | Receptor | LRpair | Pathway | Tissue | Disease Stage |
| Page: 1 |
Top |
Single-cell gene regulatory network inference analysis |
| Find out the significant the regulons (TFs) and the target genes of each regulon across cell types for different disease states |
| TF | Cell Type | Tissue | Disease Stage | Target Gene | RSS | Regulon Activity |
| ∗The dot plots of a searched regulon are shown for all cell subpopulations in each disease state of each tissue based on the regulon specific score inferred using pySCENIC and by calculating the average expression. |
| Page: 1 |
Top |
Somatic mutation of malignant transformation related genes |
| Annotation of somatic variants for genes involved in malignant transformation |
| Hugo Symbol | Variant Class | Variant Classification | dbSNP RS | HGVSc | HGVSp | HGVSp Short | SWISSPROT | BIOTYPE | SIFT | PolyPhen | Tumor Sample Barcode | Tissue | Histology | Sex | Age | Stage | Therapy Types | Drugs | Outcome |
| COTL1 | SNV | Missense_Mutation | c.144N>G | p.Phe48Leu | p.F48L | Q14019 | protein_coding | tolerated(0.18) | benign(0.408) | TCGA-AC-A23H-01 | Breast | breast invasive carcinoma | Female | >=65 | I/II | Unknown | Unknown | PD | |
| COTL1 | SNV | Missense_Mutation | c.398G>T | p.Gly133Val | p.G133V | Q14019 | protein_coding | deleterious(0) | probably_damaging(0.989) | TCGA-AD-A5EJ-01 | Colorectum | colon adenocarcinoma | Female | >=65 | I/II | Unknown | Unknown | SD | |
| COTL1 | SNV | Missense_Mutation | rs750865355 | c.256G>A | p.Val86Ile | p.V86I | Q14019 | protein_coding | tolerated(0.12) | benign(0.043) | TCGA-CM-4743-01 | Colorectum | colon adenocarcinoma | Male | >=65 | I/II | Chemotherapy | capecitabine | SD |
| COTL1 | SNV | Missense_Mutation | novel | c.221N>T | p.Ser74Phe | p.S74F | Q14019 | protein_coding | tolerated(0.1) | benign(0.224) | TCGA-A5-A0G2-01 | Endometrium | uterine corpus endometrioid carcinoma | Female | <65 | III/IV | Unknown | Unknown | SD |
| COTL1 | SNV | Missense_Mutation | novel | c.338T>C | p.Val113Ala | p.V113A | Q14019 | protein_coding | tolerated(0.51) | benign(0.087) | TCGA-DI-A1BU-01 | Endometrium | uterine corpus endometrioid carcinoma | Female | <65 | I/II | Chemotherapy | paclitaxel | SD |
| COTL1 | SNV | Missense_Mutation | rs374406128 | c.422N>T | p.Thr141Met | p.T141M | Q14019 | protein_coding | tolerated_low_confidence(0.16) | benign(0.003) | TCGA-EO-A3KX-01 | Endometrium | uterine corpus endometrioid carcinoma | Female | >=65 | I/II | Unknown | Unknown | SD |
| COTL1 | SNV | Missense_Mutation | c.284N>A | p.Gly95Glu | p.G95E | Q14019 | protein_coding | deleterious(0.01) | possibly_damaging(0.478) | TCGA-44-3917-01 | Lung | lung adenocarcinoma | Female | <65 | I/II | Unknown | Unknown | SD | |
| COTL1 | SNV | Missense_Mutation | rs755533045 | c.188N>C | p.Arg63Pro | p.R63P | Q14019 | protein_coding | deleterious(0) | probably_damaging(0.98) | TCGA-53-7624-01 | Lung | lung adenocarcinoma | Female | <65 | III/IV | Chemotherapy | cisplatin | PD |
| COTL1 | SNV | Missense_Mutation | rs749367597 | c.287N>T | p.Thr96Met | p.T96M | Q14019 | protein_coding | deleterious(0) | probably_damaging(0.999) | TCGA-55-8506-01 | Lung | lung adenocarcinoma | Female | <65 | I/II | Unknown | Unknown | SD |
| COTL1 | SNV | Missense_Mutation | rs749367597 | c.287N>T | p.Thr96Met | p.T96M | Q14019 | protein_coding | deleterious(0) | probably_damaging(0.999) | TCGA-CQ-A4C9-01 | Oral cavity | head & neck squamous cell carcinoma | Male | <65 | III/IV | Unknown | Unknown | PD |
| Page: 1 2 |
Top |
Related drugs of malignant transformation related genes |
| Identification of chemicals and drugs interact with genes involved in malignant transfromation |
| (DGIdb 4.0) |
| Entrez ID | Symbol | Category | Interaction Types | Drug Claim Name | Drug Name | PMIDs |
| Page: 1 |

Copyright 2023-Present -The University of Texas Health Science Center at Houston |