
|
|||||
|
 | |
| |
| |
| |
| |
| |
|
Gene: COPZ2 |
Gene summary for COPZ2 |
| Gene information | Species | Human | Gene symbol | COPZ2 | Gene ID | 51226 |
| Gene name | COPI coat complex subunit zeta 2 | |
| Gene Alias | zeta2-COP | |
| Cytomap | 17q21.32 | |
| Gene Type | protein-coding | GO ID | GO:0006810 | UniProtAcc | Q9P299 |
Top |
Malignant transformation analysis |
| Identification of the aberrant gene expression in precancerous and cancerous lesions by comparing the gene expression of stem-like cells in diseased tissues with normal stem cells |
| Entrez ID | Symbol | Replicates | Species | Organ | Tissue | Adj P-value | Log2FC | Malignancy |
| 51226 | COPZ2 | C06 | Human | Oral cavity | OSCC | 4.64e-08 | 1.79e+00 | 0.2699 |
| 51226 | COPZ2 | C07 | Human | Oral cavity | OSCC | 5.80e-05 | 1.05e+00 | 0.2491 |
| 51226 | COPZ2 | C08 | Human | Oral cavity | OSCC | 1.44e-51 | 1.36e+00 | 0.1919 |
| 51226 | COPZ2 | LN38 | Human | Oral cavity | OSCC | 4.37e-04 | 1.08e+00 | 0.168 |
| 51226 | COPZ2 | LN46 | Human | Oral cavity | OSCC | 1.15e-05 | 3.83e-01 | 0.1666 |
| 51226 | COPZ2 | SYSMH1 | Human | Oral cavity | OSCC | 9.31e-22 | 5.64e-01 | 0.1127 |
| 51226 | COPZ2 | SYSMH2 | Human | Oral cavity | OSCC | 3.26e-17 | 7.43e-01 | 0.2326 |
| 51226 | COPZ2 | SYSMH3 | Human | Oral cavity | OSCC | 8.73e-17 | 6.89e-01 | 0.2442 |
| 51226 | COPZ2 | SYSMH5 | Human | Oral cavity | OSCC | 5.82e-08 | 3.42e-01 | 0.0647 |
| 51226 | COPZ2 | P4_S8_cSCC | Human | Skin | cSCC | 6.50e-16 | 3.46e-01 | -0.3095 |
| 51226 | COPZ2 | P5_S10_cSCC | Human | Skin | cSCC | 1.61e-10 | 3.04e-01 | -0.299 |
| 51226 | COPZ2 | P1_cSCC | Human | Skin | cSCC | 8.04e-21 | 9.56e-01 | 0.0292 |
| 51226 | COPZ2 | P2_cSCC | Human | Skin | cSCC | 1.16e-04 | 2.78e-01 | -0.024 |
| 51226 | COPZ2 | P4_cSCC | Human | Skin | cSCC | 3.06e-18 | 6.45e-01 | -0.00290000000000005 |
| 51226 | COPZ2 | P10_cSCC | Human | Skin | cSCC | 4.09e-05 | 3.09e-01 | 0.1017 |
| 51226 | COPZ2 | cSCC_p8 | Human | Skin | cSCC | 5.18e-03 | 1.19e-01 | -0.1971 |
| 51226 | COPZ2 | cSCC_p9 | Human | Skin | cSCC | 1.20e-03 | 1.94e-01 | -0.1991 |
| 51226 | COPZ2 | PTC06 | Human | Thyroid | PTC | 2.05e-04 | 8.12e-02 | 0.2057 |
| 51226 | COPZ2 | PTC07 | Human | Thyroid | PTC | 4.58e-07 | 8.06e-02 | 0.2044 |
| 51226 | COPZ2 | ATC09 | Human | Thyroid | ATC | 1.90e-02 | 1.59e-01 | 0.2871 |
| Page: 1 2 3 4 |
| Tissue | Expression Dynamics | Abbreviation |
| Cervix |  | CC: Cervix cancer |
| HSIL_HPV: HPV-infected high-grade squamous intraepithelial lesions | ||
| N_HPV: HPV-infected normal cervix | ||
| Esophagus | 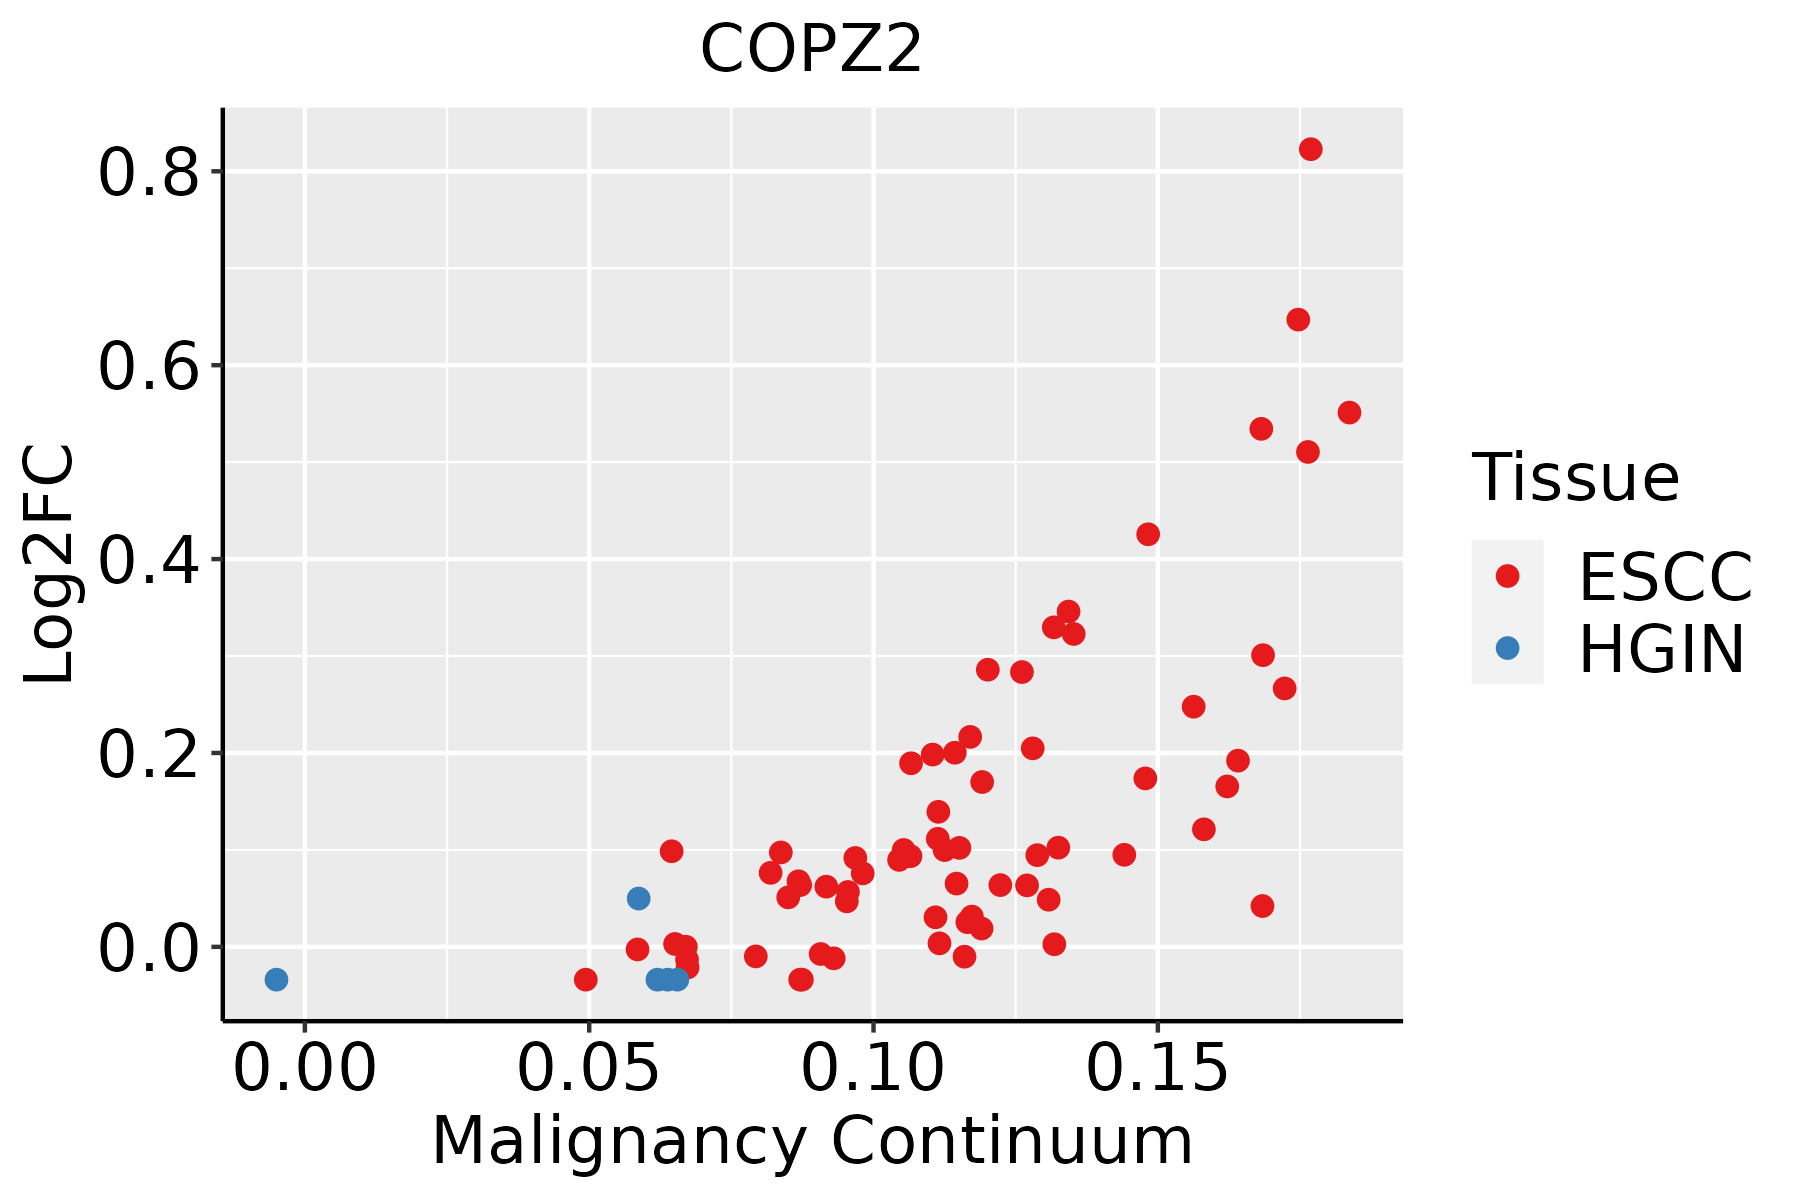 | ESCC: Esophageal squamous cell carcinoma |
| HGIN: High-grade intraepithelial neoplasias | ||
| LGIN: Low-grade intraepithelial neoplasias | ||
| Oral Cavity | 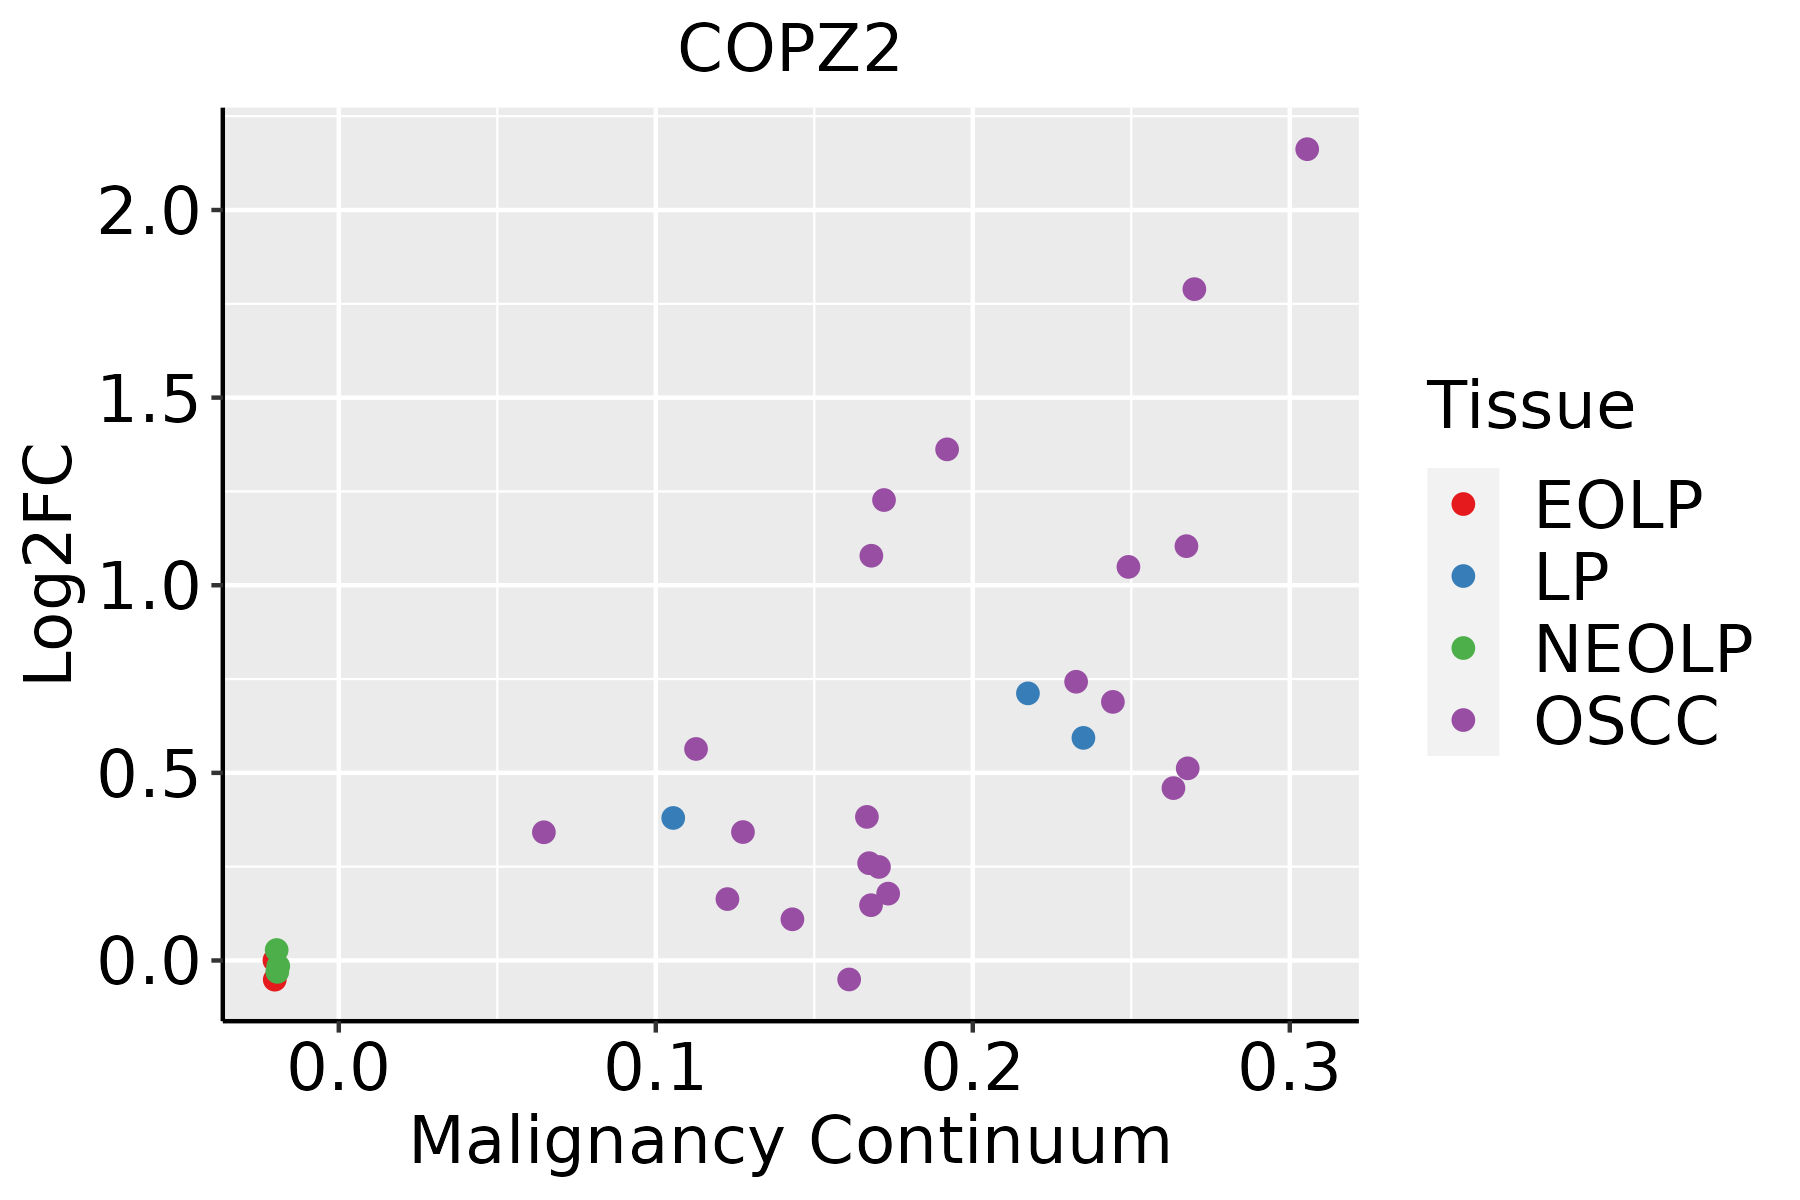 | EOLP: Erosive Oral lichen planus |
| LP: leukoplakia | ||
| NEOLP: Non-erosive oral lichen planus | ||
| OSCC: Oral squamous cell carcinoma | ||
| Skin | 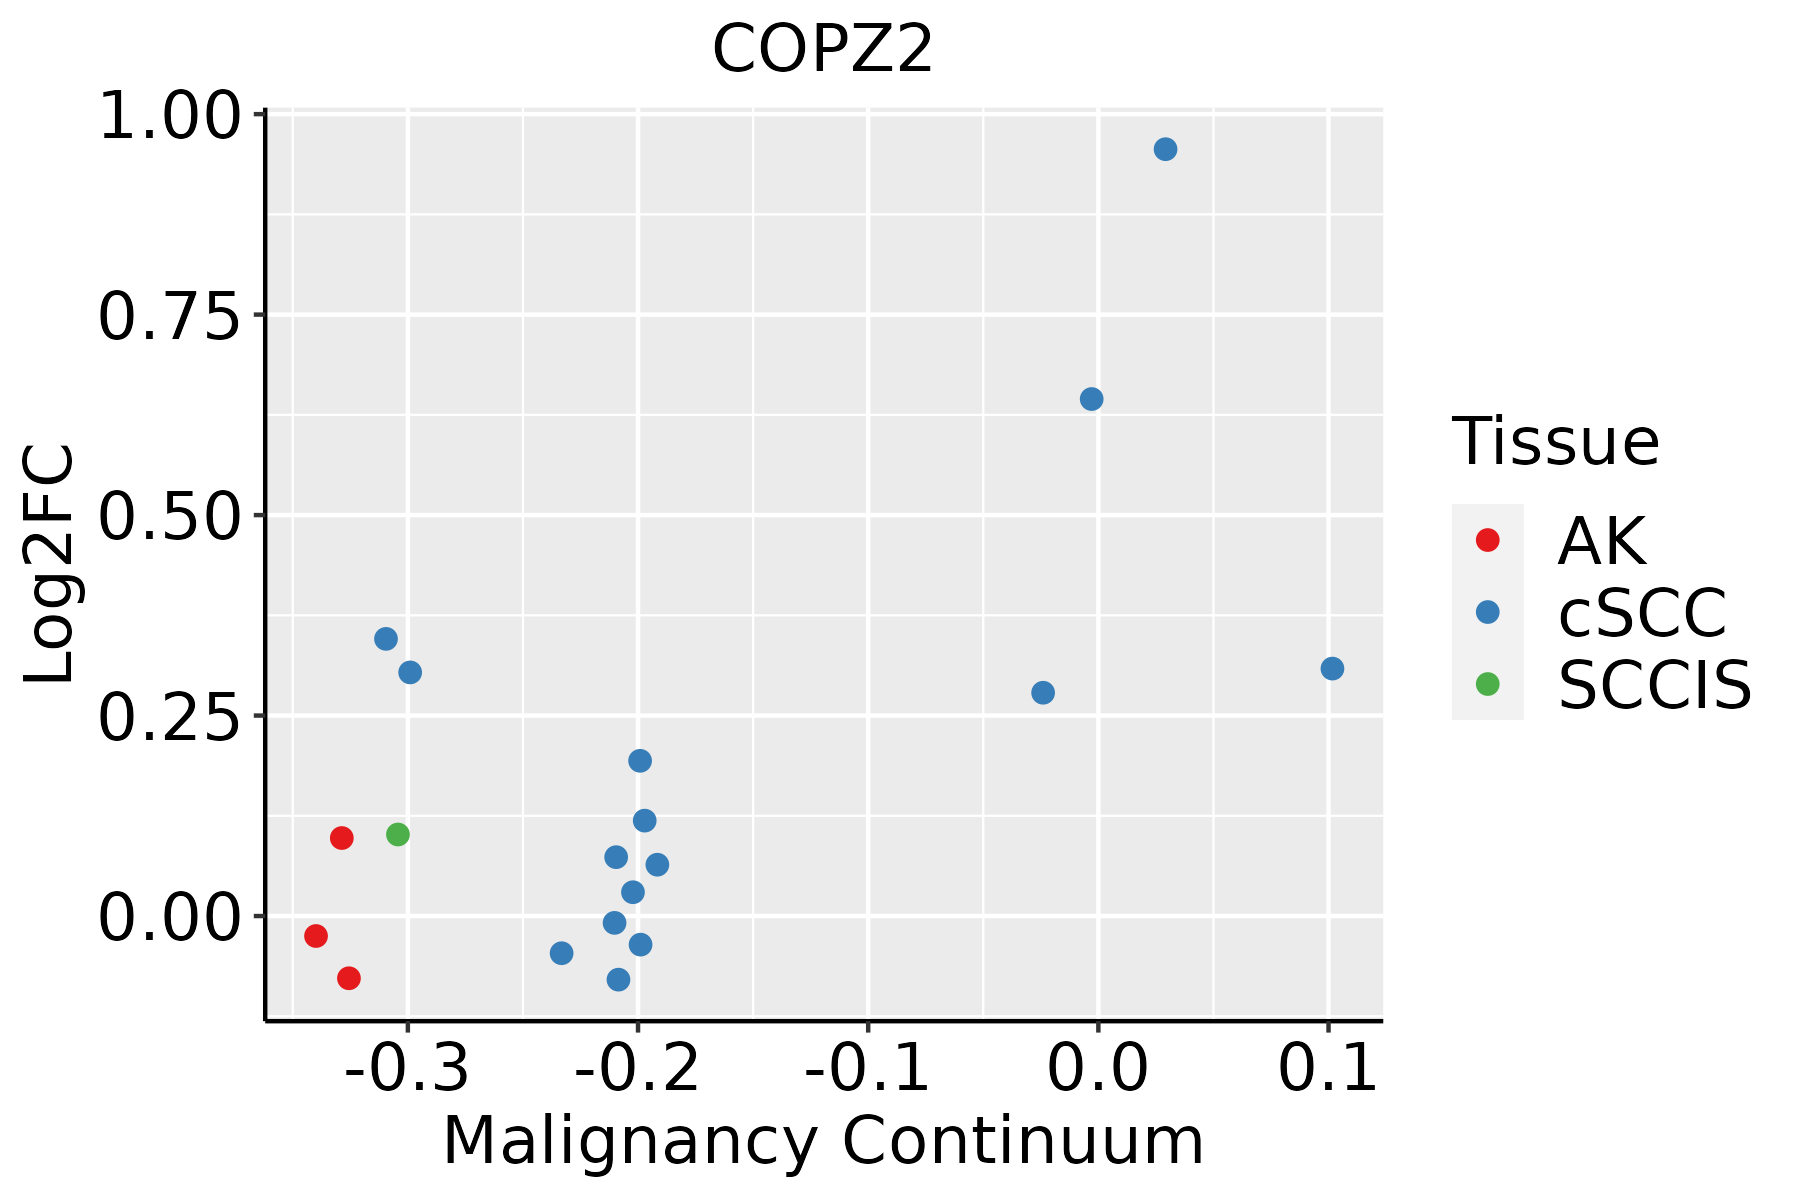 | AK: Actinic keratosis |
| cSCC: Cutaneous squamous cell carcinoma | ||
| SCCIS:squamous cell carcinoma in situ | ||
| Thyroid | 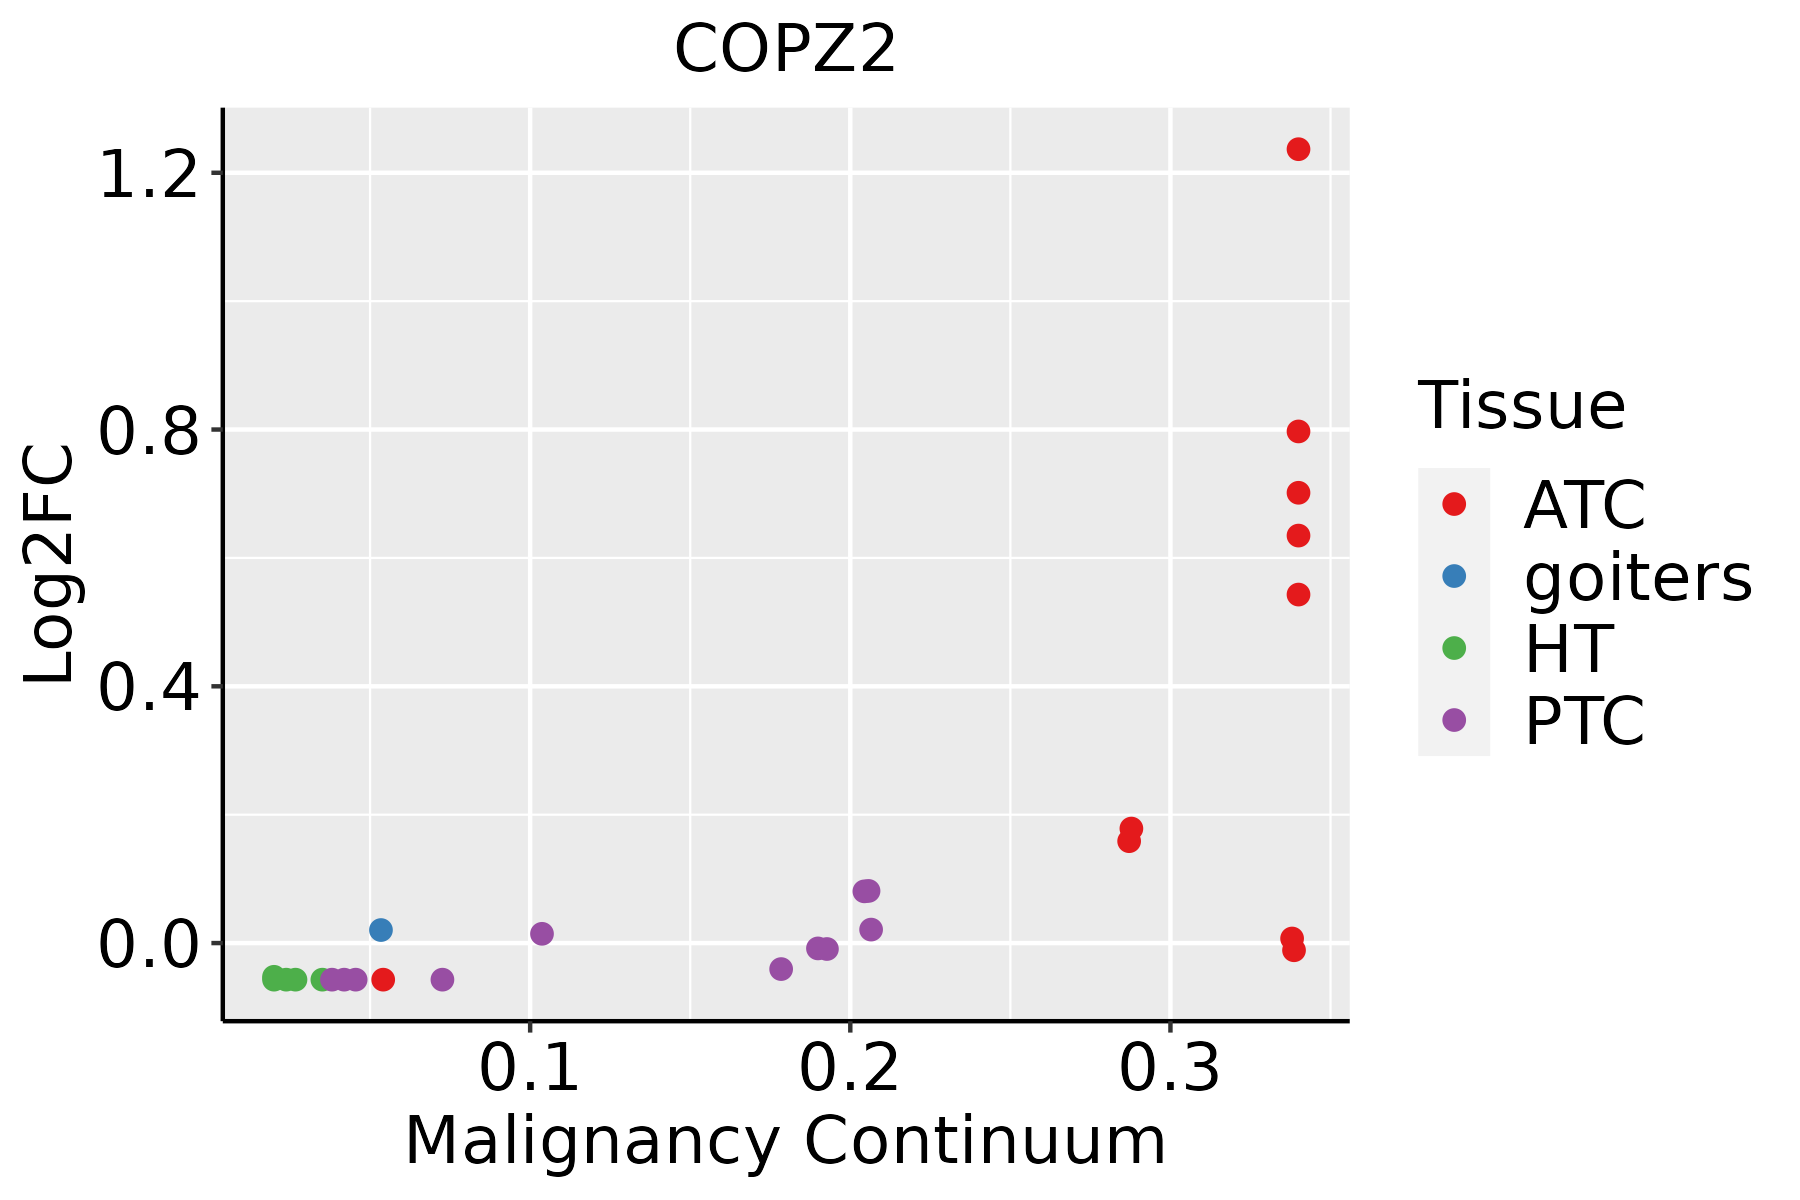 | ATC: Anaplastic thyroid cancer |
| HT: Hashimoto's thyroiditis | ||
| PTC: Papillary thyroid cancer |
| ∗log2FC in expression of this searched gene in stem-like cells from each diseased tissue sample relative to stem-like cells in normal samples in each tissue plotted against the malignancy continuum. Samples are colored based on if they are from different disease stage. |
Top |
Malignant transformation related pathway analysis |
| Find out the enriched GO biological processes and KEGG pathways involved in transition from healthy to precancer to cancer |
| Tissue | Disease Stage | Enriched GO biological Processes |
| Colorectum | AD |  |
| Colorectum | SER |  |
| Colorectum | MSS |  |
| Colorectum | MSI-H |  |
| Colorectum | FAP |  |
| ∗Top 15 enriched GO BP terms are showed in the bar plot of each disease state in each tissue. Each row represents a significant GO biological process which is colored according to the -log10(p.adjust). |
| Page: 1 2 3 4 5 6 7 8 9 |
| GO ID | Tissue | Disease Stage | Description | Gene Ratio | Bg Ratio | pvalue | p.adjust | Count |
| GO:00481938 | Cervix | CC | Golgi vesicle transport | 58/2311 | 296/18723 | 2.24e-04 | 2.54e-03 | 58 |
| GO:00068907 | Cervix | CC | retrograde vesicle-mediated transport, Golgi to endoplasmic reticulum | 15/2311 | 52/18723 | 1.15e-03 | 9.39e-03 | 15 |
| GO:004819318 | Esophagus | ESCC | Golgi vesicle transport | 231/8552 | 296/18723 | 1.82e-30 | 9.63e-28 | 231 |
| GO:000689017 | Esophagus | ESCC | retrograde vesicle-mediated transport, Golgi to endoplasmic reticulum | 46/8552 | 52/18723 | 1.23e-10 | 3.66e-09 | 46 |
| GO:00068914 | Esophagus | ESCC | intra-Golgi vesicle-mediated transport | 26/8552 | 33/18723 | 1.06e-04 | 7.43e-04 | 26 |
| GO:004819315 | Oral cavity | OSCC | Golgi vesicle transport | 209/7305 | 296/18723 | 1.39e-28 | 6.30e-26 | 209 |
| GO:000689010 | Oral cavity | OSCC | retrograde vesicle-mediated transport, Golgi to endoplasmic reticulum | 40/7305 | 52/18723 | 2.86e-08 | 5.50e-07 | 40 |
| GO:00068913 | Oral cavity | OSCC | intra-Golgi vesicle-mediated transport | 23/7305 | 33/18723 | 3.47e-04 | 2.12e-03 | 23 |
| GO:0048193110 | Skin | cSCC | Golgi vesicle transport | 153/4864 | 296/18723 | 1.85e-21 | 3.41e-19 | 153 |
| GO:000689018 | Skin | cSCC | retrograde vesicle-mediated transport, Golgi to endoplasmic reticulum | 27/4864 | 52/18723 | 5.68e-05 | 5.67e-04 | 27 |
| GO:000689112 | Skin | cSCC | intra-Golgi vesicle-mediated transport | 18/4864 | 33/18723 | 4.45e-04 | 3.42e-03 | 18 |
| GO:004819320 | Thyroid | PTC | Golgi vesicle transport | 186/5968 | 296/18723 | 3.09e-28 | 1.22e-25 | 186 |
| GO:000689019 | Thyroid | PTC | retrograde vesicle-mediated transport, Golgi to endoplasmic reticulum | 37/5968 | 52/18723 | 6.98e-09 | 1.75e-07 | 37 |
| GO:00068916 | Thyroid | PTC | intra-Golgi vesicle-mediated transport | 20/5968 | 33/18723 | 6.26e-04 | 3.96e-03 | 20 |
| GO:0048193111 | Thyroid | ATC | Golgi vesicle transport | 189/6293 | 296/18723 | 9.58e-27 | 5.05e-24 | 189 |
| GO:0006890110 | Thyroid | ATC | retrograde vesicle-mediated transport, Golgi to endoplasmic reticulum | 37/6293 | 52/18723 | 3.45e-08 | 6.43e-07 | 37 |
| GO:000689113 | Thyroid | ATC | intra-Golgi vesicle-mediated transport | 20/6293 | 33/18723 | 1.33e-03 | 6.96e-03 | 20 |
| Page: 1 |
| Pathway ID | Tissue | Disease Stage | Description | Gene Ratio | Bg Ratio | pvalue | p.adjust | qvalue | Count |
| Page: 1 |
Top |
Cell-cell communication analysis |
| Identification of potential cell-cell interactions between two cell types and their ligand-receptor pairs for different disease states |
| Ligand | Receptor | LRpair | Pathway | Tissue | Disease Stage |
| Page: 1 |
Top |
Single-cell gene regulatory network inference analysis |
| Find out the significant the regulons (TFs) and the target genes of each regulon across cell types for different disease states |
| TF | Cell Type | Tissue | Disease Stage | Target Gene | RSS | Regulon Activity |
| ∗The dot plots of a searched regulon are shown for all cell subpopulations in each disease state of each tissue based on the regulon specific score inferred using pySCENIC and by calculating the average expression. |
| Page: 1 |
Top |
Somatic mutation of malignant transformation related genes |
| Annotation of somatic variants for genes involved in malignant transformation |
| Hugo Symbol | Variant Class | Variant Classification | dbSNP RS | HGVSc | HGVSp | HGVSp Short | SWISSPROT | BIOTYPE | SIFT | PolyPhen | Tumor Sample Barcode | Tissue | Histology | Sex | Age | Stage | Therapy Types | Drugs | Outcome |
| COPZ2 | SNV | Missense_Mutation | novel | c.265N>C | p.Glu89Gln | p.E89Q | Q9P299 | protein_coding | deleterious(0.05) | benign(0.266) | TCGA-AC-A23H-01 | Breast | breast invasive carcinoma | Female | >=65 | I/II | Unknown | Unknown | PD |
| COPZ2 | SNV | Missense_Mutation | novel | c.185N>G | p.Lys62Arg | p.K62R | Q9P299 | protein_coding | deleterious(0.04) | benign(0.409) | TCGA-EA-A410-01 | Cervix | cervical & endocervical cancer | Female | <65 | I/II | Unknown | Unknown | SD |
| COPZ2 | SNV | Missense_Mutation | novel | c.589N>A | p.Leu197Ile | p.L197I | Q9P299 | protein_coding | tolerated(0.1) | benign(0.061) | TCGA-AA-A00N-01 | Colorectum | colon adenocarcinoma | Male | >=65 | I/II | Unknown | Unknown | PD |
| COPZ2 | SNV | Missense_Mutation | novel | c.289N>A | p.Gly97Ser | p.G97S | Q9P299 | protein_coding | tolerated(0.06) | possibly_damaging(0.788) | TCGA-AG-3592-01 | Colorectum | rectum adenocarcinoma | Male | >=65 | I/II | Unknown | Unknown | SD |
| COPZ2 | SNV | Missense_Mutation | novel | c.627N>T | p.Leu209Phe | p.L209F | Q9P299 | protein_coding | deleterious(0.03) | benign(0.228) | TCGA-F5-6814-01 | Colorectum | rectum adenocarcinoma | Male | <65 | I/II | Unknown | Unknown | SD |
| COPZ2 | SNV | Missense_Mutation | rs759539918 | c.332N>G | p.Tyr111Cys | p.Y111C | Q9P299 | protein_coding | deleterious(0.02) | possibly_damaging(0.841) | TCGA-A5-A1OF-01 | Endometrium | uterine corpus endometrioid carcinoma | Female | <65 | I/II | Unknown | Unknown | SD |
| COPZ2 | SNV | Missense_Mutation | novel | c.328C>A | p.Leu110Ile | p.L110I | Q9P299 | protein_coding | deleterious(0.01) | benign(0.403) | TCGA-B5-A1MX-01 | Endometrium | uterine corpus endometrioid carcinoma | Female | <65 | I/II | Hormone Therapy | megace | SD |
| COPZ2 | SNV | Missense_Mutation | novel | c.614N>C | p.Lys205Thr | p.K205T | Q9P299 | protein_coding | tolerated(0.1) | possibly_damaging(0.77) | TCGA-DF-A2KV-01 | Endometrium | uterine corpus endometrioid carcinoma | Female | <65 | I/II | Unknown | Unknown | SD |
| COPZ2 | SNV | Missense_Mutation | novel | c.521N>G | p.Gln174Arg | p.Q174R | Q9P299 | protein_coding | tolerated(0.16) | benign(0.007) | TCGA-FI-A2D4-01 | Endometrium | uterine corpus endometrioid carcinoma | Female | <65 | III/IV | Chemotherapy | carboplatinum | PD |
| COPZ2 | SNV | Missense_Mutation | novel | c.263C>A | p.Thr88Asn | p.T88N | Q9P299 | protein_coding | deleterious(0.02) | benign(0.282) | TCGA-05-4410-01 | Lung | lung adenocarcinoma | Male | <65 | I/II | Unknown | Unknown | SD |
| Page: 1 2 |
Top |
Related drugs of malignant transformation related genes |
| Identification of chemicals and drugs interact with genes involved in malignant transfromation |
| (DGIdb 4.0) |
| Entrez ID | Symbol | Category | Interaction Types | Drug Claim Name | Drug Name | PMIDs |
| Page: 1 |

Copyright 2023-Present -The University of Texas Health Science Center at Houston |