Schematic overview of the cellular and molecular mechanisms involved in the cancer progression, including the proposed cellular and molecular mechanisms in cancer cells trajectory. AT1: alveolar type 1 cells; AT2: alveolar type 2 cells; AAH: atypical adenomatous hyperplasia; AIS: adenocarcinoma in situ; MIA: minimally invasive adenocarcinoma; IA: invasive adenocarcinoma; EMT: epithelial-mesenchymal transition

Home

Download

Statistics

Help

Contact

Center for Computational Systems Medicine
leaf

Gene summary

leaf

Malignant transformation analysis

leaf

Malignant transformation related pathway analysis

leaf

Cell-cell communication analysis

leaf

Single-cell gene regulatory network inference analysis

leaf

Somatic mutation of malignant transformation related genes

leaf

Related drugs of malignant transformation related genes

Gene: COL5A2

Gene summary for COL5A2

check button Gene summary.

Gene informationSpeciesHuman
Gene symbol

COL5A2

Gene ID

1290

Gene namecollagen type V alpha 2 chain
Gene AliasEDSC
Cytomap2q32.2
Gene Typeprotein-coding
GO ID

GO:0001101

UniProtAcc

P05997


Top

Malignant transformation analysis

check button Identification of the aberrant gene expression in precancerous and cancerous lesions by comparing the gene expression of stem-like cells in diseased tissues with normal stem cells
check button Malignant transformation involving gene list.
Entrez IDSymbolReplicatesSpeciesOrganTissueAdj P-valueLog2FCMalignancy
1290COL5A2NEOLP-2HumanOral cavityNEOLP4.26e-133.95e-01-0.0196
1290COL5A2NEOLP-3HumanOral cavityNEOLP9.78e-133.69e-01-0.0191
1290COL5A2SYSMH2HumanOral cavityOSCC9.65e-043.50e-010.2326
1290COL5A2SYSMH3HumanOral cavityOSCC1.76e-299.57e-010.2442
1290COL5A2SYSMH5HumanOral cavityOSCC3.12e-092.19e-010.0647
1290COL5A2P10_cSCCHumanSkincSCC2.33e-186.78e-010.1017
1290COL5A2PTC05HumanThyroidPTC3.13e-021.12e-010.2065
1290COL5A2ATC09HumanThyroidATC1.73e-134.50e-010.2871
1290COL5A2ATC11HumanThyroidATC1.89e-181.54e+000.3386
1290COL5A2ATC12HumanThyroidATC1.96e-972.53e+000.34
1290COL5A2ATC13HumanThyroidATC8.54e-1313.34e+000.34
1290COL5A2ATC1HumanThyroidATC7.86e-124.67e-010.2878
1290COL5A2ATC2HumanThyroidATC3.79e-303.42e+000.34
1290COL5A2ATC3HumanThyroidATC4.06e-211.36e+000.338
1290COL5A2ATC4HumanThyroidATC3.49e-1082.84e+000.34
1290COL5A2ATC5HumanThyroidATC3.93e-1383.47e+000.34
Page: 1 2 3 

check button Transcriptomic changes along malignancy continuum.
TissueExpression DynamicsAbbreviation
EsophagusThe image shows the transcriptomic changes along malignancy continuum.log2FC in expression of this searched gene in stem-like cells from each diseased tissue sample relative to stem-like cells in normal samples in each tissue plotted against the malignancy continuum. Samples are colored based on if they are from different disease stage.
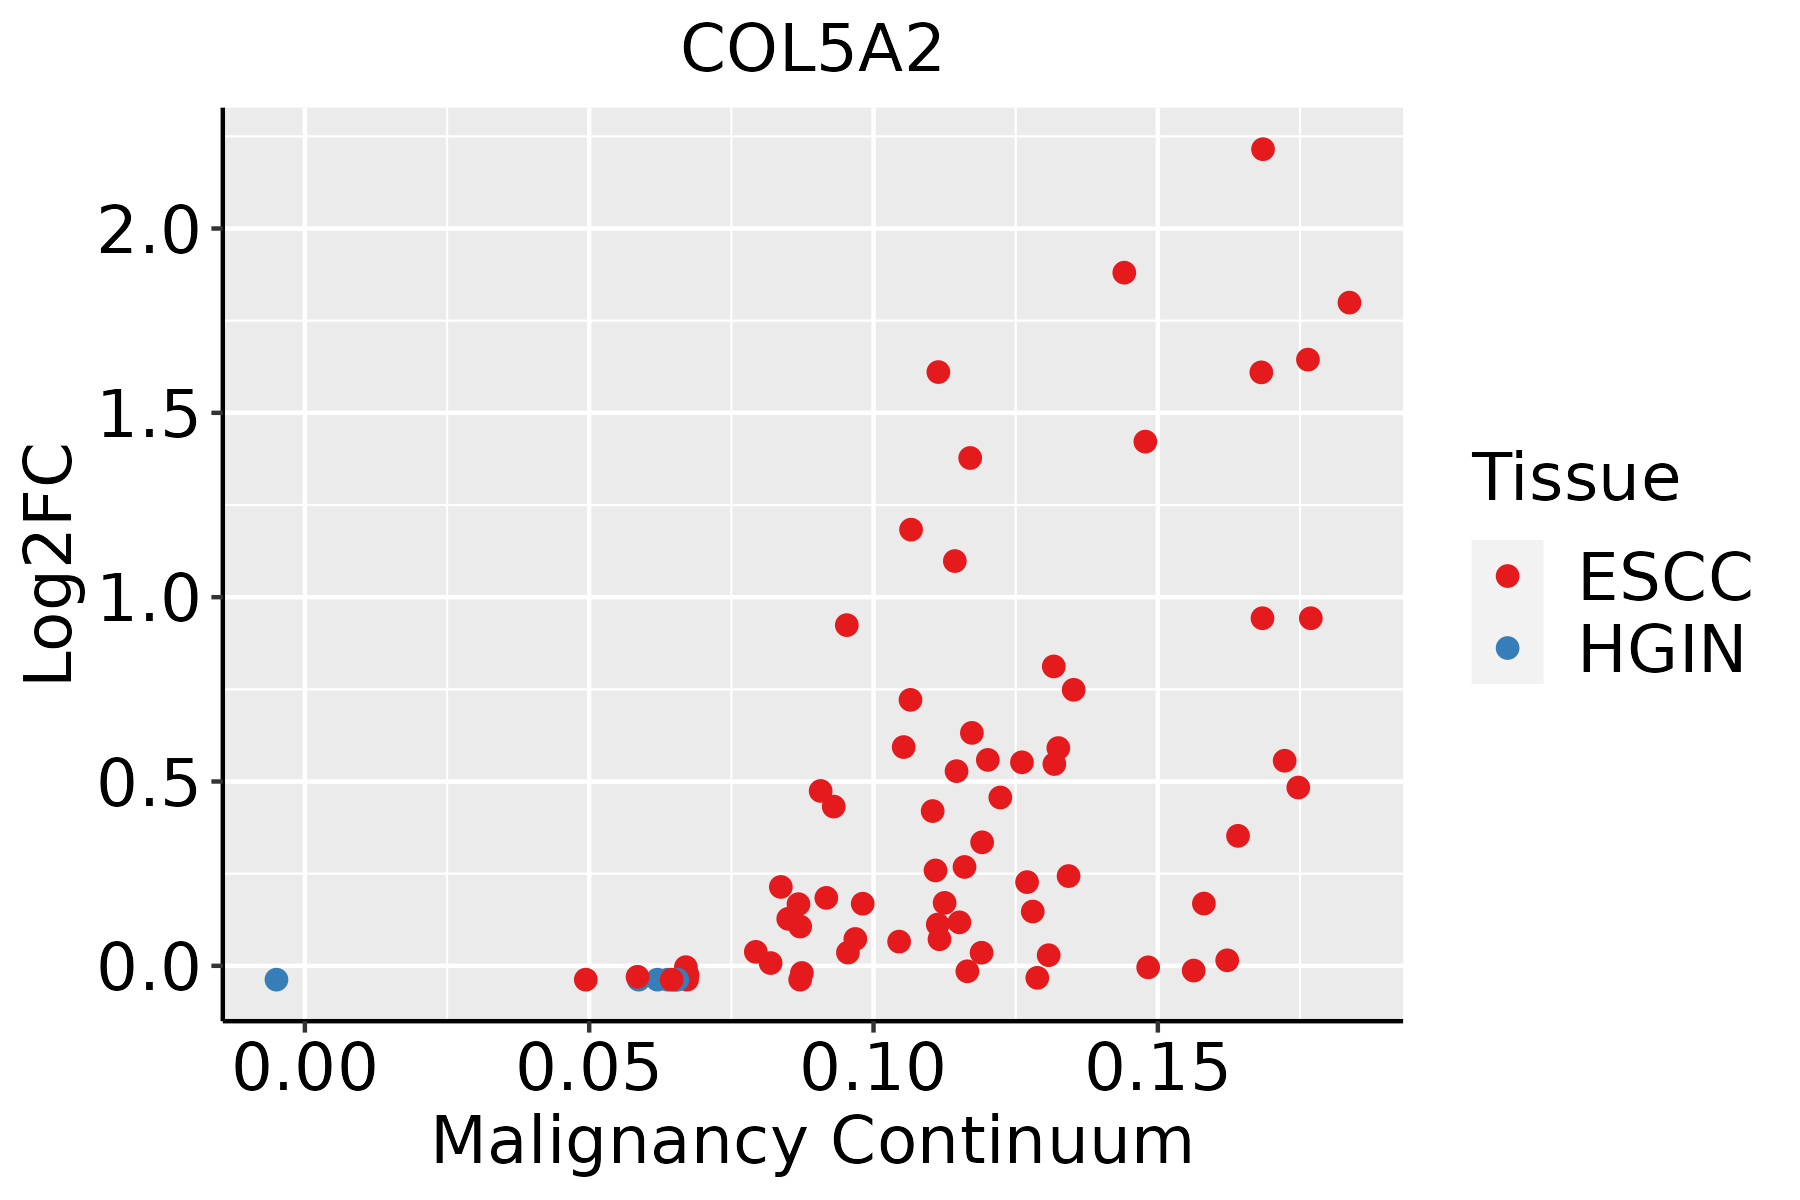
ESCC: Esophageal squamous cell carcinoma
HGIN: High-grade intraepithelial neoplasias
LGIN: Low-grade intraepithelial neoplasias
LiverThe image shows the transcriptomic changes along malignancy continuum.log2FC in expression of this searched gene in stem-like cells from each diseased tissue sample relative to stem-like cells in normal samples in each tissue plotted against the malignancy continuum. Samples are colored based on if they are from different disease stage.
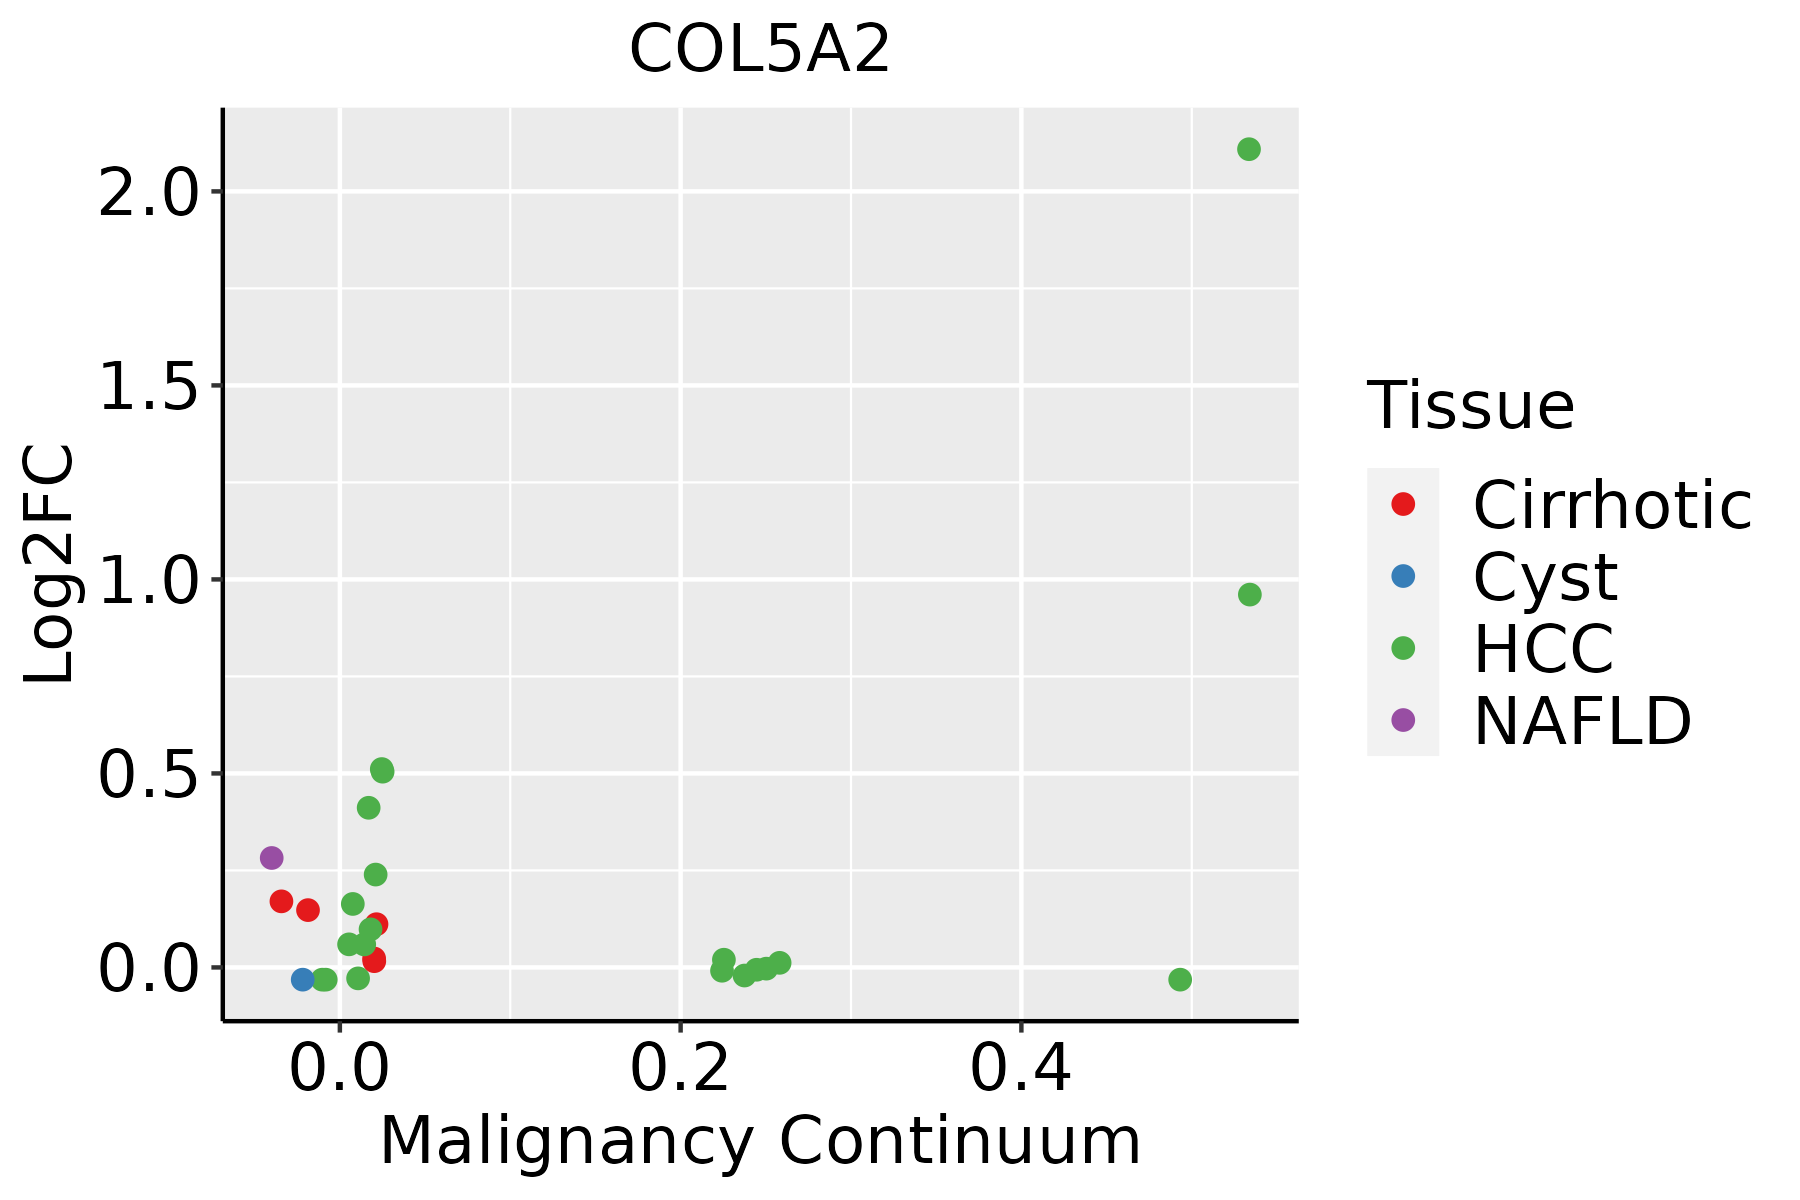
HCC: Hepatocellular carcinoma
NAFLD: Non-alcoholic fatty liver disease
Oral CavityThe image shows the transcriptomic changes along malignancy continuum.log2FC in expression of this searched gene in stem-like cells from each diseased tissue sample relative to stem-like cells in normal samples in each tissue plotted against the malignancy continuum. Samples are colored based on if they are from different disease stage.
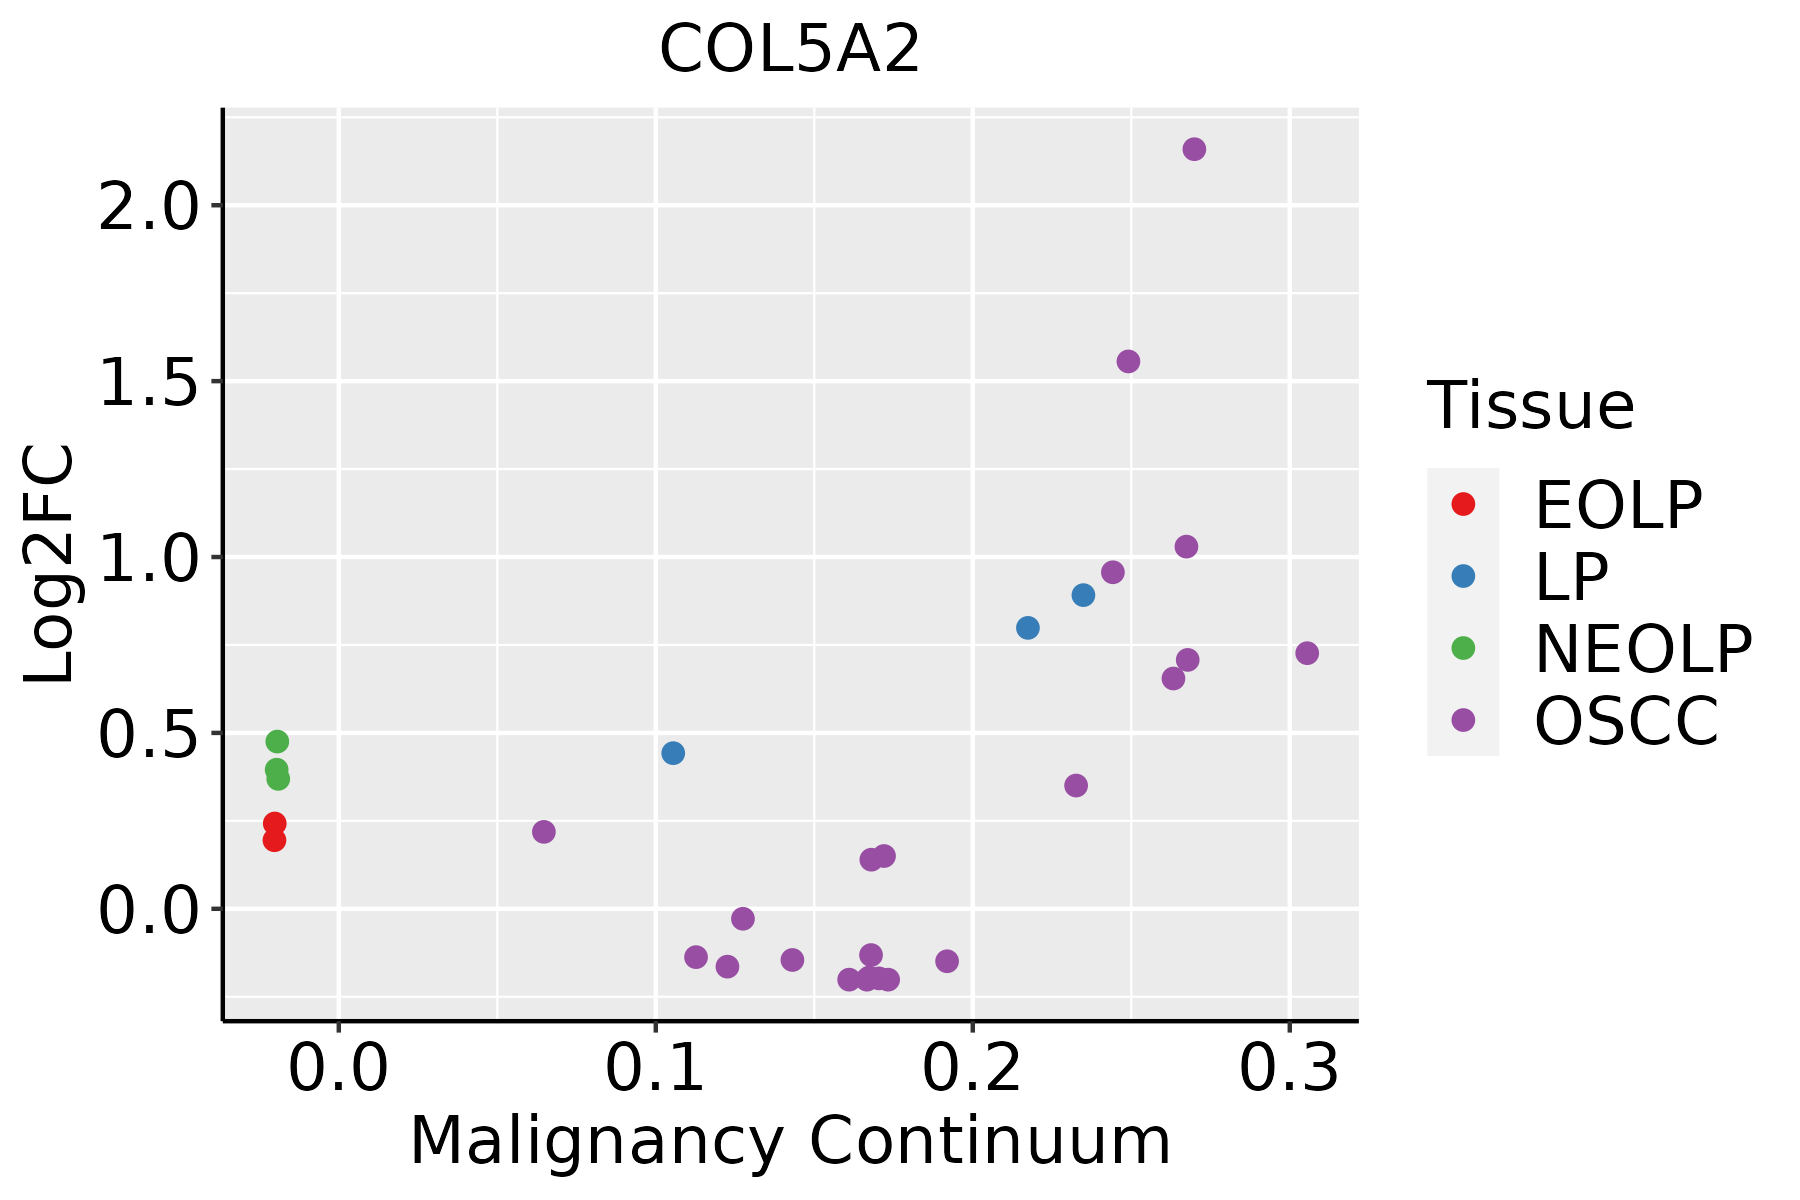
EOLP: Erosive Oral lichen planus
LP: leukoplakia
NEOLP: Non-erosive oral lichen planus
OSCC: Oral squamous cell carcinoma
SkinThe image shows the transcriptomic changes along malignancy continuum.log2FC in expression of this searched gene in stem-like cells from each diseased tissue sample relative to stem-like cells in normal samples in each tissue plotted against the malignancy continuum. Samples are colored based on if they are from different disease stage.AK: Actinic keratosis
cSCC: Cutaneous squamous cell carcinoma
SCCIS:squamous cell carcinoma in situ
ThyroidThe image shows the transcriptomic changes along malignancy continuum.log2FC in expression of this searched gene in stem-like cells from each diseased tissue sample relative to stem-like cells in normal samples in each tissue plotted against the malignancy continuum. Samples are colored based on if they are from different disease stage.
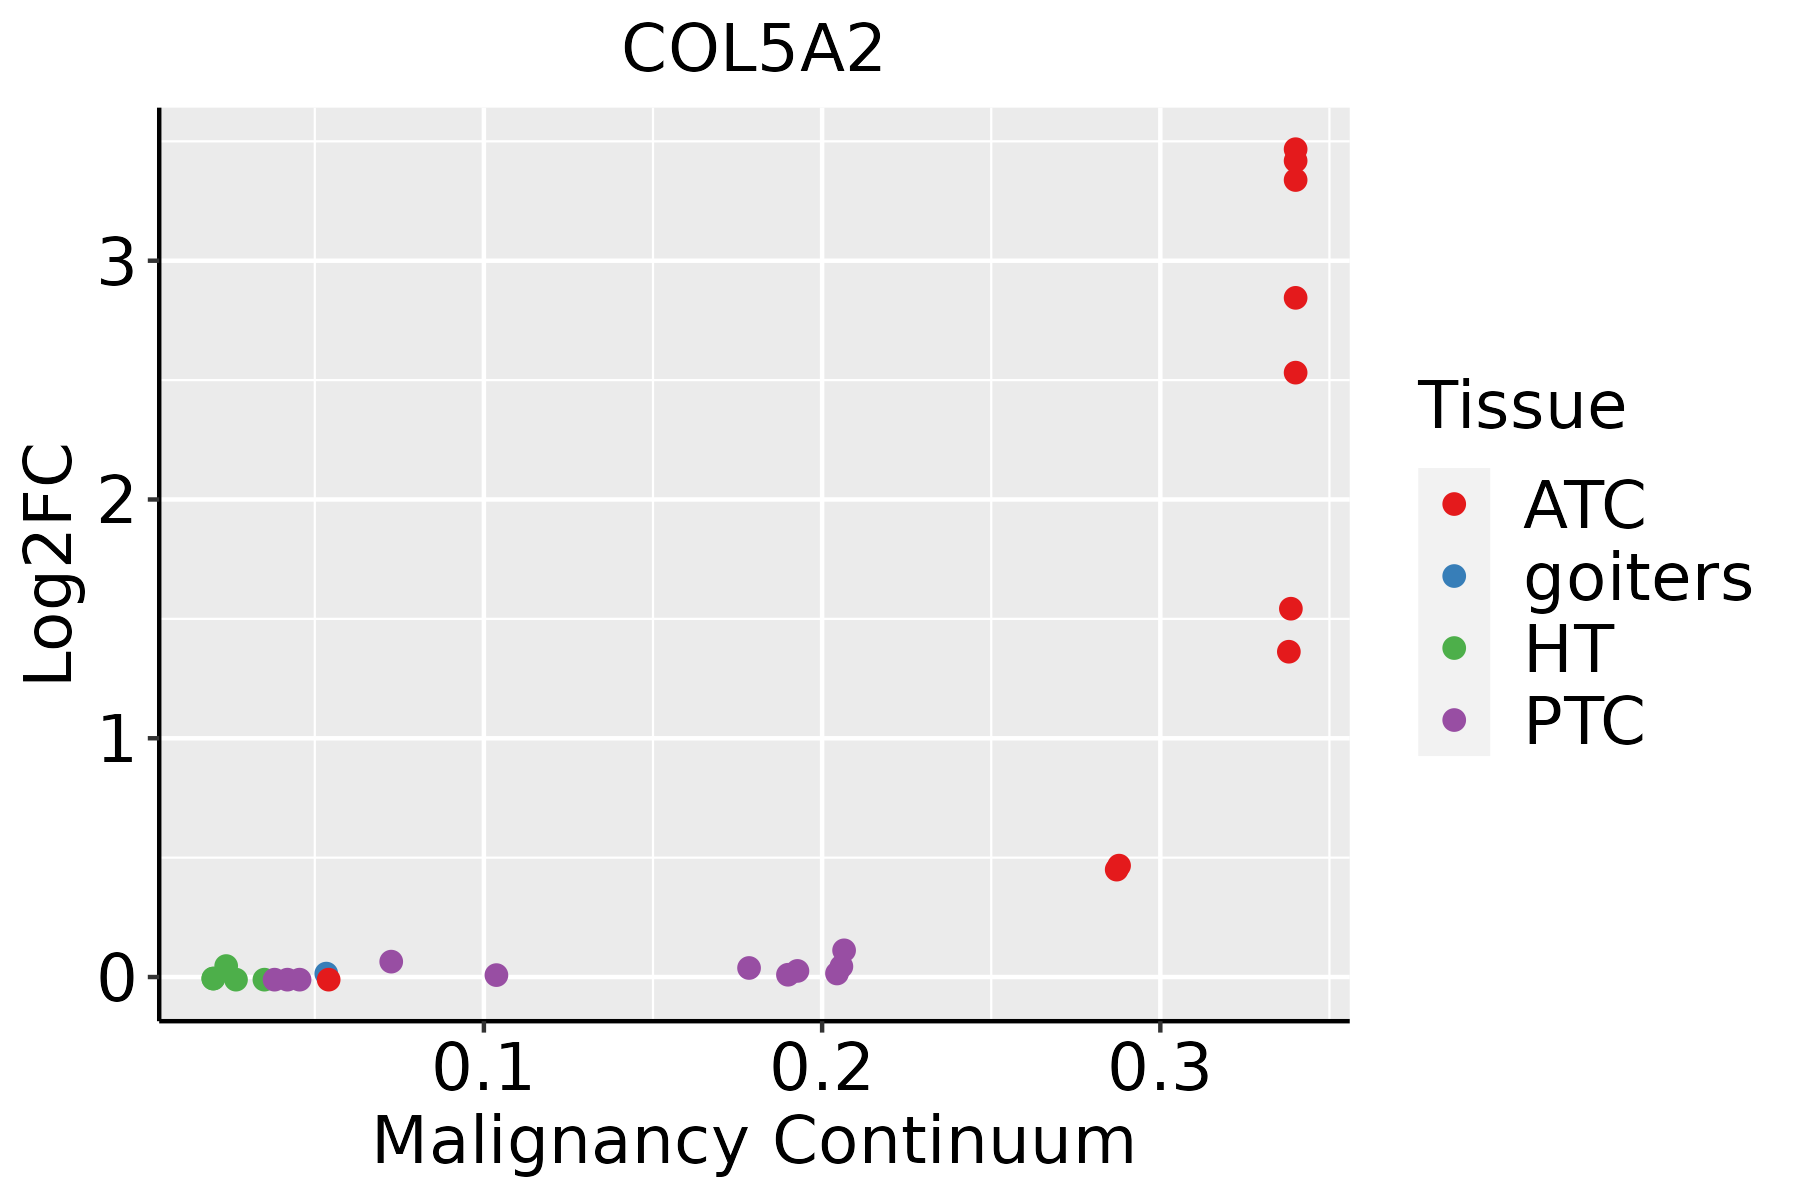
ATC: Anaplastic thyroid cancer
HT: Hashimoto's thyroiditis
PTC: Papillary thyroid cancer
∗log2FC in expression of this searched gene in stem-like cells from each diseased tissue sample relative to stem-like cells in normal samples in each tissue plotted against the malignancy continuum. Samples are colored based on if they are from different disease stage.

Top

Malignant transformation related pathway analysis

check buttonFind out the enriched GO biological processes and KEGG pathways involved in transition from healthy to precancer to cancer
check button Figure of enriched GO biological processes.
TissueDisease StageEnriched GO biological Processes
ColorectumADGO analysis - Figure of enriched GO biological processes: Top 15 enriched GO BP terms are showed in the bar plot of each disease state in each tissue. Each row represents a significant GO biological process which is colored according to the -log10(p.adjust).
ColorectumSERGO analysis - Figure of enriched GO biological processes: Top 15 enriched GO BP terms are showed in the bar plot of each disease state in each tissue. Each row represents a significant GO biological process which is colored according to the -log10(p.adjust).
ColorectumMSSGO analysis - Figure of enriched GO biological processes: Top 15 enriched GO BP terms are showed in the bar plot of each disease state in each tissue. Each row represents a significant GO biological process which is colored according to the -log10(p.adjust).
ColorectumMSI-HGO analysis - Figure of enriched GO biological processes: Top 15 enriched GO BP terms are showed in the bar plot of each disease state in each tissue. Each row represents a significant GO biological process which is colored according to the -log10(p.adjust).
ColorectumFAPGO analysis - Figure of enriched GO biological processes: Top 15 enriched GO BP terms are showed in the bar plot of each disease state in each tissue. Each row represents a significant GO biological process which is colored according to the -log10(p.adjust).
∗Top 15 enriched GO BP terms are showed in the bar plot of each disease state in each tissue. Each row represents a significant GO biological process which is colored according to the -log10(p.adjust).
Page: 1 2 3 4 5 6 7 8 9 

check button Enriched GO biological processes.
GO IDTissueDisease StageDescriptionGene RatioBg Ratiopvaluep.adjustCount
GO:00435888EsophagusESCCskin development163/8552263/187236.48e-081.14e-06163
GO:000150317EsophagusESCCossification232/8552408/187233.00e-063.40e-05232
GO:00073698EsophagusESCCgastrulation115/8552185/187234.35e-064.64e-05115
GO:00074926EsophagusESCCendoderm development54/855277/187231.20e-051.12e-0454
GO:00301984EsophagusESCCextracellular matrix organization171/8552301/187236.08e-054.67e-04171
GO:00432007EsophagusESCCresponse to amino acid74/8552116/187236.23e-054.76e-0474
GO:000110110EsophagusESCCresponse to acid chemical84/8552135/187237.70e-055.74e-0484
GO:00430624EsophagusESCCextracellular structure organization171/8552302/187237.73e-055.76e-04171
GO:00452294EsophagusESCCexternal encapsulating structure organization172/8552304/187237.80e-055.80e-04172
GO:00712305EsophagusESCCcellular response to amino acid stimulus48/855271/187231.55e-041.03e-0348
GO:00017064EsophagusESCCendoderm formation38/855254/187232.08e-041.31e-0338
GO:00017044EsophagusESCCformation of primary germ layer75/8552121/187232.17e-041.36e-0375
GO:00712296EsophagusESCCcellular response to acid chemical52/855280/187233.79e-042.20e-0352
GO:00359873EsophagusESCCendodermal cell differentiation32/855245/187234.87e-042.70e-0332
GO:00301993EsophagusESCCcollagen fibril organization40/855261/187231.35e-036.44e-0340
GO:000110111LiverHCCresponse to acid chemical79/7958135/187231.24e-041.03e-0379
GO:004320011LiverHCCresponse to amino acid68/7958116/187233.31e-042.33e-0368
GO:00712291LiverHCCcellular response to acid chemical45/795880/187239.02e-033.48e-0245
GO:00074921LiverHCCendoderm development43/795877/187231.24e-024.51e-0243
GO:00435887Oral cavityOSCCskin development143/7305263/187232.77e-074.27e-06143
Page: 1 2 3 4 5 

check button Enriched KEGG pathways.
Pathway IDTissueDisease StageDescriptionGene RatioBg Ratiopvaluep.adjustqvalueCount
Page: 1 

Top

Cell-cell communication analysis

check buttonIdentification of potential cell-cell interactions between two cell types and their ligand-receptor pairs for different disease states
LigandReceptorLRpairPathwayTissueDisease Stage
Page: 1 

Top

Single-cell gene regulatory network inference analysis

check buttonFind out the significant the regulons (TFs) and the target genes of each regulon across cell types for different disease states
TFCell TypeTissueDisease StageTarget GeneRSSRegulon Activity
∗The dot plots of a searched regulon are shown for all cell subpopulations in each disease state of each tissue based on the regulon specific score inferred using pySCENIC and by calculating the average expression.
Page: 1 

Top

Somatic mutation of malignant transformation related genes

check buttonAnnotation of somatic variants for genes involved in malignant transformation
Hugo SymbolVariant ClassVariant ClassificationdbSNP RSHGVScHGVSpHGVSp ShortSWISSPROTBIOTYPESIFTPolyPhenTumor Sample BarcodeTissueHistologySexAgeStageTherapy TypesDrugsOutcome
COL5A2SNVMissense_Mutationnovelc.3748N>Cp.Glu1250Glnp.E1250QP05997protein_codingtolerated(0.29)possibly_damaging(0.616)TCGA-A2-A0YK-01Breastbreast invasive carcinomaFemale<65I/IIChemotherapycytoxanSD
COL5A2SNVMissense_Mutationc.2452N>Gp.Pro818Alap.P818AP05997protein_codingtolerated(0.65)benign(0.021)TCGA-A7-A26J-01Breastbreast invasive carcinomaFemale<65I/IIHormone TherapytamoxiphenSD
COL5A2SNVMissense_Mutationrs760569641c.4357N>Tp.Arg1453Trpp.R1453WP05997protein_codingdeleterious(0)probably_damaging(0.924)TCGA-A8-A075-01Breastbreast invasive carcinomaFemale<65I/IIChemotherapyepirubicinCR
COL5A2SNVMissense_Mutationc.3662N>Tp.Gly1221Valp.G1221VP05997protein_codingdeleterious(0)probably_damaging(1)TCGA-AN-A0FL-01Breastbreast invasive carcinomaFemale<65I/IIUnknownUnknownSD
COL5A2SNVMissense_Mutationnovelc.2267G>Cp.Gly756Alap.G756AP05997protein_codingdeleterious(0.02)probably_damaging(0.996)TCGA-AR-A5QQ-01Breastbreast invasive carcinomaFemale>=65III/IVChemotherapycarboplatinPD
COL5A2SNVMissense_Mutationc.721N>Ap.Glu241Lysp.E241KP05997protein_codingdeleterious(0.02)possibly_damaging(0.614)TCGA-BH-A0AW-01Breastbreast invasive carcinomaFemale<65I/IIChemotherapycarboplatinSD
COL5A2SNVMissense_Mutationc.505N>Ap.Gln169Lysp.Q169KP05997protein_codingtolerated(0.88)benign(0.43)TCGA-D8-A1J8-01Breastbreast invasive carcinomaFemale>=65I/IIHormone TherapynolvadexSD
COL5A2SNVMissense_Mutationc.3293N>Cp.Gly1098Alap.G1098AP05997protein_codingdeleterious(0)probably_damaging(0.999)TCGA-D8-A1JA-01Breastbreast invasive carcinomaFemale<65III/IVChemotherapyadriamycinPD
COL5A2SNVMissense_Mutationc.1744N>Cp.Gly582Argp.G582RP05997protein_codingdeleterious(0)probably_damaging(1)TCGA-E2-A158-01Breastbreast invasive carcinomaFemale<65I/IIChemotherapyarimidexSD
COL5A2SNVMissense_Mutationnovelc.1679N>Ap.Pro560Glnp.P560QP05997protein_codingdeleterious(0.02)probably_damaging(0.993)TCGA-E2-A1IE-01Breastbreast invasive carcinomaFemale<65I/IIChemotherapydoxorubicinPD
Page: 1 2 3 4 5 6 7 8 9 10 11 12 13 14 15 16 17 18 19 20 21 22 23 

Top

Related drugs of malignant transformation related genes

check buttonIdentification of chemicals and drugs interact with genes involved in malignant transfromation
(DGIdb 4.0)
Entrez IDSymbolCategoryInteraction TypesDrug Claim NameDrug NamePMIDs
1290COL5A2DRUGGABLE GENOMECHEMBL2095222OCRIPLASMIN
1290COL5A2DRUGGABLE GENOMECHEMBL2108709COLLAGENASE CLOSTRIDIUM HISTOLYTICUM
Page: 1