
|
|||||
|
 | |
| |
| |
| |
| |
| |
|
Gene: COG1 |
Gene summary for COG1 |
| Gene information | Species | Human | Gene symbol | COG1 | Gene ID | 9382 |
| Gene name | component of oligomeric golgi complex 1 | |
| Gene Alias | CDG2G | |
| Cytomap | 17q25.1 | |
| Gene Type | protein-coding | GO ID | GO:0006810 | UniProtAcc | Q8WTW3 |
Top |
Malignant transformation analysis |
| Identification of the aberrant gene expression in precancerous and cancerous lesions by comparing the gene expression of stem-like cells in diseased tissues with normal stem cells |
| Entrez ID | Symbol | Replicates | Species | Organ | Tissue | Adj P-value | Log2FC | Malignancy |
| 9382 | COG1 | P57T-E | Human | Esophagus | ESCC | 2.54e-14 | 1.86e-01 | 0.0926 |
| 9382 | COG1 | P61T-E | Human | Esophagus | ESCC | 2.46e-14 | 2.82e-01 | 0.099 |
| 9382 | COG1 | P62T-E | Human | Esophagus | ESCC | 2.46e-24 | 3.58e-01 | 0.1302 |
| 9382 | COG1 | P65T-E | Human | Esophagus | ESCC | 1.50e-12 | 1.97e-01 | 0.0978 |
| 9382 | COG1 | P74T-E | Human | Esophagus | ESCC | 8.25e-13 | 2.82e-01 | 0.1479 |
| 9382 | COG1 | P75T-E | Human | Esophagus | ESCC | 2.77e-28 | 4.57e-01 | 0.1125 |
| 9382 | COG1 | P76T-E | Human | Esophagus | ESCC | 1.30e-14 | 1.91e-01 | 0.1207 |
| 9382 | COG1 | P79T-E | Human | Esophagus | ESCC | 5.89e-17 | 2.10e-01 | 0.1154 |
| 9382 | COG1 | P80T-E | Human | Esophagus | ESCC | 4.10e-17 | 4.95e-01 | 0.155 |
| 9382 | COG1 | P82T-E | Human | Esophagus | ESCC | 1.51e-11 | 4.14e-01 | 0.1072 |
| 9382 | COG1 | P83T-E | Human | Esophagus | ESCC | 5.38e-15 | 3.28e-01 | 0.1738 |
| 9382 | COG1 | P84T-E | Human | Esophagus | ESCC | 1.67e-05 | 2.28e-01 | 0.0933 |
| 9382 | COG1 | P89T-E | Human | Esophagus | ESCC | 6.19e-09 | 3.53e-01 | 0.1752 |
| 9382 | COG1 | P91T-E | Human | Esophagus | ESCC | 4.77e-11 | 6.77e-01 | 0.1828 |
| 9382 | COG1 | P104T-E | Human | Esophagus | ESCC | 6.28e-04 | 2.42e-01 | 0.0931 |
| 9382 | COG1 | P107T-E | Human | Esophagus | ESCC | 1.53e-11 | 2.17e-01 | 0.171 |
| 9382 | COG1 | P126T-E | Human | Esophagus | ESCC | 4.97e-07 | 4.41e-01 | 0.1125 |
| 9382 | COG1 | P127T-E | Human | Esophagus | ESCC | 7.76e-04 | 7.23e-02 | 0.0826 |
| 9382 | COG1 | P128T-E | Human | Esophagus | ESCC | 1.14e-30 | 8.11e-01 | 0.1241 |
| 9382 | COG1 | P130T-E | Human | Esophagus | ESCC | 1.49e-15 | 2.60e-01 | 0.1676 |
| Page: 1 2 3 4 |
| Tissue | Expression Dynamics | Abbreviation |
| Esophagus |  | ESCC: Esophageal squamous cell carcinoma |
| HGIN: High-grade intraepithelial neoplasias | ||
| LGIN: Low-grade intraepithelial neoplasias | ||
| Liver | 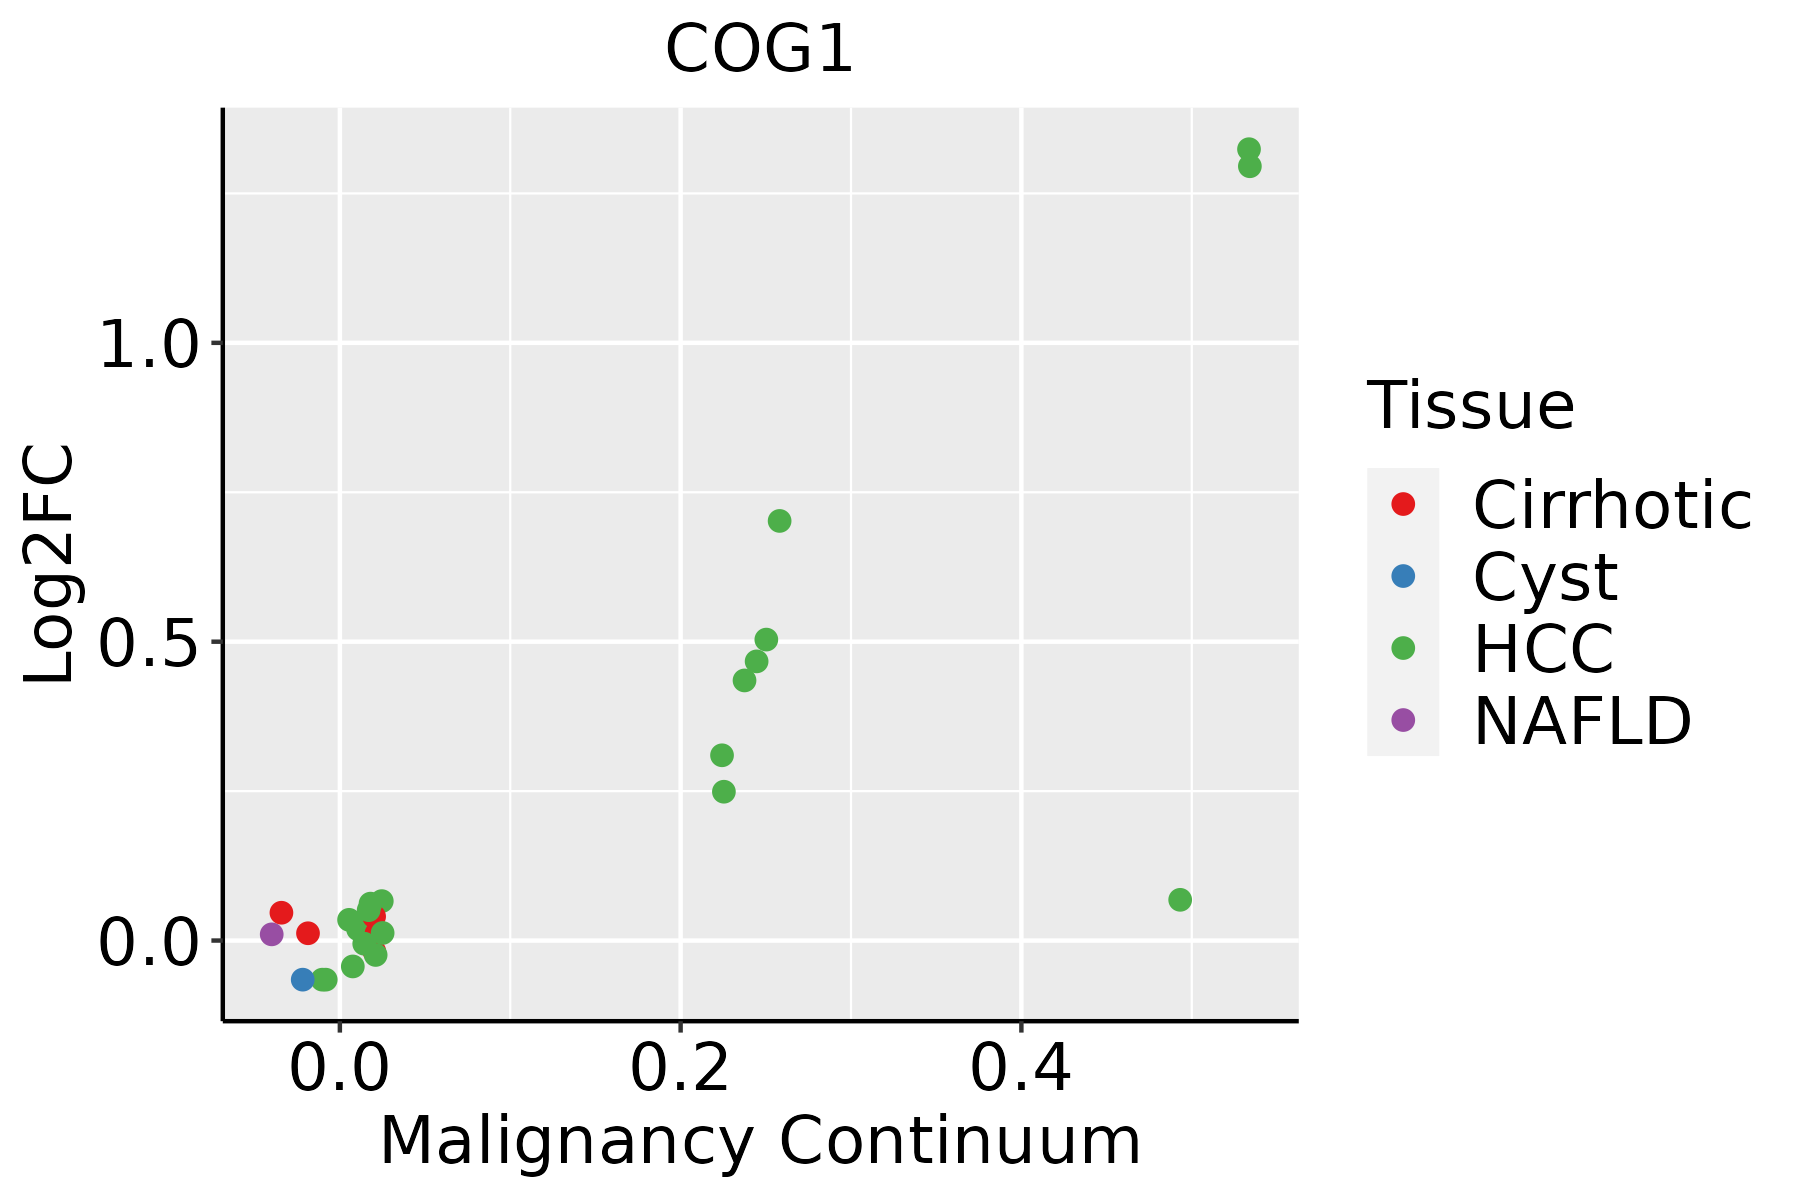 | HCC: Hepatocellular carcinoma |
| NAFLD: Non-alcoholic fatty liver disease |
| ∗log2FC in expression of this searched gene in stem-like cells from each diseased tissue sample relative to stem-like cells in normal samples in each tissue plotted against the malignancy continuum. Samples are colored based on if they are from different disease stage. |
Top |
Malignant transformation related pathway analysis |
| Find out the enriched GO biological processes and KEGG pathways involved in transition from healthy to precancer to cancer |
| Tissue | Disease Stage | Enriched GO biological Processes |
| Colorectum | AD |  |
| Colorectum | SER |  |
| Colorectum | MSS |  |
| Colorectum | MSI-H |  |
| Colorectum | FAP |  |
| ∗Top 15 enriched GO BP terms are showed in the bar plot of each disease state in each tissue. Each row represents a significant GO biological process which is colored according to the -log10(p.adjust). |
| Page: 1 2 3 4 5 6 7 8 9 |
| GO ID | Tissue | Disease Stage | Description | Gene Ratio | Bg Ratio | pvalue | p.adjust | Count |
| GO:004819318 | Esophagus | ESCC | Golgi vesicle transport | 231/8552 | 296/18723 | 1.82e-30 | 9.63e-28 | 231 |
| GO:00070308 | Esophagus | ESCC | Golgi organization | 101/8552 | 157/18723 | 1.78e-06 | 2.10e-05 | 101 |
| GO:00068914 | Esophagus | ESCC | intra-Golgi vesicle-mediated transport | 26/8552 | 33/18723 | 1.06e-04 | 7.43e-04 | 26 |
| GO:004819321 | Liver | HCC | Golgi vesicle transport | 217/7958 | 296/18723 | 2.58e-27 | 1.02e-24 | 217 |
| GO:00070302 | Liver | HCC | Golgi organization | 99/7958 | 157/18723 | 1.54e-07 | 2.85e-06 | 99 |
| GO:0006891 | Liver | HCC | intra-Golgi vesicle-mediated transport | 22/7958 | 33/18723 | 4.38e-03 | 1.90e-02 | 22 |
| Page: 1 |
| Pathway ID | Tissue | Disease Stage | Description | Gene Ratio | Bg Ratio | pvalue | p.adjust | qvalue | Count |
| Page: 1 |
Top |
Cell-cell communication analysis |
| Identification of potential cell-cell interactions between two cell types and their ligand-receptor pairs for different disease states |
| Ligand | Receptor | LRpair | Pathway | Tissue | Disease Stage |
| Page: 1 |
Top |
Single-cell gene regulatory network inference analysis |
| Find out the significant the regulons (TFs) and the target genes of each regulon across cell types for different disease states |
| TF | Cell Type | Tissue | Disease Stage | Target Gene | RSS | Regulon Activity |
| ∗The dot plots of a searched regulon are shown for all cell subpopulations in each disease state of each tissue based on the regulon specific score inferred using pySCENIC and by calculating the average expression. |
| Page: 1 |
Top |
Somatic mutation of malignant transformation related genes |
| Annotation of somatic variants for genes involved in malignant transformation |
| Hugo Symbol | Variant Class | Variant Classification | dbSNP RS | HGVSc | HGVSp | HGVSp Short | SWISSPROT | BIOTYPE | SIFT | PolyPhen | Tumor Sample Barcode | Tissue | Histology | Sex | Age | Stage | Therapy Types | Drugs | Outcome |
| COG1 | SNV | Missense_Mutation | c.2110N>A | p.Asp704Asn | p.D704N | Q8WTW3 | protein_coding | tolerated(0.09) | benign(0.007) | TCGA-A7-A0CD-01 | Breast | breast invasive carcinoma | Female | >=65 | I/II | Hormone Therapy | arimidex | SD | |
| COG1 | SNV | Missense_Mutation | novel | c.488N>A | p.Ser163Asn | p.S163N | Q8WTW3 | protein_coding | tolerated(0.3) | benign(0.003) | TCGA-A7-A6VY-01 | Breast | breast invasive carcinoma | Female | <65 | I/II | Chemotherapy | cyclophosphamide | CR |
| COG1 | SNV | Missense_Mutation | c.2446C>A | p.Leu816Ile | p.L816I | Q8WTW3 | protein_coding | tolerated(0.18) | benign(0.245) | TCGA-A8-A08F-01 | Breast | breast invasive carcinoma | Female | <65 | III/IV | Chemotherapy | 5-fluorouracil | CR | |
| COG1 | SNV | Missense_Mutation | novel | c.1949N>T | p.Arg650Ile | p.R650I | Q8WTW3 | protein_coding | deleterious(0) | benign(0.193) | TCGA-AN-A046-01 | Breast | breast invasive carcinoma | Female | >=65 | I/II | Unknown | Unknown | SD |
| COG1 | SNV | Missense_Mutation | novel | c.1525N>C | p.Ala509Pro | p.A509P | Q8WTW3 | protein_coding | deleterious(0.03) | possibly_damaging(0.669) | TCGA-BH-A0B6-01 | Breast | breast invasive carcinoma | Female | <65 | I/II | Unknown | Unknown | SD |
| COG1 | SNV | Missense_Mutation | c.997N>T | p.Pro333Ser | p.P333S | Q8WTW3 | protein_coding | deleterious(0) | probably_damaging(0.993) | TCGA-BH-A18G-01 | Breast | breast invasive carcinoma | Female | >=65 | I/II | Unknown | Unknown | SD | |
| COG1 | SNV | Missense_Mutation | rs766953526 | c.1718N>G | p.Gln573Arg | p.Q573R | Q8WTW3 | protein_coding | tolerated(0.32) | benign(0) | TCGA-BH-A18G-01 | Breast | breast invasive carcinoma | Female | >=65 | I/II | Unknown | Unknown | SD |
| COG1 | SNV | Missense_Mutation | c.574N>G | p.His192Asp | p.H192D | Q8WTW3 | protein_coding | deleterious(0.03) | benign(0.048) | TCGA-C8-A1HK-01 | Breast | breast invasive carcinoma | Female | <65 | I/II | Unknown | Unknown | SD | |
| COG1 | SNV | Missense_Mutation | novel | c.2837A>G | p.Asp946Gly | p.D946G | Q8WTW3 | protein_coding | deleterious(0.01) | benign(0.34) | TCGA-D8-A1XK-01 | Breast | breast invasive carcinoma | Female | <65 | I/II | Chemotherapy | doxorubicine+cyclophosphamide | SD |
| COG1 | SNV | Missense_Mutation | novel | c.2057N>A | p.Ser686Asn | p.S686N | Q8WTW3 | protein_coding | deleterious(0) | possibly_damaging(0.632) | TCGA-XX-A899-01 | Breast | breast invasive carcinoma | Female | <65 | III/IV | Chemotherapy | cytoxan | CR |
| Page: 1 2 3 4 5 6 7 8 |
Top |
Related drugs of malignant transformation related genes |
| Identification of chemicals and drugs interact with genes involved in malignant transfromation |
| (DGIdb 4.0) |
| Entrez ID | Symbol | Category | Interaction Types | Drug Claim Name | Drug Name | PMIDs |
| Page: 1 |

Copyright 2023-Present -The University of Texas Health Science Center at Houston |