| Tissue | Expression Dynamics | Abbreviation |
| Esophagus | 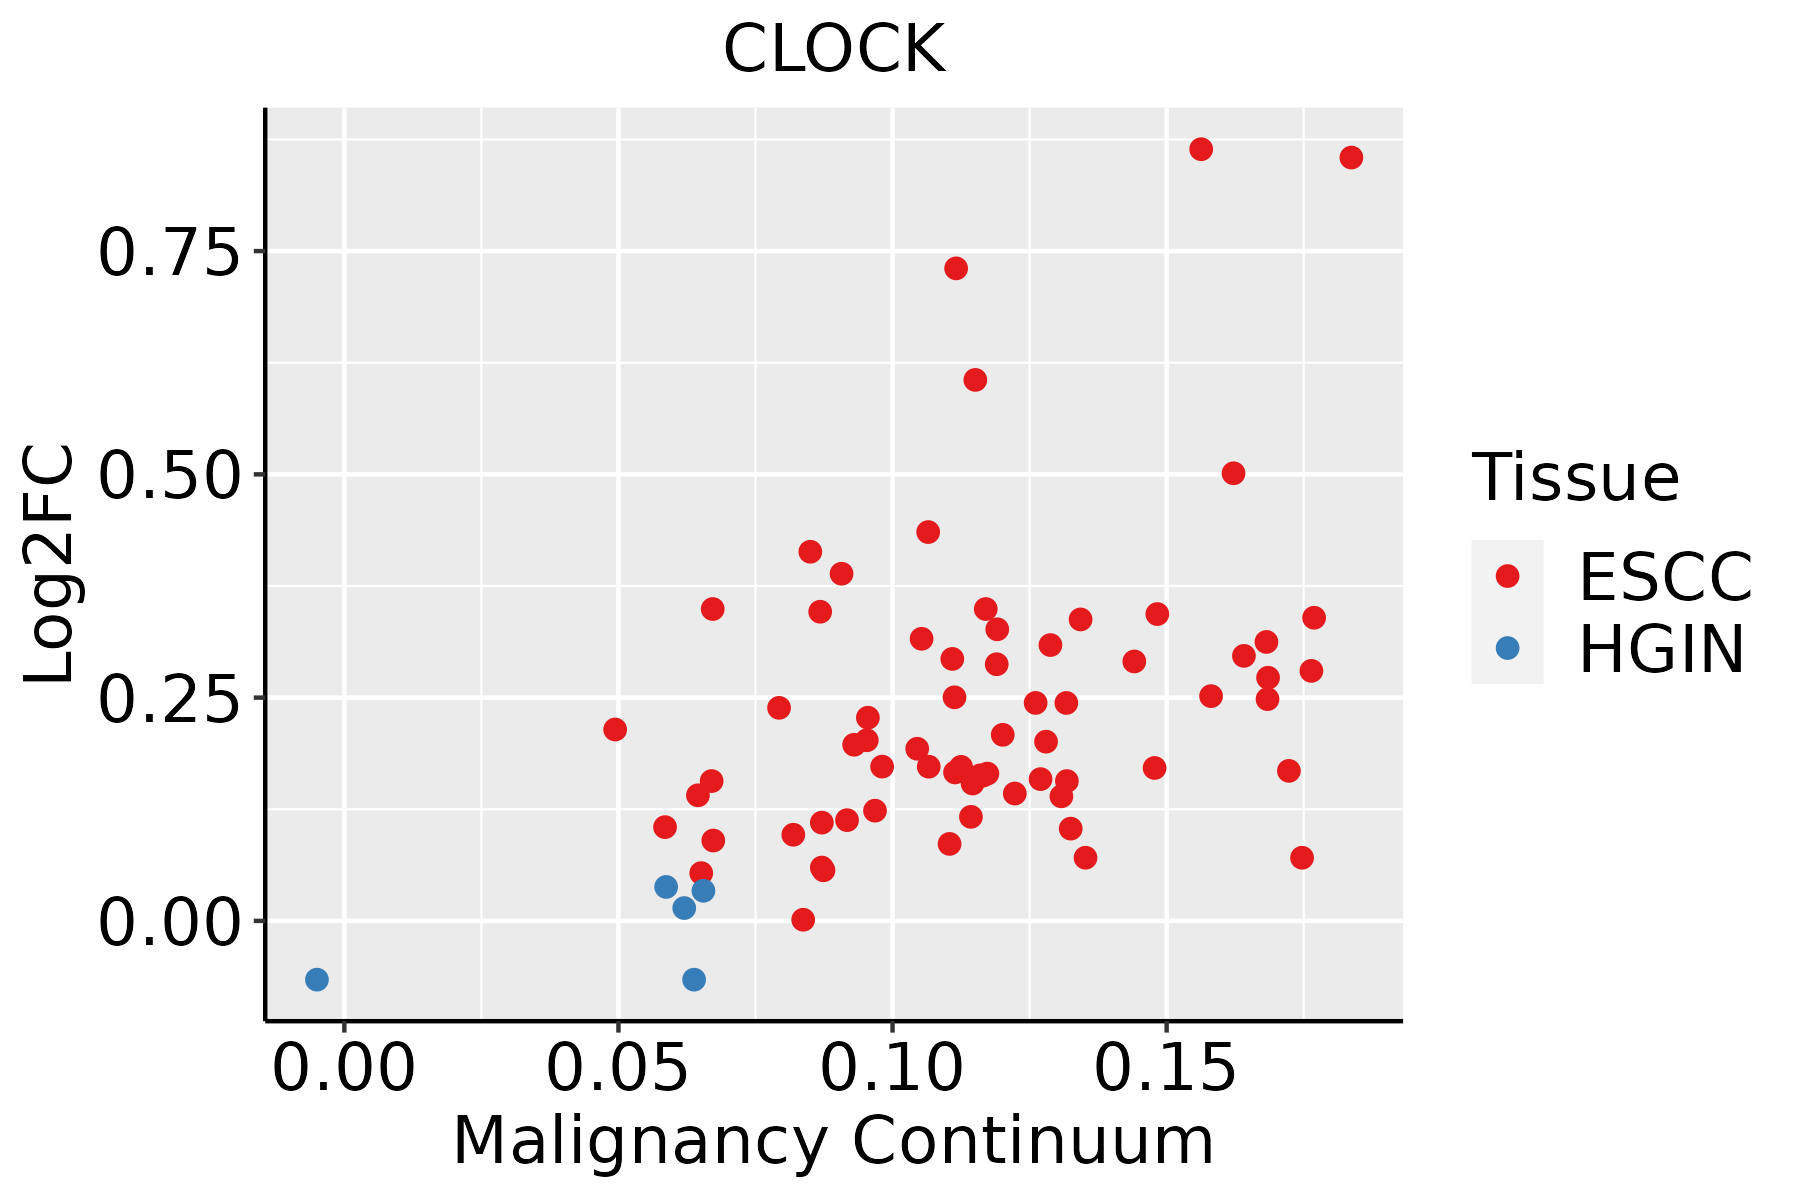 | ESCC: Esophageal squamous cell carcinoma |
| HGIN: High-grade intraepithelial neoplasias |
| LGIN: Low-grade intraepithelial neoplasias |
| Liver | 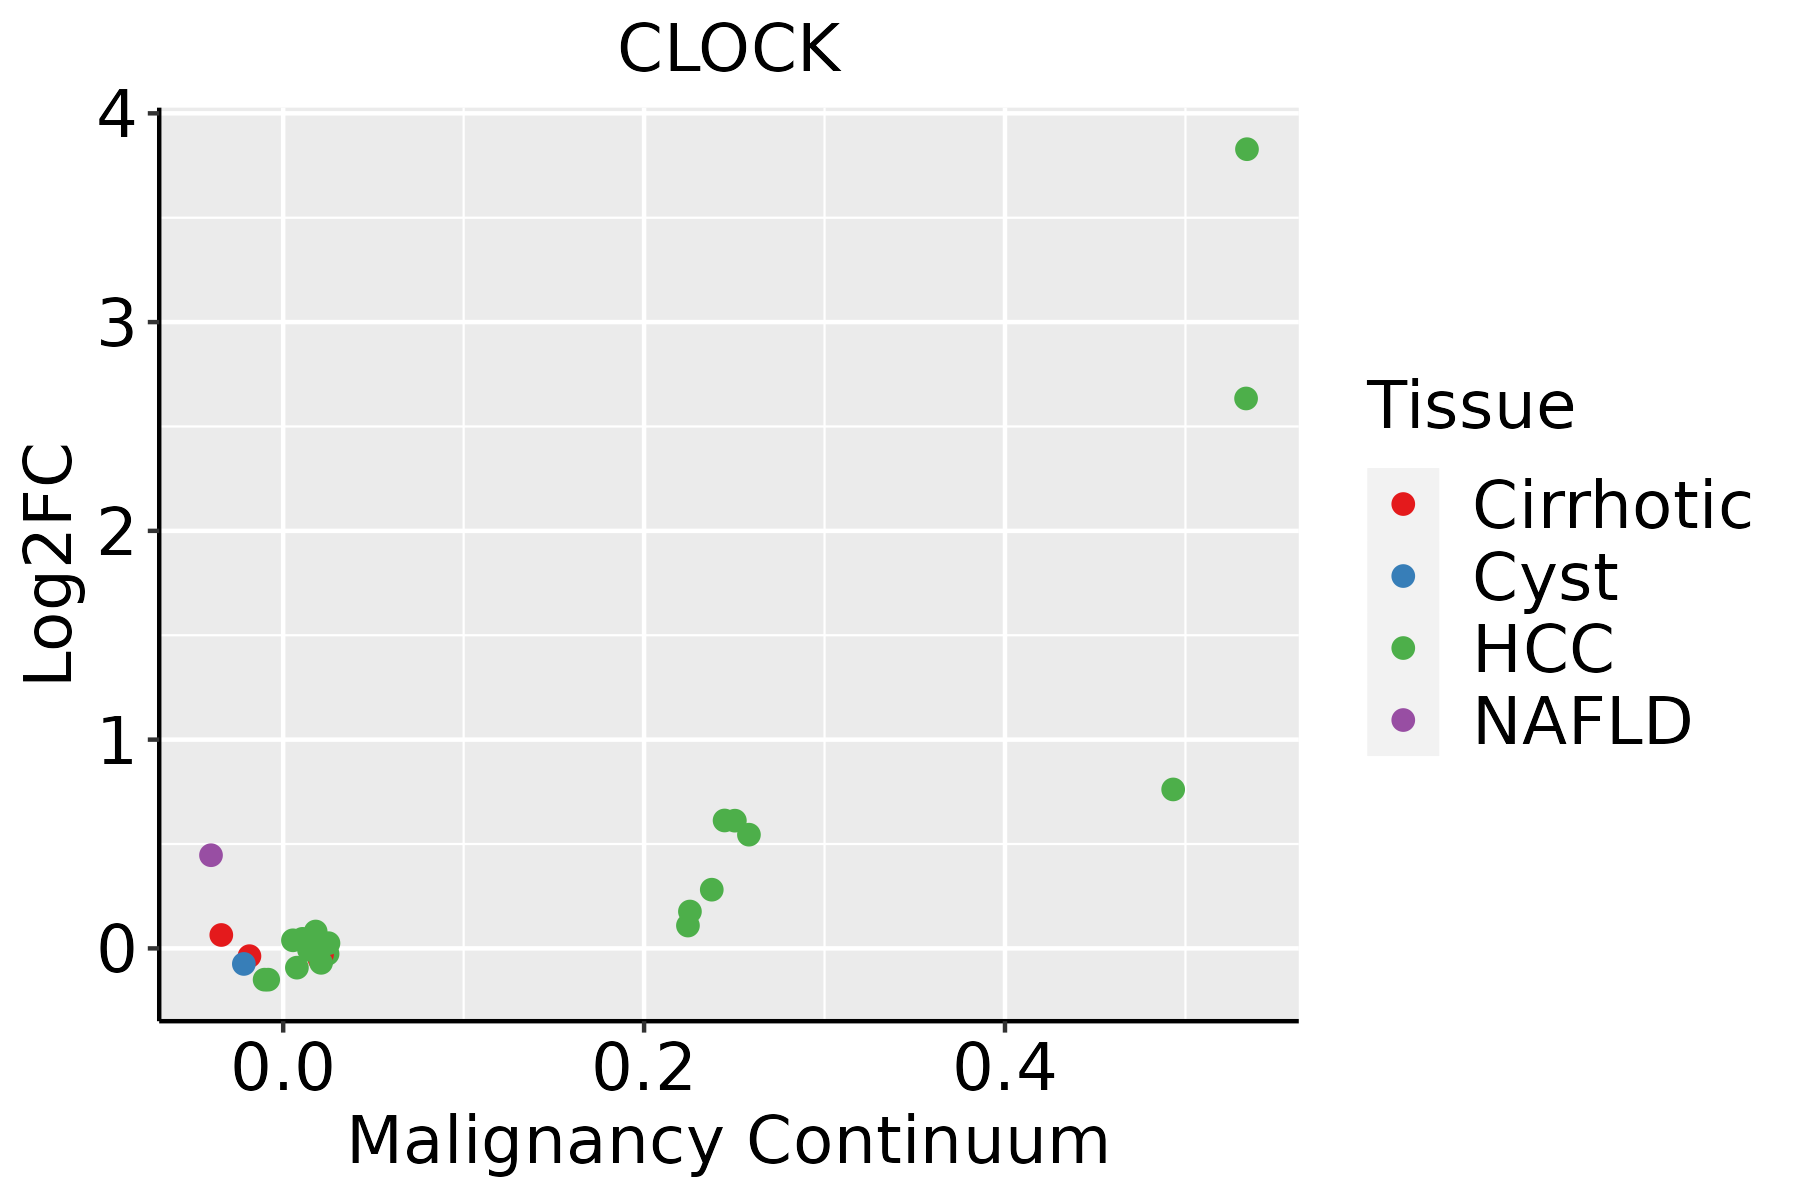 | HCC: Hepatocellular carcinoma |
| NAFLD: Non-alcoholic fatty liver disease |
| Lung |  | AAH: Atypical adenomatous hyperplasia |
| AIS: Adenocarcinoma in situ |
| IAC: Invasive lung adenocarcinoma |
| MIA: Minimally invasive adenocarcinoma |
| Skin | 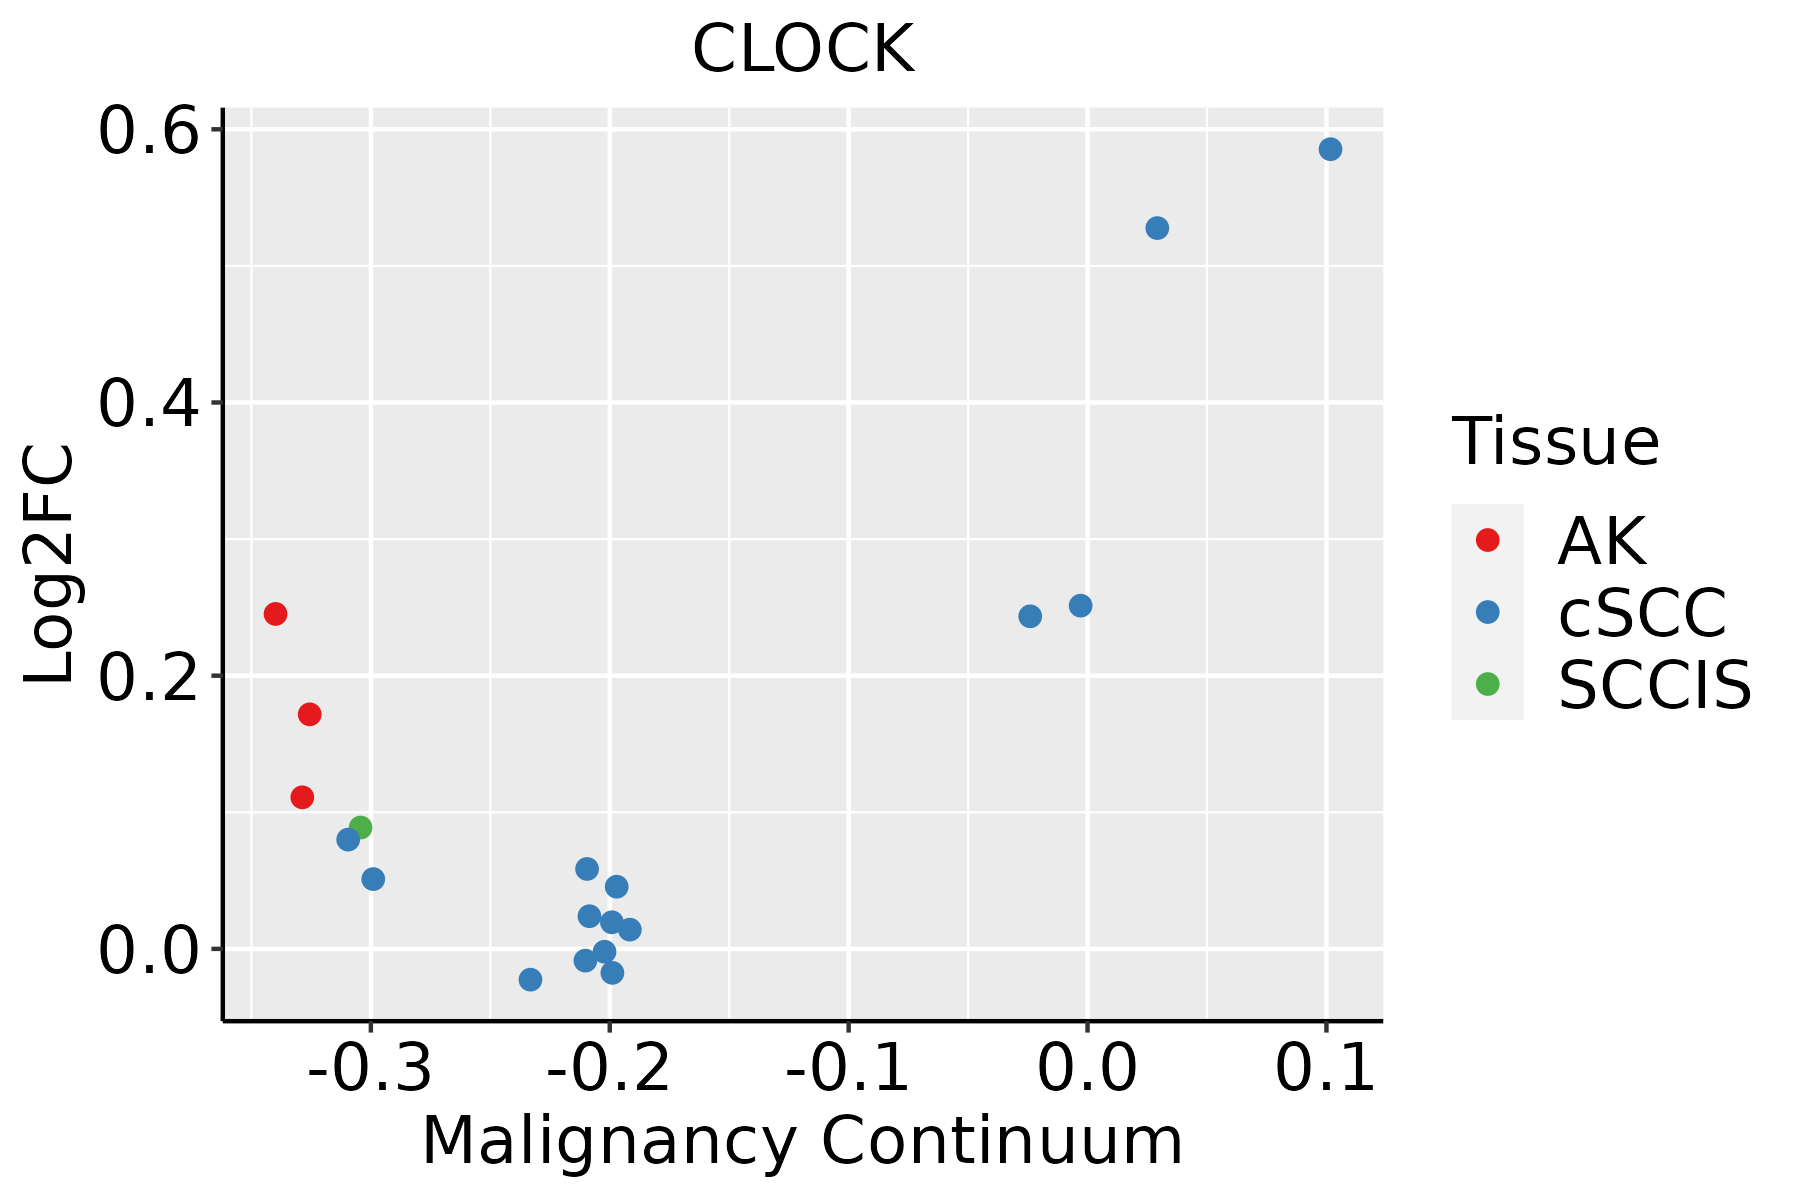 | AK: Actinic keratosis |
| cSCC: Cutaneous squamous cell carcinoma |
| SCCIS:squamous cell carcinoma in situ |
| Thyroid |  | ATC: Anaplastic thyroid cancer |
| HT: Hashimoto's thyroiditis |
| PTC: Papillary thyroid cancer |
| GO ID | Tissue | Disease Stage | Description | Gene Ratio | Bg Ratio | pvalue | p.adjust | Count |
| GO:0010498111 | Esophagus | ESCC | proteasomal protein catabolic process | 369/8552 | 490/18723 | 1.13e-41 | 1.80e-38 | 369 |
| GO:0043161111 | Esophagus | ESCC | proteasome-mediated ubiquitin-dependent protein catabolic process | 312/8552 | 412/18723 | 3.53e-36 | 4.48e-33 | 312 |
| GO:001657015 | Esophagus | ESCC | histone modification | 323/8552 | 463/18723 | 2.61e-26 | 7.88e-24 | 323 |
| GO:001820514 | Esophagus | ESCC | peptidyl-lysine modification | 259/8552 | 376/18723 | 3.90e-20 | 5.26e-18 | 259 |
| GO:001839413 | Esophagus | ESCC | peptidyl-lysine acetylation | 123/8552 | 169/18723 | 6.58e-13 | 2.94e-11 | 123 |
| GO:001021217 | Esophagus | ESCC | response to ionizing radiation | 110/8552 | 148/18723 | 1.11e-12 | 4.78e-11 | 110 |
| GO:004354313 | Esophagus | ESCC | protein acylation | 165/8552 | 243/18723 | 1.69e-12 | 7.14e-11 | 165 |
| GO:000647313 | Esophagus | ESCC | protein acetylation | 140/8552 | 201/18723 | 4.37e-12 | 1.69e-10 | 140 |
| GO:001839313 | Esophagus | ESCC | internal peptidyl-lysine acetylation | 114/8552 | 158/18723 | 1.16e-11 | 4.24e-10 | 114 |
| GO:000647513 | Esophagus | ESCC | internal protein amino acid acetylation | 115/8552 | 160/18723 | 1.43e-11 | 5.08e-10 | 115 |
| GO:00165735 | Esophagus | ESCC | histone acetylation | 110/8552 | 152/18723 | 1.95e-11 | 6.81e-10 | 110 |
| GO:190198713 | Esophagus | ESCC | regulation of cell cycle phase transition | 242/8552 | 390/18723 | 3.86e-11 | 1.26e-09 | 242 |
| GO:000931419 | Esophagus | ESCC | response to radiation | 277/8552 | 456/18723 | 4.42e-11 | 1.43e-09 | 277 |
| GO:00457865 | Esophagus | ESCC | negative regulation of cell cycle | 236/8552 | 385/18723 | 3.62e-10 | 9.93e-09 | 236 |
| GO:00000754 | Esophagus | ESCC | cell cycle checkpoint | 117/8552 | 169/18723 | 4.47e-10 | 1.17e-08 | 117 |
| GO:007121419 | Esophagus | ESCC | cellular response to abiotic stimulus | 206/8552 | 331/18723 | 7.52e-10 | 1.88e-08 | 206 |
| GO:010400419 | Esophagus | ESCC | cellular response to environmental stimulus | 206/8552 | 331/18723 | 7.52e-10 | 1.88e-08 | 206 |
| GO:0030522110 | Esophagus | ESCC | intracellular receptor signaling pathway | 170/8552 | 265/18723 | 8.58e-10 | 2.09e-08 | 170 |
| GO:004277014 | Esophagus | ESCC | signal transduction in response to DNA damage | 117/8552 | 172/18723 | 2.38e-09 | 5.32e-08 | 117 |
| GO:007147816 | Esophagus | ESCC | cellular response to radiation | 122/8552 | 186/18723 | 3.07e-08 | 5.73e-07 | 122 |
| TF | Cell Type | Tissue | Disease Stage | Target Gene | RSS | Regulon Activity |
| CLOCK | CD8TEX | Breast | DCIS | DHX30,BCAS3,MTMR4, etc. | 3.82e-02 |  |
| CLOCK | CD4TN | Breast | Healthy | DHX30,BCAS3,MTMR4, etc. | 2.09e-02 |  |
| CLOCK | CD8TEX | Breast | IDC | DHX30,BCAS3,MTMR4, etc. | 3.95e-02 |  |
| CLOCK | KER | Esophagus | ADJ | KRT13,KRT5,TMEM165, etc. | 2.21e-01 |  |
| CLOCK | CD8TEXP | Esophagus | ADJ | SMIM10L2B,CDC42SE2,CLEC7A, etc. | 4.89e-02 | |
| CLOCK | CD8TEXP | Esophagus | ESCC | SMIM10L2B,CDC42SE2,CLEC7A, etc. | 7.66e-02 |  |
| CLOCK | INMON | Esophagus | ESCC | SMIM10L2B,CDC42SE2,CLEC7A, etc. | 8.35e-02 | |
| CLOCK | AT2L | Lung | MIAC | TMEM165,SYT8,SPTSSA, etc. | 6.38e-01 |  |
| CLOCK | CD8TEXINT | Lung | AAH | TICAM2,HSPA1B,ZHX3, etc. | 3.56e-01 |  |
| CLOCK | ECM | Oral cavity | EOLP | GLIS2,LUZP2,AL078604.4, etc. | 0.00e+00 |  |
| Hugo Symbol | Variant Class | Variant Classification | dbSNP RS | HGVSc | HGVSp | HGVSp Short | SWISSPROT | BIOTYPE | SIFT | PolyPhen | Tumor Sample Barcode | Tissue | Histology | Sex | Age | Stage | Therapy Types | Drugs | Outcome |
| CLOCK | SNV | Missense_Mutation | | c.496N>A | p.Val166Ile | p.V166I | O15516 | protein_coding | tolerated(0.13) | benign(0.042) | TCGA-AN-A0AK-01 | Breast | breast invasive carcinoma | Female | >=65 | I/II | Unknown | Unknown | SD |
| CLOCK | SNV | Missense_Mutation | | c.49N>T | p.Asp17Tyr | p.D17Y | O15516 | protein_coding | deleterious(0) | possibly_damaging(0.526) | TCGA-AR-A256-01 | Breast | breast invasive carcinoma | Female | <65 | I/II | Chemotherapy | doxorubicin | PD |
| CLOCK | SNV | Missense_Mutation | | c.35N>T | p.Ser12Leu | p.S12L | O15516 | protein_coding | deleterious(0.03) | benign(0.001) | TCGA-EW-A1IZ-01 | Breast | breast invasive carcinoma | Female | <65 | III/IV | Chemotherapy | taxotere | SD |
| CLOCK | insertion | Nonsense_Mutation | novel | c.1840_1841insTAATTT | p.Gly614delinsValIleTer | p.G614delinsVI* | O15516 | protein_coding | | | TCGA-B6-A0IB-01 | Breast | breast invasive carcinoma | Female | <65 | III/IV | Unknown | Unknown | PD |
| CLOCK | insertion | Frame_Shift_Ins | novel | c.1839_1840insCACGTTCCCACCAGCAGTGT | p.Gly614HisfsTer16 | p.G614Hfs*16 | O15516 | protein_coding | | | TCGA-B6-A0IB-01 | Breast | breast invasive carcinoma | Female | <65 | III/IV | Unknown | Unknown | PD |
| CLOCK | SNV | Missense_Mutation | novel | c.677N>G | p.Ser226Cys | p.S226C | O15516 | protein_coding | deleterious(0) | possibly_damaging(0.447) | TCGA-C5-A907-01 | Cervix | cervical & endocervical cancer | Female | <65 | I/II | Chemotherapy | cisplatin | SD |
| CLOCK | SNV | Missense_Mutation | novel | c.142N>A | p.Asp48Asn | p.D48N | O15516 | protein_coding | deleterious(0) | probably_damaging(0.999) | TCGA-ZJ-AAX8-01 | Cervix | cervical & endocervical cancer | Female | <65 | III/IV | Unknown | Unknown | SD |
| CLOCK | SNV | Missense_Mutation | novel | c.1174N>A | p.Glu392Lys | p.E392K | O15516 | protein_coding | deleterious(0.04) | benign(0.043) | TCGA-ZJ-AAXU-01 | Cervix | cervical & endocervical cancer | Female | <65 | I/II | Unknown | Unknown | SD |
| CLOCK | SNV | Missense_Mutation | | c.2355N>G | p.Phe785Leu | p.F785L | O15516 | protein_coding | tolerated(0.08) | benign(0.007) | TCGA-AA-3977-01 | Colorectum | colon adenocarcinoma | Male | >=65 | I/II | Unknown | Unknown | SD |
| CLOCK | SNV | Missense_Mutation | rs779397098 | c.1460N>T | p.Ser487Phe | p.S487F | O15516 | protein_coding | deleterious(0.01) | possibly_damaging(0.887) | TCGA-AA-A00N-01 | Colorectum | colon adenocarcinoma | Male | >=65 | I/II | Unknown | Unknown | PD |


