
|
|||||
|
 | |
| |
| |
| |
| |
| |
|
Gene: CLN8 |
Gene summary for CLN8 |
| Gene information | Species | Human | Gene symbol | CLN8 | Gene ID | 2055 |
| Gene name | CLN8 transmembrane ER and ERGIC protein | |
| Gene Alias | C8orf61 | |
| Cytomap | 8p23.3 | |
| Gene Type | protein-coding | GO ID | GO:0001306 | UniProtAcc | A0A024QZ57 |
Top |
Malignant transformation analysis |
| Identification of the aberrant gene expression in precancerous and cancerous lesions by comparing the gene expression of stem-like cells in diseased tissues with normal stem cells |
| Entrez ID | Symbol | Replicates | Species | Organ | Tissue | Adj P-value | Log2FC | Malignancy |
| 2055 | CLN8 | P12T-E | Human | Esophagus | ESCC | 7.48e-13 | 6.46e-02 | 0.1122 |
| 2055 | CLN8 | P15T-E | Human | Esophagus | ESCC | 3.44e-07 | 1.71e-02 | 0.1149 |
| 2055 | CLN8 | P16T-E | Human | Esophagus | ESCC | 4.03e-22 | 1.95e-01 | 0.1153 |
| 2055 | CLN8 | P20T-E | Human | Esophagus | ESCC | 9.38e-17 | 2.05e-01 | 0.1124 |
| 2055 | CLN8 | P21T-E | Human | Esophagus | ESCC | 7.28e-20 | 1.98e-01 | 0.1617 |
| 2055 | CLN8 | P22T-E | Human | Esophagus | ESCC | 4.76e-07 | 6.92e-03 | 0.1236 |
| 2055 | CLN8 | P23T-E | Human | Esophagus | ESCC | 1.34e-02 | 2.51e-02 | 0.108 |
| 2055 | CLN8 | P24T-E | Human | Esophagus | ESCC | 5.76e-19 | 5.50e-02 | 0.1287 |
| 2055 | CLN8 | P26T-E | Human | Esophagus | ESCC | 4.94e-07 | 2.78e-03 | 0.1276 |
| 2055 | CLN8 | P27T-E | Human | Esophagus | ESCC | 4.01e-19 | 3.02e-01 | 0.1055 |
| 2055 | CLN8 | P28T-E | Human | Esophagus | ESCC | 1.75e-19 | 4.80e-01 | 0.1149 |
| 2055 | CLN8 | P30T-E | Human | Esophagus | ESCC | 1.94e-18 | 9.30e-01 | 0.137 |
| 2055 | CLN8 | P31T-E | Human | Esophagus | ESCC | 3.37e-13 | 3.51e-02 | 0.1251 |
| 2055 | CLN8 | P32T-E | Human | Esophagus | ESCC | 1.95e-21 | 2.30e-01 | 0.1666 |
| 2055 | CLN8 | P36T-E | Human | Esophagus | ESCC | 8.68e-11 | 3.76e-01 | 0.1187 |
| 2055 | CLN8 | P37T-E | Human | Esophagus | ESCC | 5.15e-09 | 4.51e-03 | 0.1371 |
| 2055 | CLN8 | P39T-E | Human | Esophagus | ESCC | 8.80e-09 | 1.42e-02 | 0.0894 |
| 2055 | CLN8 | P42T-E | Human | Esophagus | ESCC | 4.08e-06 | 1.53e-01 | 0.1175 |
| 2055 | CLN8 | P44T-E | Human | Esophagus | ESCC | 4.40e-06 | 6.97e-03 | 0.1096 |
| 2055 | CLN8 | P47T-E | Human | Esophagus | ESCC | 1.19e-09 | 1.06e-01 | 0.1067 |
| Page: 1 2 3 4 5 6 |
| Tissue | Expression Dynamics | Abbreviation |
| Colorectum (GSE201348) | 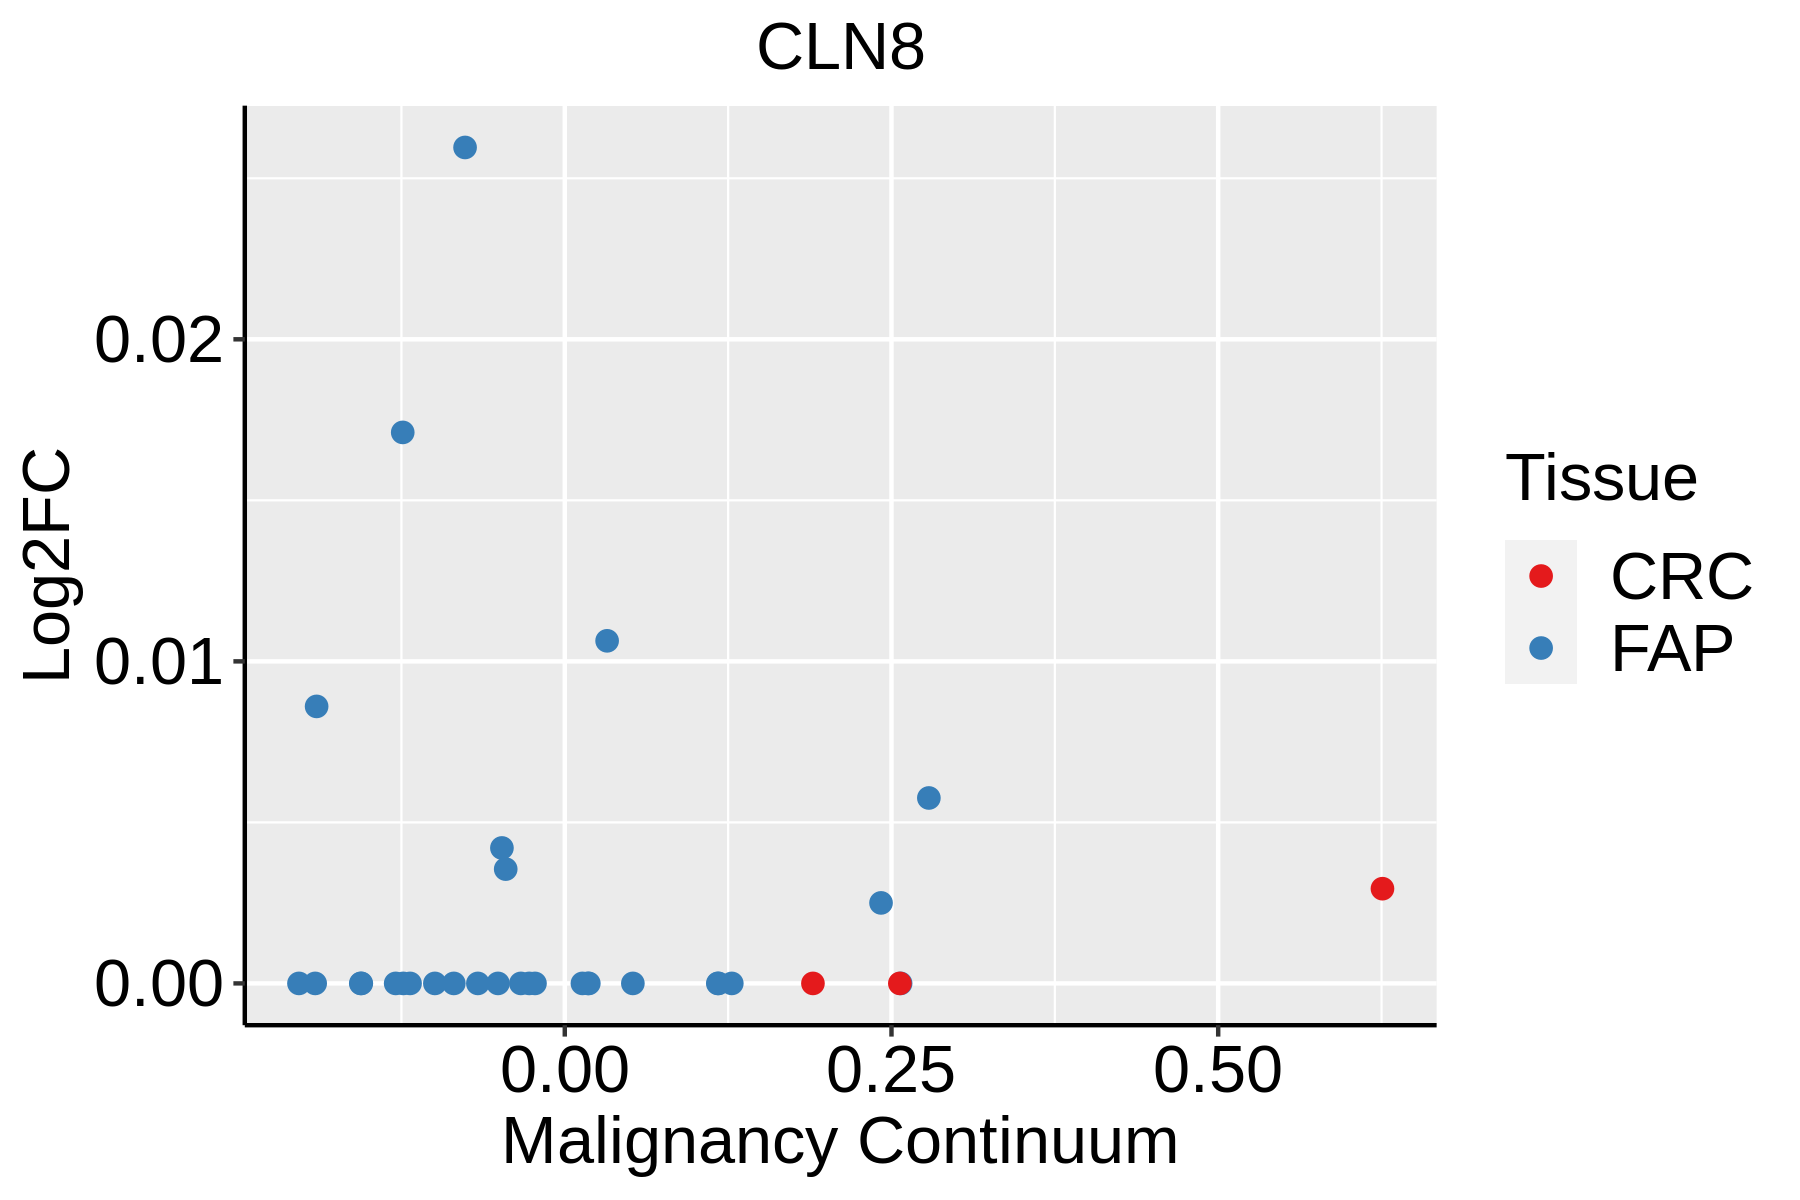 | FAP: Familial adenomatous polyposis |
| CRC: Colorectal cancer | ||
| Colorectum (HTA11) |  | AD: Adenomas |
| SER: Sessile serrated lesions | ||
| MSI-H: Microsatellite-high colorectal cancer | ||
| MSS: Microsatellite stable colorectal cancer | ||
| Esophagus |  | ESCC: Esophageal squamous cell carcinoma |
| HGIN: High-grade intraepithelial neoplasias | ||
| LGIN: Low-grade intraepithelial neoplasias | ||
| Liver | 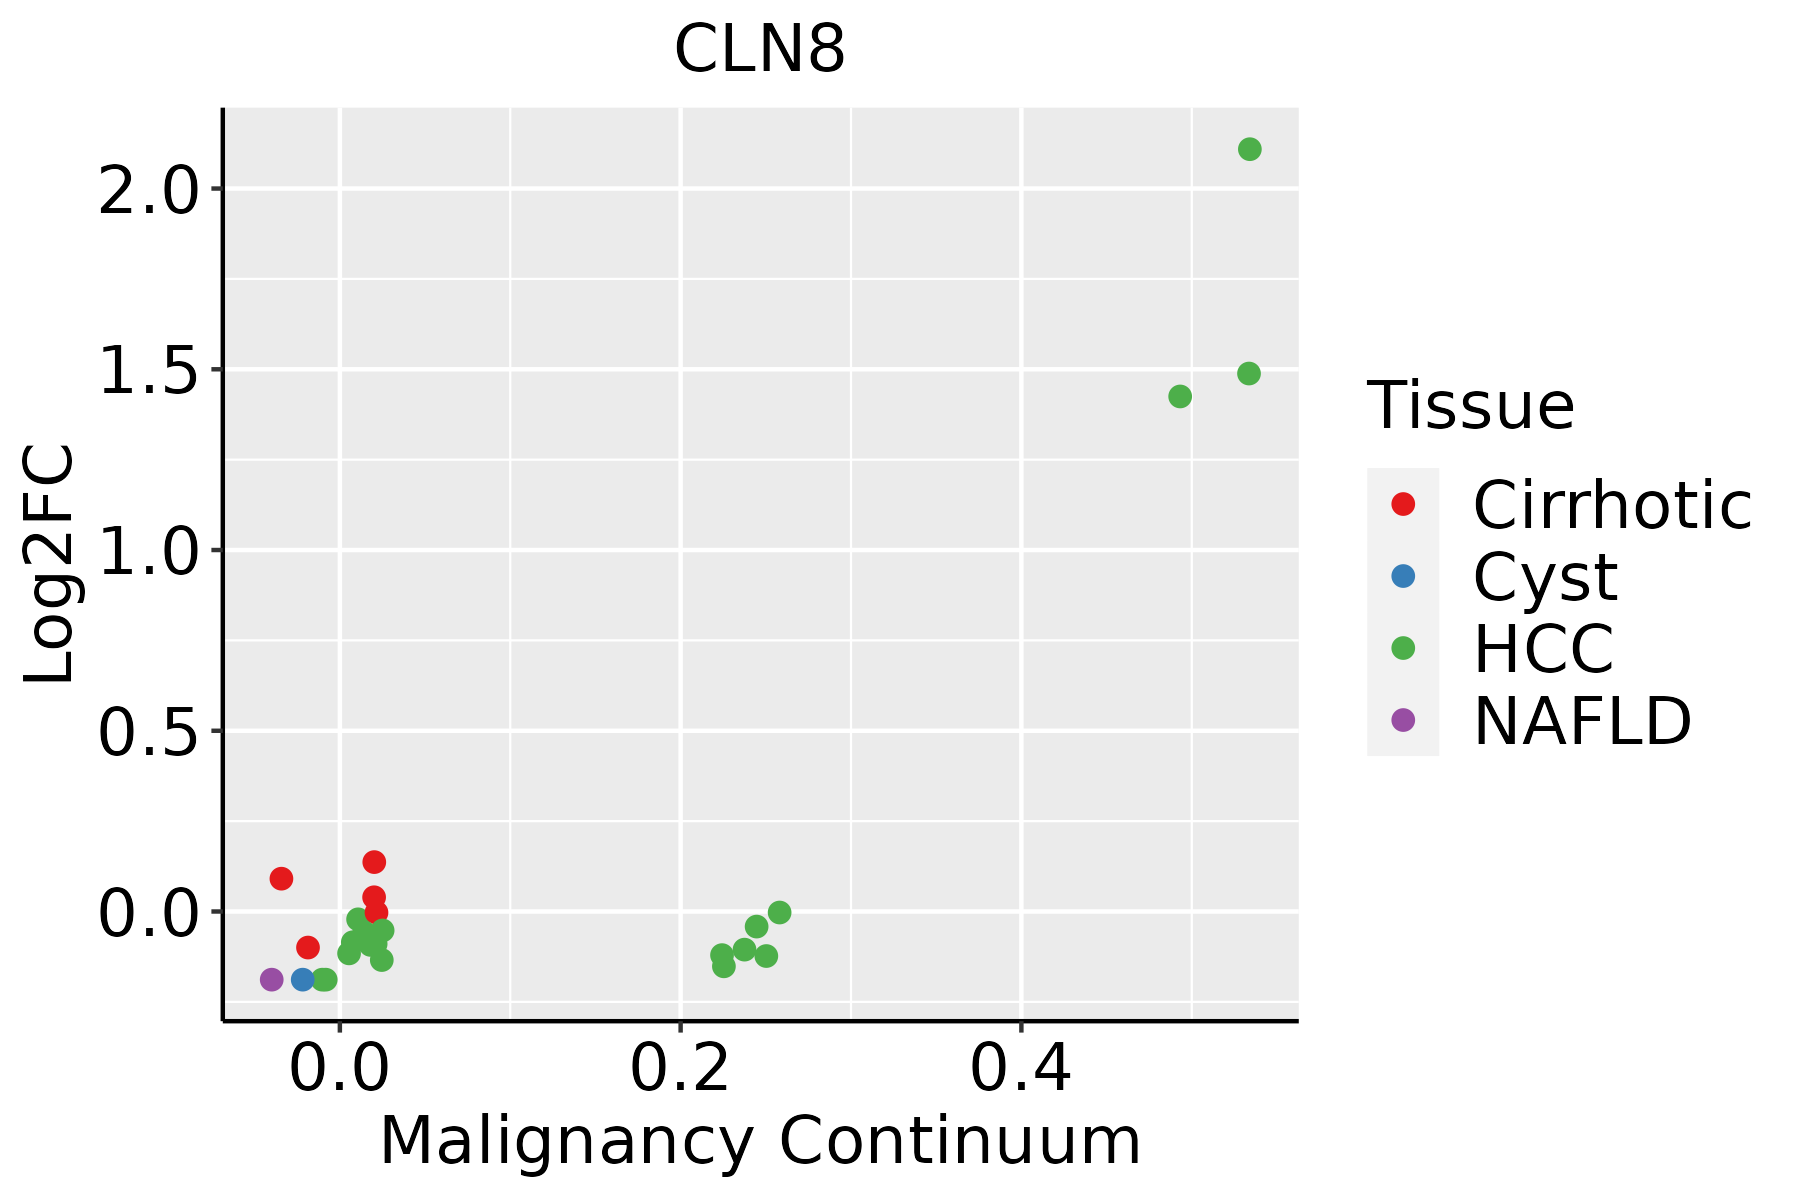 | HCC: Hepatocellular carcinoma |
| NAFLD: Non-alcoholic fatty liver disease | ||
| Oral Cavity | 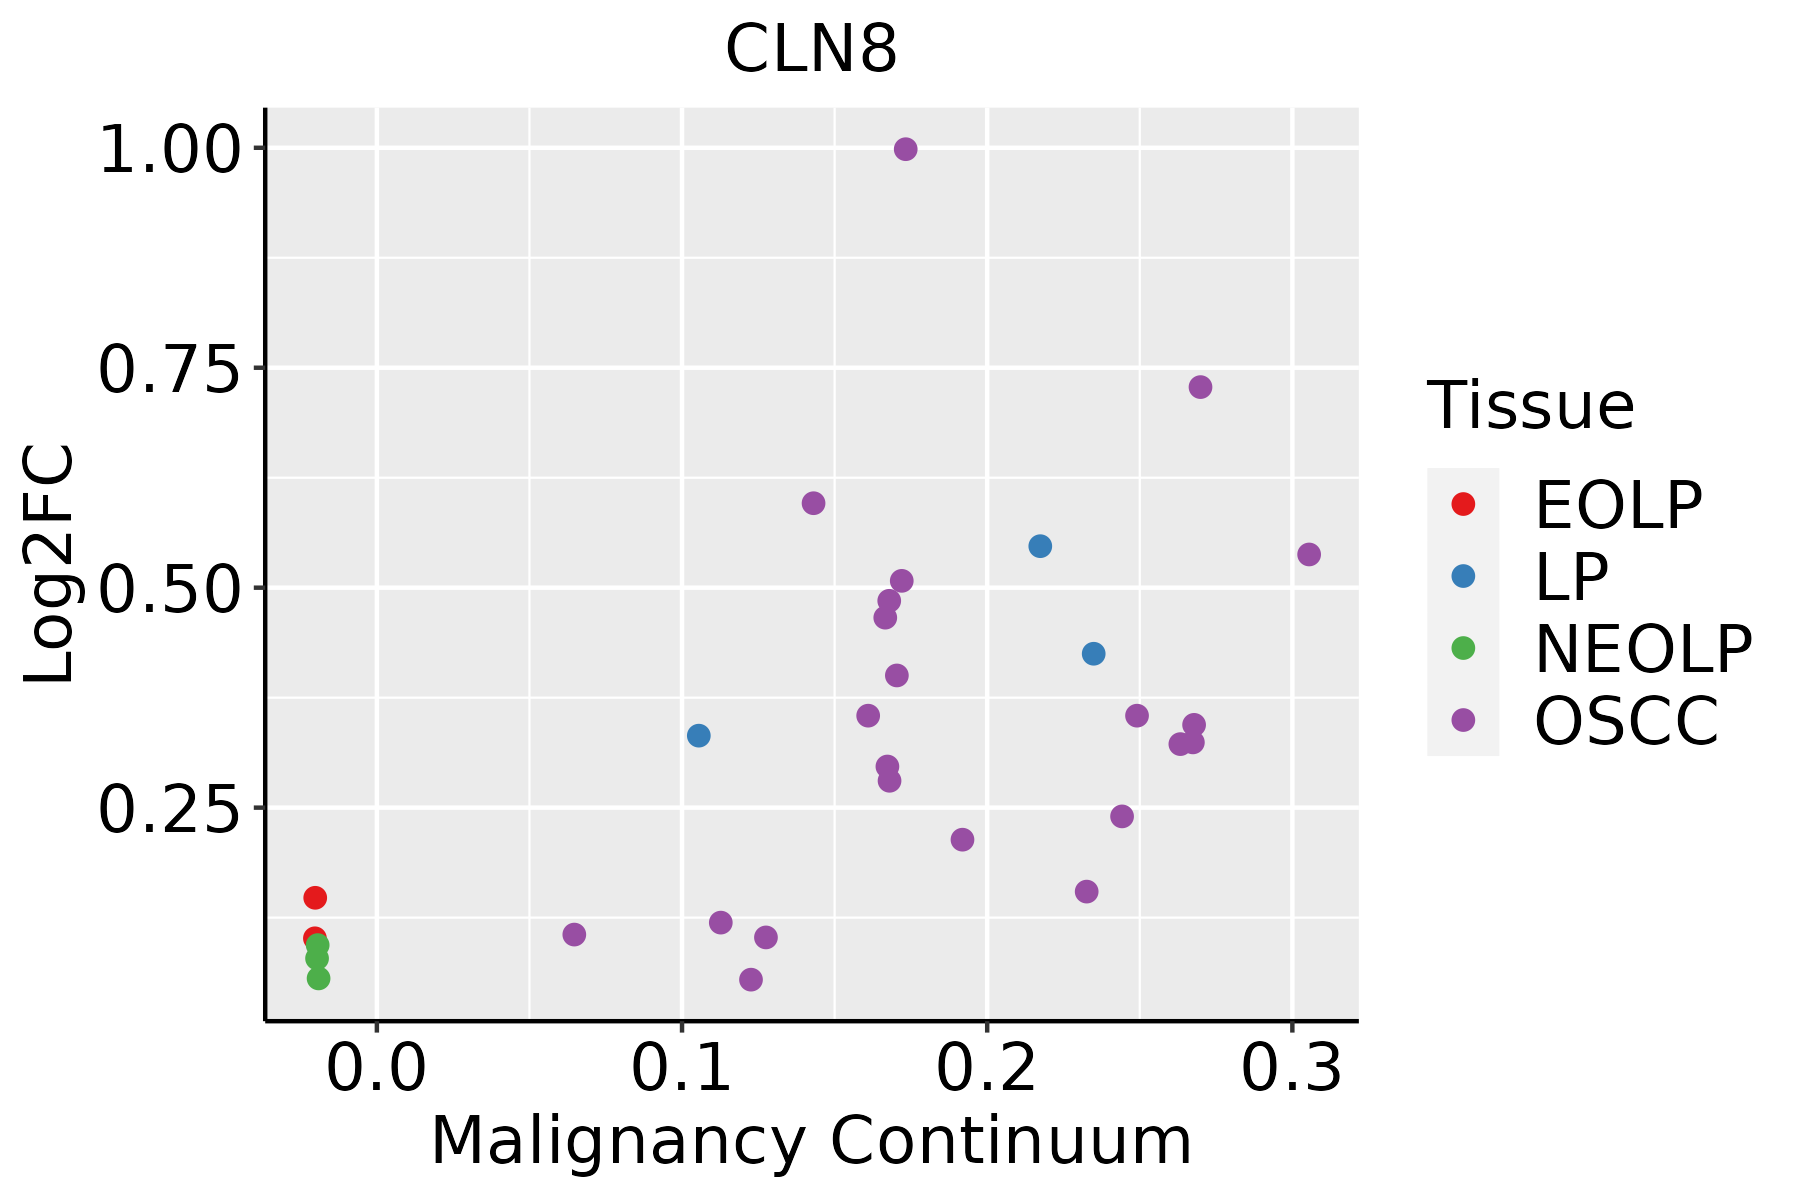 | EOLP: Erosive Oral lichen planus |
| LP: leukoplakia | ||
| NEOLP: Non-erosive oral lichen planus | ||
| OSCC: Oral squamous cell carcinoma |
| ∗log2FC in expression of this searched gene in stem-like cells from each diseased tissue sample relative to stem-like cells in normal samples in each tissue plotted against the malignancy continuum. Samples are colored based on if they are from different disease stage. |
Top |
Malignant transformation related pathway analysis |
| Find out the enriched GO biological processes and KEGG pathways involved in transition from healthy to precancer to cancer |
| Tissue | Disease Stage | Enriched GO biological Processes |
| Colorectum | AD |  |
| Colorectum | SER |  |
| Colorectum | MSS |  |
| Colorectum | MSI-H |  |
| Colorectum | FAP |  |
| ∗Top 15 enriched GO BP terms are showed in the bar plot of each disease state in each tissue. Each row represents a significant GO biological process which is colored according to the -log10(p.adjust). |
| Page: 1 2 3 4 5 6 7 8 9 |
| GO ID | Tissue | Disease Stage | Description | Gene Ratio | Bg Ratio | pvalue | p.adjust | Count |
| GO:0032535 | Colorectum | AD | regulation of cellular component size | 142/3918 | 383/18723 | 1.74e-13 | 3.41e-11 | 142 |
| GO:0006979 | Colorectum | AD | response to oxidative stress | 145/3918 | 446/18723 | 5.16e-09 | 3.23e-07 | 145 |
| GO:0007006 | Colorectum | AD | mitochondrial membrane organization | 48/3918 | 116/18723 | 4.53e-07 | 1.72e-05 | 48 |
| GO:0045861 | Colorectum | AD | negative regulation of proteolysis | 106/3918 | 351/18723 | 2.33e-05 | 4.57e-04 | 106 |
| GO:0006066 | Colorectum | AD | alcohol metabolic process | 106/3918 | 353/18723 | 3.02e-05 | 5.57e-04 | 106 |
| GO:0060249 | Colorectum | AD | anatomical structure homeostasis | 94/3918 | 314/18723 | 9.37e-05 | 1.42e-03 | 94 |
| GO:0001894 | Colorectum | AD | tissue homeostasis | 81/3918 | 268/18723 | 1.96e-04 | 2.62e-03 | 81 |
| GO:0007568 | Colorectum | AD | aging | 98/3918 | 339/18723 | 2.77e-04 | 3.39e-03 | 98 |
| GO:0008361 | Colorectum | AD | regulation of cell size | 56/3918 | 181/18723 | 9.61e-04 | 9.07e-03 | 56 |
| GO:0010876 | Colorectum | AD | lipid localization | 120/3918 | 448/18723 | 1.59e-03 | 1.33e-02 | 120 |
| GO:0006869 | Colorectum | AD | lipid transport | 108/3918 | 398/18723 | 1.67e-03 | 1.39e-02 | 108 |
| GO:0007033 | Colorectum | AD | vacuole organization | 53/3918 | 180/18723 | 4.18e-03 | 2.89e-02 | 53 |
| GO:0006644 | Colorectum | AD | phospholipid metabolic process | 101/3918 | 383/18723 | 5.80e-03 | 3.67e-02 | 101 |
| GO:0008202 | Colorectum | AD | steroid metabolic process | 85/3918 | 319/18723 | 8.07e-03 | 4.75e-02 | 85 |
| GO:00325351 | Colorectum | SER | regulation of cellular component size | 115/2897 | 383/18723 | 3.04e-13 | 1.10e-10 | 115 |
| GO:00069791 | Colorectum | SER | response to oxidative stress | 114/2897 | 446/18723 | 1.75e-08 | 1.28e-06 | 114 |
| GO:00458611 | Colorectum | SER | negative regulation of proteolysis | 88/2897 | 351/18723 | 1.74e-06 | 7.50e-05 | 88 |
| GO:00070061 | Colorectum | SER | mitochondrial membrane organization | 38/2897 | 116/18723 | 2.66e-06 | 1.10e-04 | 38 |
| GO:00018941 | Colorectum | SER | tissue homeostasis | 66/2897 | 268/18723 | 5.87e-05 | 1.37e-03 | 66 |
| GO:00602491 | Colorectum | SER | anatomical structure homeostasis | 74/2897 | 314/18723 | 1.01e-04 | 2.13e-03 | 74 |
| Page: 1 2 3 4 5 6 7 |
| Pathway ID | Tissue | Disease Stage | Description | Gene Ratio | Bg Ratio | pvalue | p.adjust | qvalue | Count |
| Page: 1 |
Top |
Cell-cell communication analysis |
| Identification of potential cell-cell interactions between two cell types and their ligand-receptor pairs for different disease states |
| Ligand | Receptor | LRpair | Pathway | Tissue | Disease Stage |
| Page: 1 |
Top |
Single-cell gene regulatory network inference analysis |
| Find out the significant the regulons (TFs) and the target genes of each regulon across cell types for different disease states |
| TF | Cell Type | Tissue | Disease Stage | Target Gene | RSS | Regulon Activity |
| ∗The dot plots of a searched regulon are shown for all cell subpopulations in each disease state of each tissue based on the regulon specific score inferred using pySCENIC and by calculating the average expression. |
| Page: 1 |
Top |
Somatic mutation of malignant transformation related genes |
| Annotation of somatic variants for genes involved in malignant transformation |
| Hugo Symbol | Variant Class | Variant Classification | dbSNP RS | HGVSc | HGVSp | HGVSp Short | SWISSPROT | BIOTYPE | SIFT | PolyPhen | Tumor Sample Barcode | Tissue | Histology | Sex | Age | Stage | Therapy Types | Drugs | Outcome |
| CLN8 | SNV | Missense_Mutation | novel | c.660N>G | p.Asp220Glu | p.D220E | Q9UBY8 | protein_coding | tolerated(0.64) | benign(0.014) | TCGA-AA-3812-01 | Colorectum | colon adenocarcinoma | Female | >=65 | I/II | Unknown | Unknown | PD |
| CLN8 | SNV | Missense_Mutation | rs755998291 | c.718N>G | p.Leu240Val | p.L240V | Q9UBY8 | protein_coding | tolerated(0.17) | benign(0.049) | TCGA-AG-3890-01 | Colorectum | rectum adenocarcinoma | Male | <65 | I/II | Unknown | Unknown | SD |
| CLN8 | SNV | Missense_Mutation | c.430N>A | p.Leu144Ile | p.L144I | Q9UBY8 | protein_coding | tolerated(0.49) | benign(0.197) | TCGA-AG-A002-01 | Colorectum | rectum adenocarcinoma | Male | <65 | I/II | Unknown | Unknown | SD | |
| CLN8 | SNV | Missense_Mutation | novel | c.235G>A | p.Ala79Thr | p.A79T | Q9UBY8 | protein_coding | tolerated(0.35) | benign(0.005) | TCGA-A5-A0G2-01 | Endometrium | uterine corpus endometrioid carcinoma | Female | <65 | III/IV | Unknown | Unknown | SD |
| CLN8 | SNV | Missense_Mutation | rs145349613 | c.743N>G | p.Tyr248Cys | p.Y248C | Q9UBY8 | protein_coding | deleterious(0) | probably_damaging(0.979) | TCGA-AP-A0LM-01 | Endometrium | uterine corpus endometrioid carcinoma | Female | <65 | III/IV | Chemotherapy | cisplatin | SD |
| CLN8 | SNV | Missense_Mutation | rs762079123 | c.71N>A | p.Arg24His | p.R24H | Q9UBY8 | protein_coding | deleterious(0) | possibly_damaging(0.849) | TCGA-AX-A2HC-01 | Endometrium | uterine corpus endometrioid carcinoma | Female | <65 | III/IV | Chemotherapy | paclitaxel | PD |
| CLN8 | SNV | Missense_Mutation | rs769069643 | c.160C>T | p.Arg54Cys | p.R54C | Q9UBY8 | protein_coding | tolerated(0.13) | benign(0.012) | TCGA-AX-A2HD-01 | Endometrium | uterine corpus endometrioid carcinoma | Female | >=65 | III/IV | Unknown | Unknown | SD |
| CLN8 | SNV | Missense_Mutation | rs775400768 | c.287N>T | p.Ala96Val | p.A96V | Q9UBY8 | protein_coding | tolerated(1) | benign(0.006) | TCGA-B5-A0K9-01 | Endometrium | uterine corpus endometrioid carcinoma | Female | >=65 | I/II | Unknown | Unknown | SD |
| CLN8 | SNV | Missense_Mutation | novel | c.221G>A | p.Gly74Asp | p.G74D | Q9UBY8 | protein_coding | deleterious(0) | probably_damaging(1) | TCGA-BG-A222-01 | Endometrium | uterine corpus endometrioid carcinoma | Female | <65 | I/II | Unknown | Unknown | SD |
| CLN8 | SNV | Missense_Mutation | novel | c.824A>G | p.Glu275Gly | p.E275G | Q9UBY8 | protein_coding | tolerated(0.34) | benign(0) | TCGA-DF-A2KN-01 | Endometrium | uterine corpus endometrioid carcinoma | Female | Unknown | I/II | Unknown | Unknown | SD |
| Page: 1 2 3 |
Top |
Related drugs of malignant transformation related genes |
| Identification of chemicals and drugs interact with genes involved in malignant transfromation |
| (DGIdb 4.0) |
| Entrez ID | Symbol | Category | Interaction Types | Drug Claim Name | Drug Name | PMIDs |
| Page: 1 |

Copyright 2023-Present -The University of Texas Health Science Center at Houston |