Schematic overview of the cellular and molecular mechanisms involved in the cancer progression, including the proposed cellular and molecular mechanisms in cancer cells trajectory. AT1: alveolar type 1 cells; AT2: alveolar type 2 cells; AAH: atypical adenomatous hyperplasia; AIS: adenocarcinoma in situ; MIA: minimally invasive adenocarcinoma; IA: invasive adenocarcinoma; EMT: epithelial-mesenchymal transition

Home

Download

Statistics

Help

Contact

Center for Computational Systems Medicine
leaf

Gene summary

leaf

Malignant transformation analysis

leaf

Malignant transformation related pathway analysis

leaf

Cell-cell communication analysis

leaf

Single-cell gene regulatory network inference analysis

leaf

Somatic mutation of malignant transformation related genes

leaf

Related drugs of malignant transformation related genes

Gene: CLCN3

Gene summary for CLCN3

check button Gene summary.

Gene informationSpeciesHuman
Gene symbol

CLCN3

Gene ID

1182

Gene namechloride voltage-gated channel 3
Gene AliasCLC3
Cytomap4q33
Gene Typeprotein-coding
GO ID

GO:0001894

UniProtAcc

P51790


Top

Malignant transformation analysis

check button Identification of the aberrant gene expression in precancerous and cancerous lesions by comparing the gene expression of stem-like cells in diseased tissues with normal stem cells
check button Malignant transformation involving gene list.
Entrez IDSymbolReplicatesSpeciesOrganTissueAdj P-valueLog2FCMalignancy
1182CLCN3P17T-EHumanEsophagusESCC2.75e-093.30e-010.1278
1182CLCN3P20T-EHumanEsophagusESCC5.41e-071.72e-010.1124
1182CLCN3P21T-EHumanEsophagusESCC6.23e-212.20e-010.1617
1182CLCN3P22T-EHumanEsophagusESCC4.01e-193.69e-010.1236
1182CLCN3P23T-EHumanEsophagusESCC1.65e-112.69e-010.108
1182CLCN3P24T-EHumanEsophagusESCC1.26e-111.90e-010.1287
1182CLCN3P26T-EHumanEsophagusESCC4.08e-285.28e-010.1276
1182CLCN3P27T-EHumanEsophagusESCC2.22e-182.94e-010.1055
1182CLCN3P28T-EHumanEsophagusESCC4.51e-101.29e-010.1149
1182CLCN3P30T-EHumanEsophagusESCC5.00e-124.14e-010.137
1182CLCN3P31T-EHumanEsophagusESCC2.08e-151.86e-010.1251
1182CLCN3P32T-EHumanEsophagusESCC2.20e-234.79e-010.1666
1182CLCN3P36T-EHumanEsophagusESCC3.92e-083.52e-010.1187
1182CLCN3P37T-EHumanEsophagusESCC3.79e-245.00e-010.1371
1182CLCN3P39T-EHumanEsophagusESCC3.41e-161.91e-010.0894
1182CLCN3P40T-EHumanEsophagusESCC3.13e-083.19e-010.109
1182CLCN3P42T-EHumanEsophagusESCC1.79e-185.25e-010.1175
1182CLCN3P44T-EHumanEsophagusESCC2.21e-102.53e-010.1096
1182CLCN3P47T-EHumanEsophagusESCC8.38e-099.50e-020.1067
1182CLCN3P48T-EHumanEsophagusESCC4.08e-052.15e-010.0959
Page: 1 2 3 4 5 6 7 

check button Transcriptomic changes along malignancy continuum.
TissueExpression DynamicsAbbreviation
Colorectum (GSE201348)The image shows the transcriptomic changes along malignancy continuum.log2FC in expression of this searched gene in stem-like cells from each diseased tissue sample relative to stem-like cells in normal samples in each tissue plotted against the malignancy continuum. Samples are colored based on if they are from different disease stage.FAP: Familial adenomatous polyposis
CRC: Colorectal cancer
Colorectum (HTA11)The image shows the transcriptomic changes along malignancy continuum.log2FC in expression of this searched gene in stem-like cells from each diseased tissue sample relative to stem-like cells in normal samples in each tissue plotted against the malignancy continuum. Samples are colored based on if they are from different disease stage.AD: Adenomas
SER: Sessile serrated lesions
MSI-H: Microsatellite-high colorectal cancer
MSS: Microsatellite stable colorectal cancer
EsophagusThe image shows the transcriptomic changes along malignancy continuum.log2FC in expression of this searched gene in stem-like cells from each diseased tissue sample relative to stem-like cells in normal samples in each tissue plotted against the malignancy continuum. Samples are colored based on if they are from different disease stage.
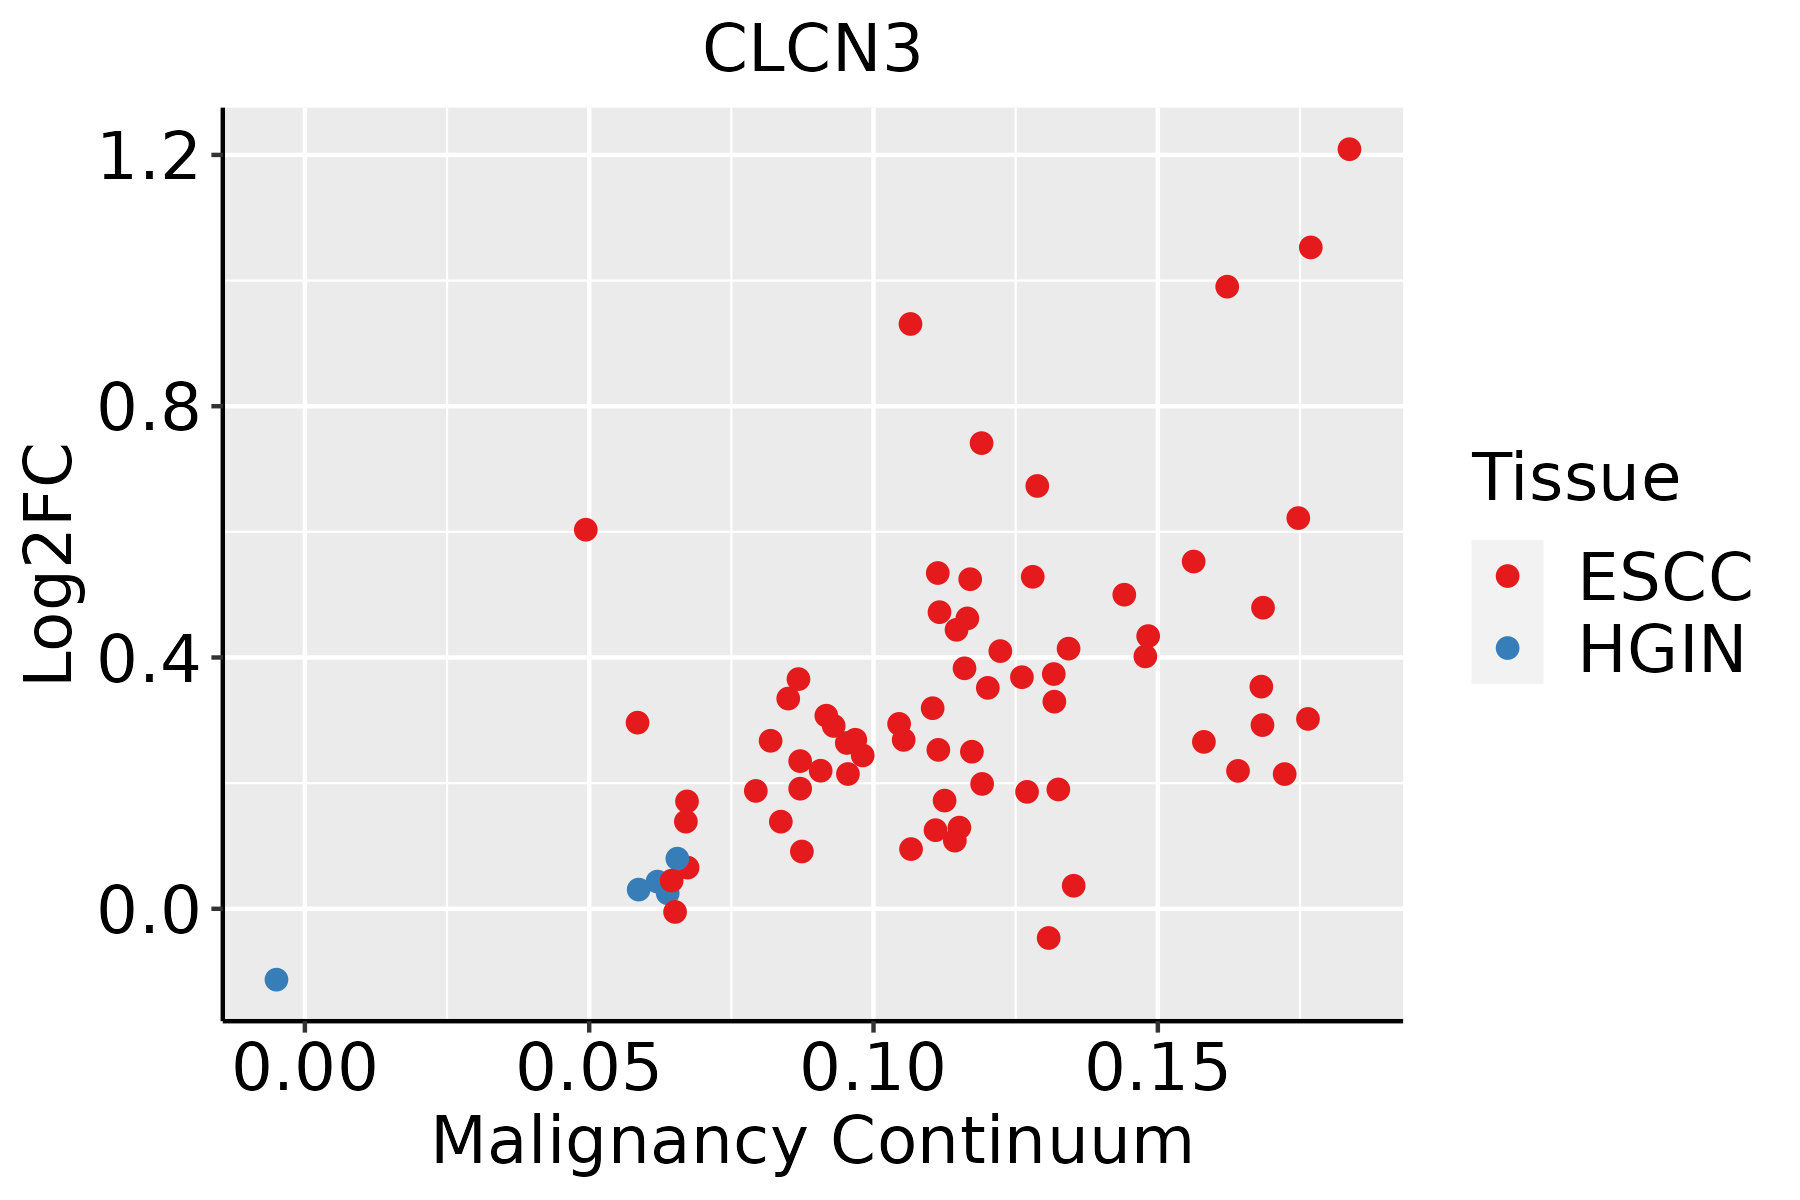
ESCC: Esophageal squamous cell carcinoma
HGIN: High-grade intraepithelial neoplasias
LGIN: Low-grade intraepithelial neoplasias
LiverThe image shows the transcriptomic changes along malignancy continuum.log2FC in expression of this searched gene in stem-like cells from each diseased tissue sample relative to stem-like cells in normal samples in each tissue plotted against the malignancy continuum. Samples are colored based on if they are from different disease stage.
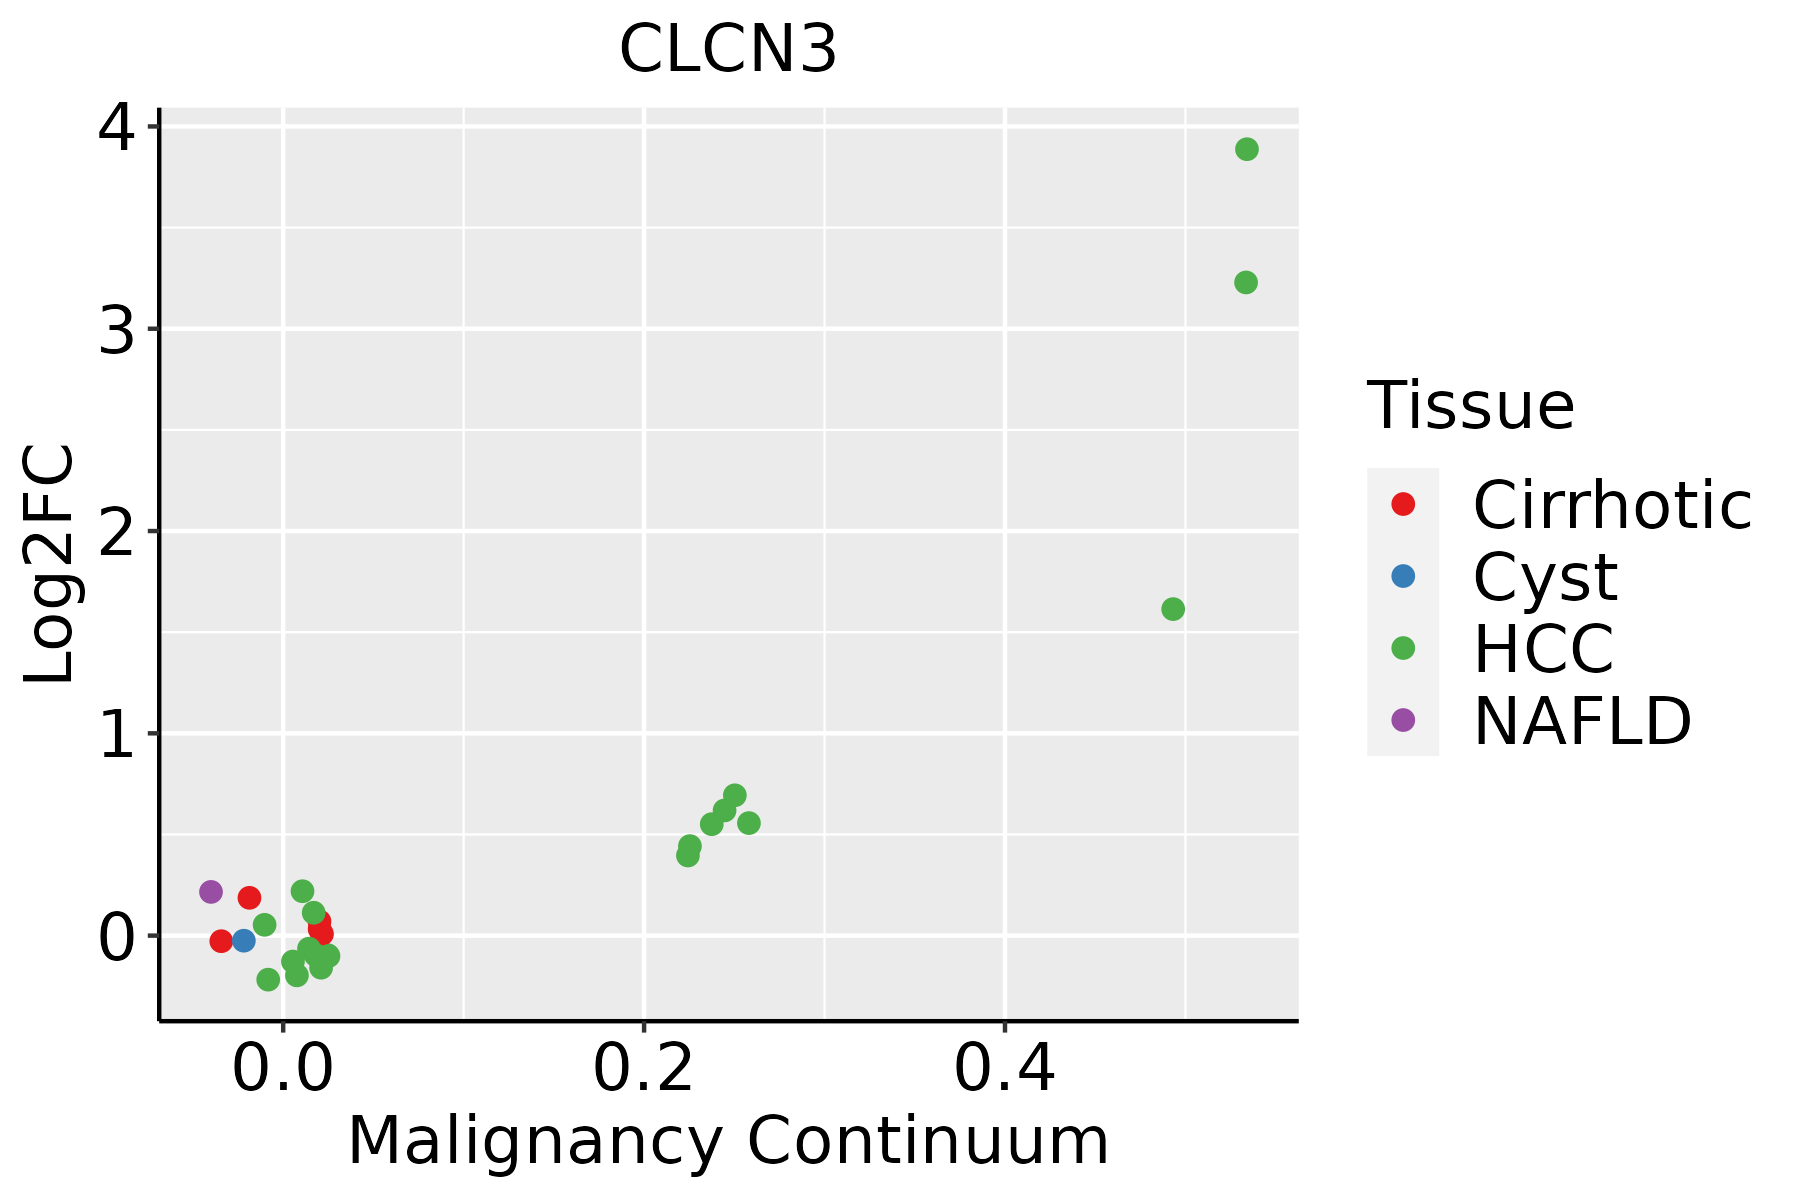
HCC: Hepatocellular carcinoma
NAFLD: Non-alcoholic fatty liver disease
ProstateThe image shows the transcriptomic changes along malignancy continuum.log2FC in expression of this searched gene in stem-like cells from each diseased tissue sample relative to stem-like cells in normal samples in each tissue plotted against the malignancy continuum. Samples are colored based on if they are from different disease stage.BPH: Benign Prostatic Hyperplasia
SkinThe image shows the transcriptomic changes along malignancy continuum.log2FC in expression of this searched gene in stem-like cells from each diseased tissue sample relative to stem-like cells in normal samples in each tissue plotted against the malignancy continuum. Samples are colored based on if they are from different disease stage.
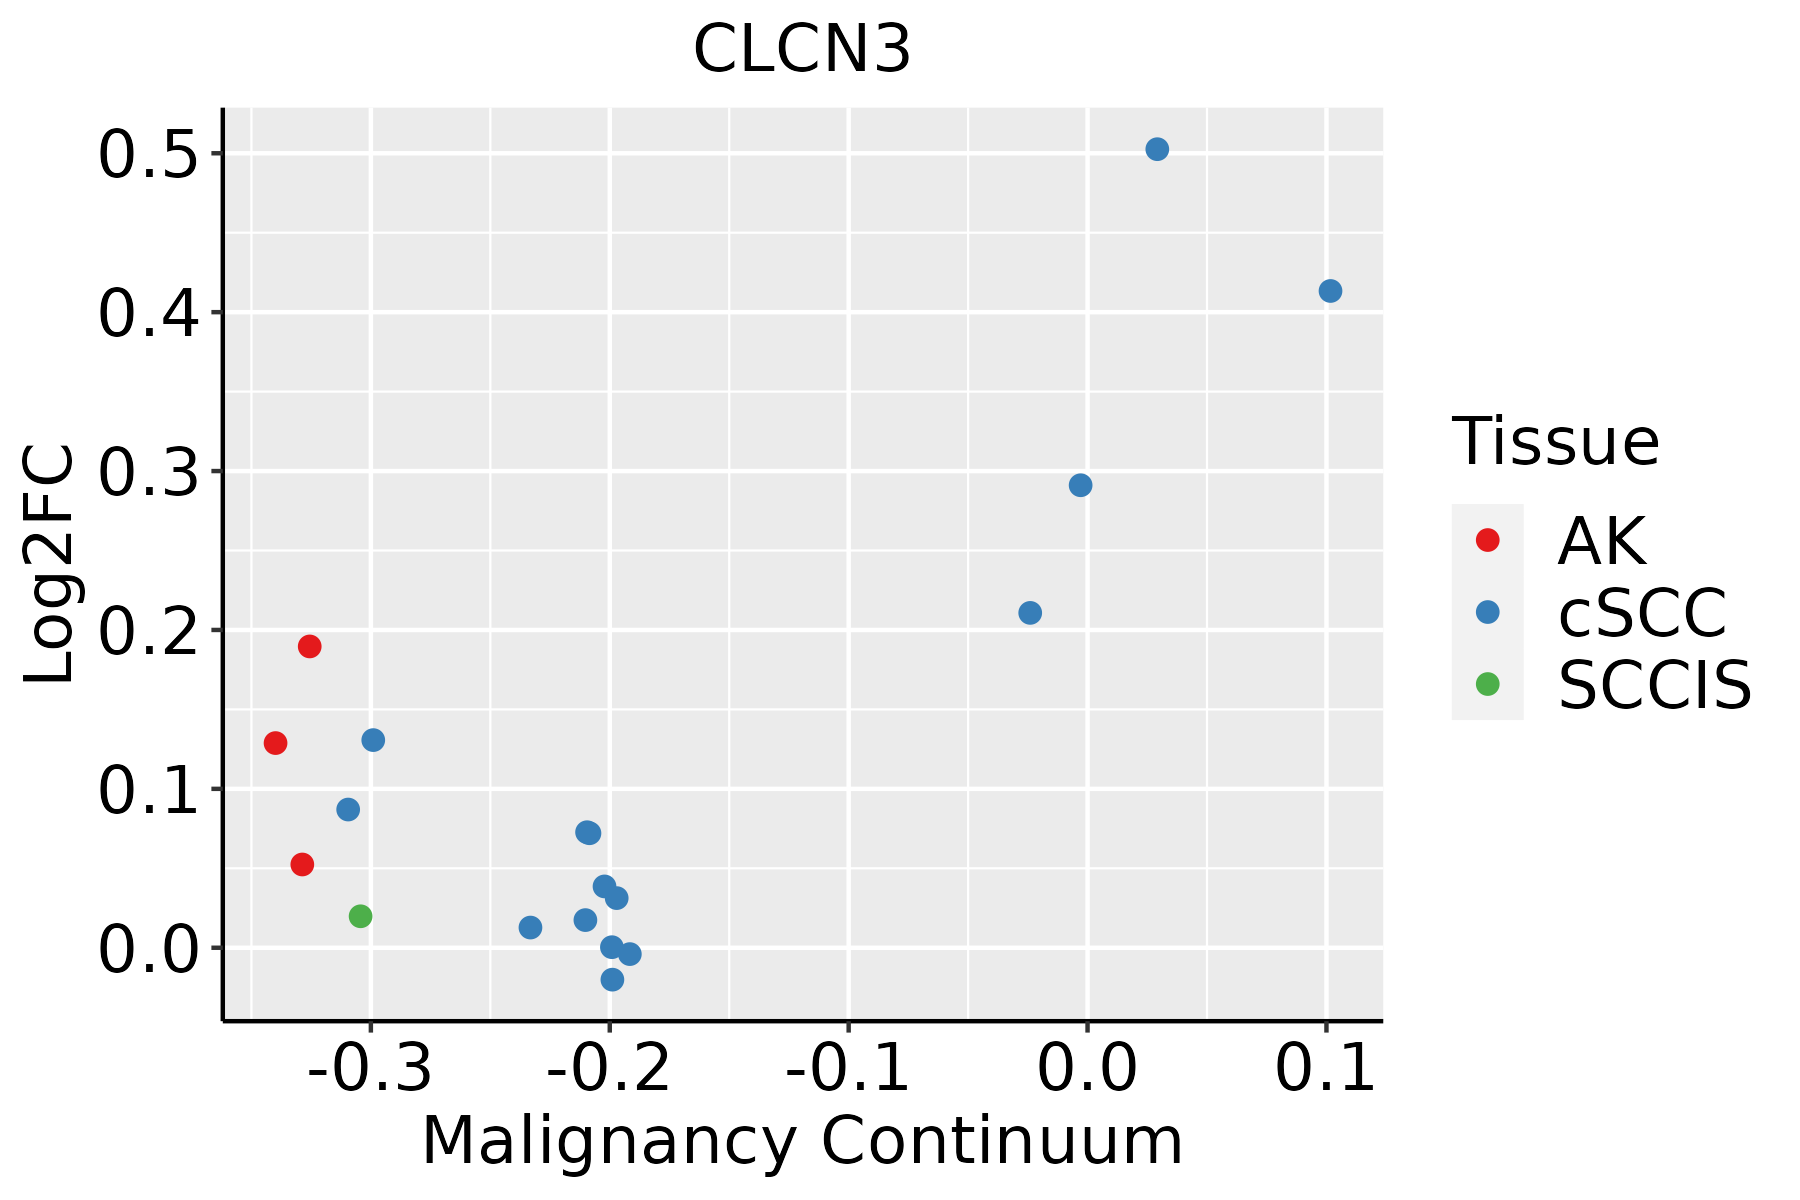
AK: Actinic keratosis
cSCC: Cutaneous squamous cell carcinoma
SCCIS:squamous cell carcinoma in situ
ThyroidThe image shows the transcriptomic changes along malignancy continuum.log2FC in expression of this searched gene in stem-like cells from each diseased tissue sample relative to stem-like cells in normal samples in each tissue plotted against the malignancy continuum. Samples are colored based on if they are from different disease stage.ATC: Anaplastic thyroid cancer
HT: Hashimoto's thyroiditis
PTC: Papillary thyroid cancer
∗log2FC in expression of this searched gene in stem-like cells from each diseased tissue sample relative to stem-like cells in normal samples in each tissue plotted against the malignancy continuum. Samples are colored based on if they are from different disease stage.

Top

Malignant transformation related pathway analysis

check buttonFind out the enriched GO biological processes and KEGG pathways involved in transition from healthy to precancer to cancer
check button Figure of enriched GO biological processes.
TissueDisease StageEnriched GO biological Processes
ColorectumADGO analysis - Figure of enriched GO biological processes: Top 15 enriched GO BP terms are showed in the bar plot of each disease state in each tissue. Each row represents a significant GO biological process which is colored according to the -log10(p.adjust).
ColorectumSERGO analysis - Figure of enriched GO biological processes: Top 15 enriched GO BP terms are showed in the bar plot of each disease state in each tissue. Each row represents a significant GO biological process which is colored according to the -log10(p.adjust).
ColorectumMSSGO analysis - Figure of enriched GO biological processes: Top 15 enriched GO BP terms are showed in the bar plot of each disease state in each tissue. Each row represents a significant GO biological process which is colored according to the -log10(p.adjust).
ColorectumMSI-HGO analysis - Figure of enriched GO biological processes: Top 15 enriched GO BP terms are showed in the bar plot of each disease state in each tissue. Each row represents a significant GO biological process which is colored according to the -log10(p.adjust).
ColorectumFAPGO analysis - Figure of enriched GO biological processes: Top 15 enriched GO BP terms are showed in the bar plot of each disease state in each tissue. Each row represents a significant GO biological process which is colored according to the -log10(p.adjust).
∗Top 15 enriched GO BP terms are showed in the bar plot of each disease state in each tissue. Each row represents a significant GO biological process which is colored according to the -log10(p.adjust).
Page: 1 2 3 4 5 6 7 8 9 

check button Enriched GO biological processes.
GO IDTissueDisease StageDescriptionGene RatioBg Ratiopvaluep.adjustCount
GO:0032535ColorectumADregulation of cellular component size142/3918383/187231.74e-133.41e-11142
GO:1902600ColorectumADproton transmembrane transport66/3918157/187231.59e-091.17e-0766
GO:0016050ColorectumADvesicle organization101/3918300/187231.65e-077.17e-06101
GO:0007032ColorectumADendosome organization33/391882/187235.30e-059.01e-0433
GO:0060249ColorectumADanatomical structure homeostasis94/3918314/187239.37e-051.42e-0394
GO:0001894ColorectumADtissue homeostasis81/3918268/187231.96e-042.62e-0381
GO:0072593ColorectumADreactive oxygen species metabolic process73/3918239/187232.79e-043.42e-0373
GO:2000379ColorectumADpositive regulation of reactive oxygen species metabolic process29/391876/187234.31e-044.82e-0329
GO:0030004ColorectumADcellular monovalent inorganic cation homeostasis36/3918103/187236.80e-046.95e-0336
GO:0008361ColorectumADregulation of cell size56/3918181/187239.61e-049.07e-0356
GO:0030641ColorectumADregulation of cellular pH29/391881/187231.42e-031.22e-0229
GO:2000377ColorectumADregulation of reactive oxygen species metabolic process48/3918157/187232.77e-032.09e-0248
GO:0051453ColorectumADregulation of intracellular pH26/391875/187234.04e-032.82e-0226
GO:0006885ColorectumADregulation of pH30/391891/187234.95e-033.32e-0230
GO:0055067ColorectumADmonovalent inorganic cation homeostasis45/3918151/187236.19e-033.88e-0245
GO:0099003ColorectumADvesicle-mediated transport in synapse57/3918200/187236.53e-034.06e-0257
GO:0015698ColorectumADinorganic anion transport52/3918180/187236.83e-034.22e-0252
GO:00325352ColorectumMSSregulation of cellular component size127/3467383/187233.44e-125.79e-10127
GO:19026002ColorectumMSSproton transmembrane transport57/3467157/187231.00e-074.81e-0657
GO:00160502ColorectumMSSvesicle organization93/3467300/187231.04e-074.97e-0693
Page: 1 2 3 4 5 6 7 

check button Enriched KEGG pathways.
Pathway IDTissueDisease StageDescriptionGene RatioBg Ratiopvaluep.adjustqvalueCount
Page: 1 

Top

Cell-cell communication analysis

check buttonIdentification of potential cell-cell interactions between two cell types and their ligand-receptor pairs for different disease states
LigandReceptorLRpairPathwayTissueDisease Stage
Page: 1 

Top

Single-cell gene regulatory network inference analysis

check buttonFind out the significant the regulons (TFs) and the target genes of each regulon across cell types for different disease states
TFCell TypeTissueDisease StageTarget GeneRSSRegulon Activity
∗The dot plots of a searched regulon are shown for all cell subpopulations in each disease state of each tissue based on the regulon specific score inferred using pySCENIC and by calculating the average expression.
Page: 1 

Top

Somatic mutation of malignant transformation related genes

check buttonAnnotation of somatic variants for genes involved in malignant transformation
Hugo SymbolVariant ClassVariant ClassificationdbSNP RSHGVScHGVSpHGVSp ShortSWISSPROTBIOTYPESIFTPolyPhenTumor Sample BarcodeTissueHistologySexAgeStageTherapy TypesDrugsOutcome
CLCN3SNVMissense_Mutationc.2106N>Tp.Arg702Serp.R702SP51790protein_codingtolerated(0.34)possibly_damaging(0.474)TCGA-AO-A0JG-01Breastbreast invasive carcinomaFemale<65III/IVChemotherapydoxorubicinSD
CLCN3SNVMissense_Mutationc.2309N>Gp.Ile770Serp.I770SP51790protein_codingdeleterious(0.03)benign(0.125)TCGA-AR-A0TV-01Breastbreast invasive carcinomaFemale>=65I/IIUnknownUnknownSD
CLCN3SNVMissense_Mutationc.1769N>Tp.Thr590Ilep.T590IP51790protein_codingdeleterious(0)probably_damaging(0.997)TCGA-C8-A12Z-01Breastbreast invasive carcinomaFemale<65I/IIChemotherapy5-fluorouracilCR
CLCN3SNVMissense_Mutationc.2296N>Gp.Thr766Alap.T766AP51790protein_codingdeleterious(0.01)possibly_damaging(0.63)TCGA-D8-A1XK-01Breastbreast invasive carcinomaFemale<65I/IIChemotherapydoxorubicine+cyclophosphamideSD
CLCN3SNVMissense_Mutationnovelc.226N>Tp.Asp76Tyrp.D76YP51790protein_codingdeleterious(0)possibly_damaging(0.521)TCGA-D8-A27V-01Breastbreast invasive carcinomaFemale<65I/IIHormone TherapytamoxiphenSD
CLCN3SNVMissense_Mutationc.670C>Ap.Leu224Ilep.L224IP51790protein_codingtolerated(0.12)benign(0.101)TCGA-2W-A8YY-01Cervixcervical & endocervical cancerFemale<65I/IIChemotherapycisplatinCR
CLCN3SNVMissense_Mutationnovelc.1213G>Ap.Ala405Thrp.A405TP51790protein_codingtolerated(0.45)benign(0.31)TCGA-2W-A8YY-01Cervixcervical & endocervical cancerFemale<65I/IIChemotherapycisplatinCR
CLCN3SNVMissense_Mutationc.719N>Tp.Gly240Valp.G240VP51790protein_codingdeleterious(0)probably_damaging(0.996)TCGA-C5-A905-01Cervixcervical & endocervical cancerFemale<65I/IIUnknownUnknownSD
CLCN3SNVMissense_Mutationnovelc.115N>Gp.Gln39Glup.Q39EP51790protein_codingtolerated(0.71)benign(0.012)TCGA-IR-A3LH-01Cervixcervical & endocervical cancerFemale<65I/IIChemotherapycisplatinCR
CLCN3SNVMissense_Mutationc.1228N>Ap.Ala410Thrp.A410TP51790protein_codingtolerated(0.19)benign(0.111)TCGA-AA-3977-01Colorectumcolon adenocarcinomaMale>=65I/IIUnknownUnknownSD
Page: 1 2 3 4 5 6 7 8 9 10 11 

Top

Related drugs of malignant transformation related genes

check buttonIdentification of chemicals and drugs interact with genes involved in malignant transfromation
(DGIdb 4.0)
Entrez IDSymbolCategoryInteraction TypesDrug Claim NameDrug NamePMIDs
1182CLCN3DRUGGABLE GENOME, ION CHANNEL, CELL SURFACE, EXTERNAL SIDE OF PLASMA MEMBRANE, KINASE, TRANSPORTERblocker178101102PHLORETIN
1182CLCN3DRUGGABLE GENOME, ION CHANNEL, CELL SURFACE, EXTERNAL SIDE OF PLASMA MEMBRANE, KINASE, TRANSPORTERDESACETYLBUFOTALINDESACETYLBUFOTALIN23799775
1182CLCN3DRUGGABLE GENOME, ION CHANNEL, CELL SURFACE, EXTERNAL SIDE OF PLASMA MEMBRANE, KINASE, TRANSPORTERCINOBUFAGINCINOBUFAGIN23799775
1182CLCN3DRUGGABLE GENOME, ION CHANNEL, CELL SURFACE, EXTERNAL SIDE OF PLASMA MEMBRANE, KINASE, TRANSPORTERBUFALINBUFALIN23799775
Page: 1