
|
|||||
|
 | |
| |
| |
| |
| |
| |
|
Gene: CIAO2B |
Gene summary for CIAO2B |
| Gene information | Species | Human | Gene symbol | CIAO2B | Gene ID | 51647 |
| Gene name | cytosolic iron-sulfur assembly component 2B | |
| Gene Alias | CGI-128 | |
| Cytomap | 16q22.1 | |
| Gene Type | protein-coding | GO ID | GO:0006790 | UniProtAcc | Q9Y3D0 |
Top |
Malignant transformation analysis |
| Identification of the aberrant gene expression in precancerous and cancerous lesions by comparing the gene expression of stem-like cells in diseased tissues with normal stem cells |
| Entrez ID | Symbol | Replicates | Species | Organ | Tissue | Adj P-value | Log2FC | Malignancy |
| 51647 | CIAO2B | HTA11_6818_2000001021 | Human | Colorectum | AD | 7.48e-10 | 3.22e-01 | 0.0588 |
| 51647 | CIAO2B | LZE2D | Human | Esophagus | HGIN | 1.57e-04 | 4.85e-01 | 0.0642 |
| 51647 | CIAO2B | LZE2T | Human | Esophagus | ESCC | 1.80e-11 | 1.31e+00 | 0.082 |
| 51647 | CIAO2B | LZE3D | Human | Esophagus | HGIN | 1.02e-08 | 1.20e+00 | 0.0668 |
| 51647 | CIAO2B | LZE4T | Human | Esophagus | ESCC | 3.37e-55 | 1.28e+00 | 0.0811 |
| 51647 | CIAO2B | LZE5T | Human | Esophagus | ESCC | 1.02e-18 | 1.07e+00 | 0.0514 |
| 51647 | CIAO2B | LZE7T | Human | Esophagus | ESCC | 1.02e-40 | 1.96e+00 | 0.0667 |
| 51647 | CIAO2B | LZE8T | Human | Esophagus | ESCC | 1.05e-40 | 1.09e+00 | 0.067 |
| 51647 | CIAO2B | LZE20T | Human | Esophagus | ESCC | 5.58e-41 | 1.14e+00 | 0.0662 |
| 51647 | CIAO2B | LZE21D1 | Human | Esophagus | HGIN | 4.41e-04 | 9.79e-01 | 0.0632 |
| 51647 | CIAO2B | LZE22D1 | Human | Esophagus | HGIN | 1.88e-18 | 7.15e-01 | 0.0595 |
| 51647 | CIAO2B | LZE22T | Human | Esophagus | ESCC | 6.43e-20 | 1.25e+00 | 0.068 |
| 51647 | CIAO2B | LZE24D1 | Human | Esophagus | HGIN | 1.02e-08 | 1.26e+00 | 0.054 |
| 51647 | CIAO2B | LZE24T | Human | Esophagus | ESCC | 4.83e-66 | 1.69e+00 | 0.0596 |
| 51647 | CIAO2B | LZE22D3 | Human | Esophagus | HGIN | 3.01e-07 | 7.16e-01 | 0.0653 |
| 51647 | CIAO2B | LZE21T | Human | Esophagus | ESCC | 1.17e-33 | 1.51e+00 | 0.0655 |
| 51647 | CIAO2B | LZE6T | Human | Esophagus | ESCC | 1.00e-32 | 9.54e-01 | 0.0845 |
| 51647 | CIAO2B | GSM5252130_BPH340PrGF_Via | Human | Prostate | BPH | 5.11e-12 | 4.69e-01 | -0.1972 |
| 51647 | CIAO2B | GSM5252133_BPH389PrSF | Human | Prostate | BPH | 6.03e-03 | 6.93e-01 | -0.2027 |
| 51647 | CIAO2B | GSM5252135_BPH511PrPUr_Fcol_3GEX | Human | Prostate | BPH | 2.43e-06 | 4.66e-01 | -0.1833 |
| Page: 1 2 3 4 5 6 |
| Tissue | Expression Dynamics | Abbreviation |
| Cervix | 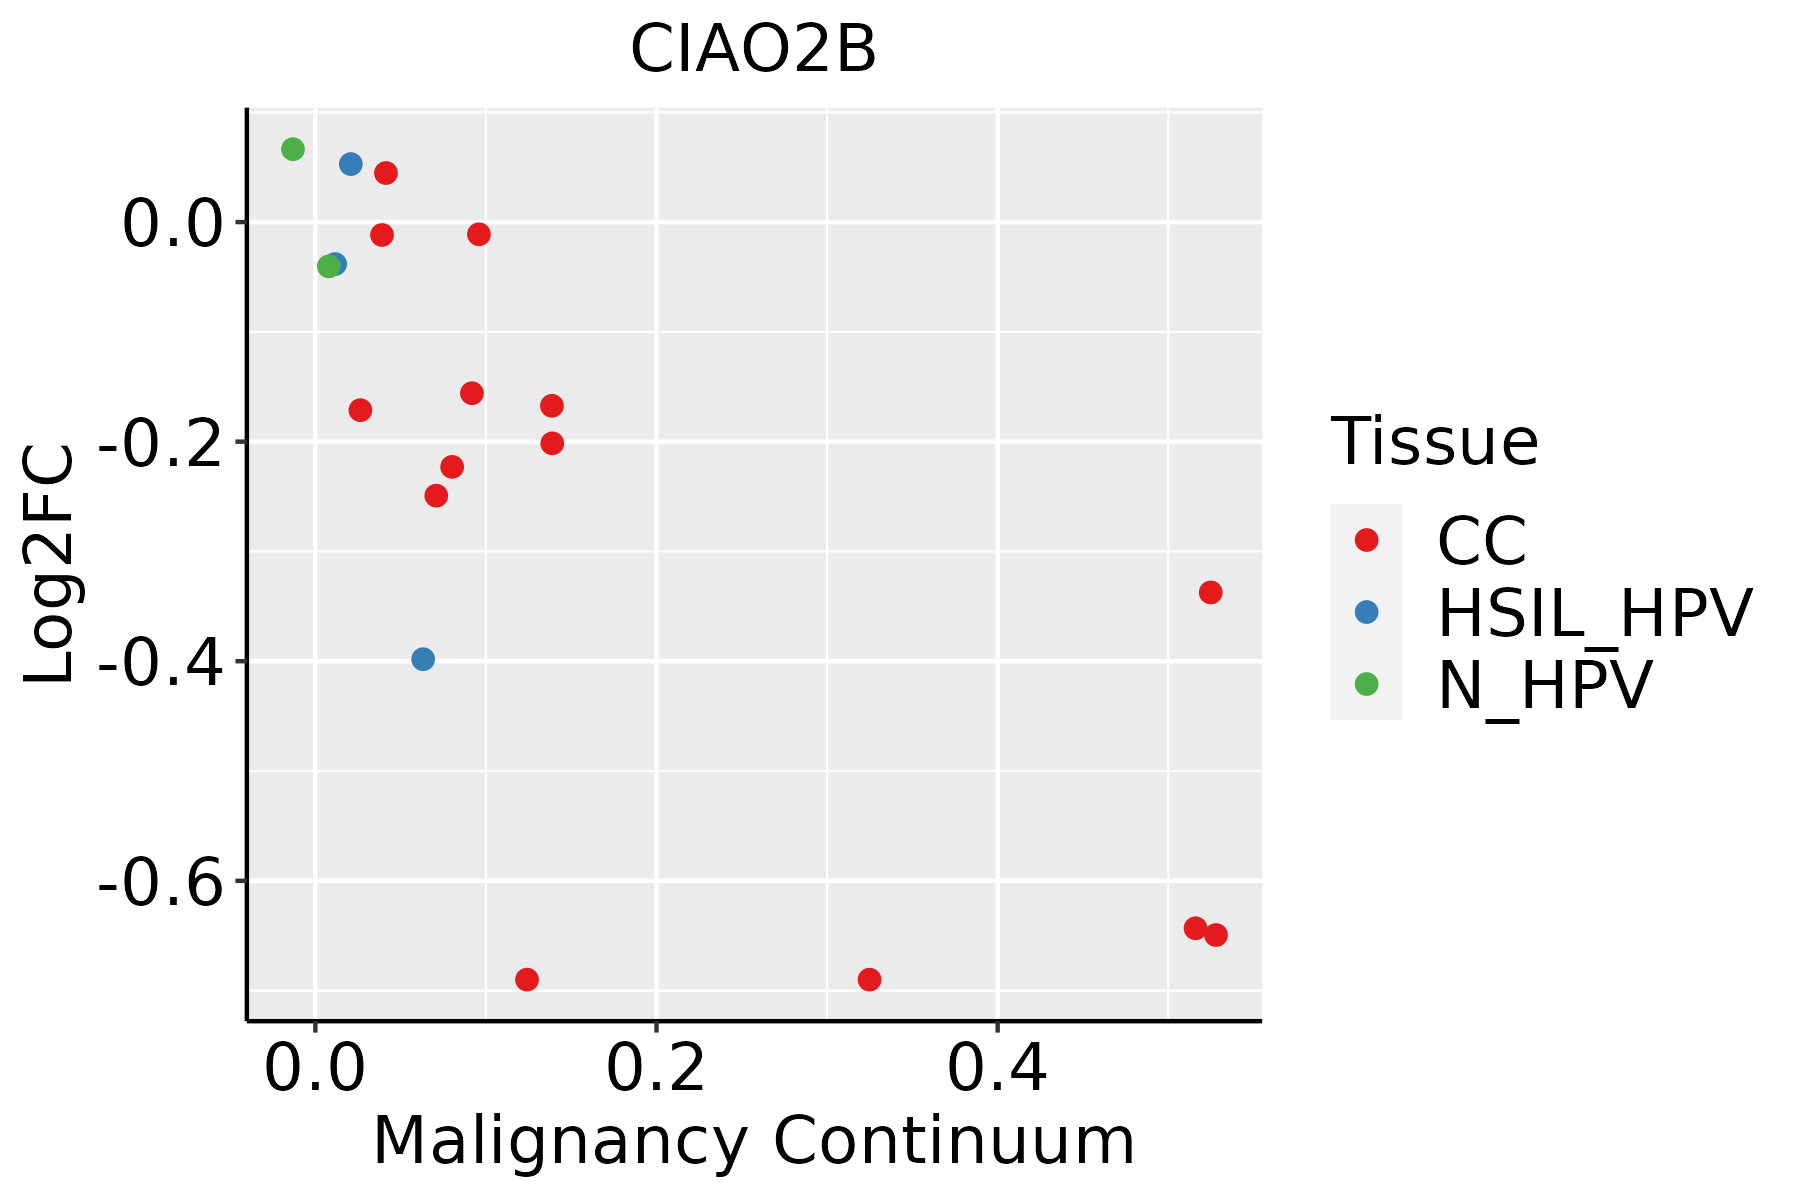 | CC: Cervix cancer |
| HSIL_HPV: HPV-infected high-grade squamous intraepithelial lesions | ||
| N_HPV: HPV-infected normal cervix | ||
| Colorectum (GSE201348) |  | FAP: Familial adenomatous polyposis |
| CRC: Colorectal cancer | ||
| Colorectum (HTA11) |  | AD: Adenomas |
| SER: Sessile serrated lesions | ||
| MSI-H: Microsatellite-high colorectal cancer | ||
| MSS: Microsatellite stable colorectal cancer | ||
| Esophagus | 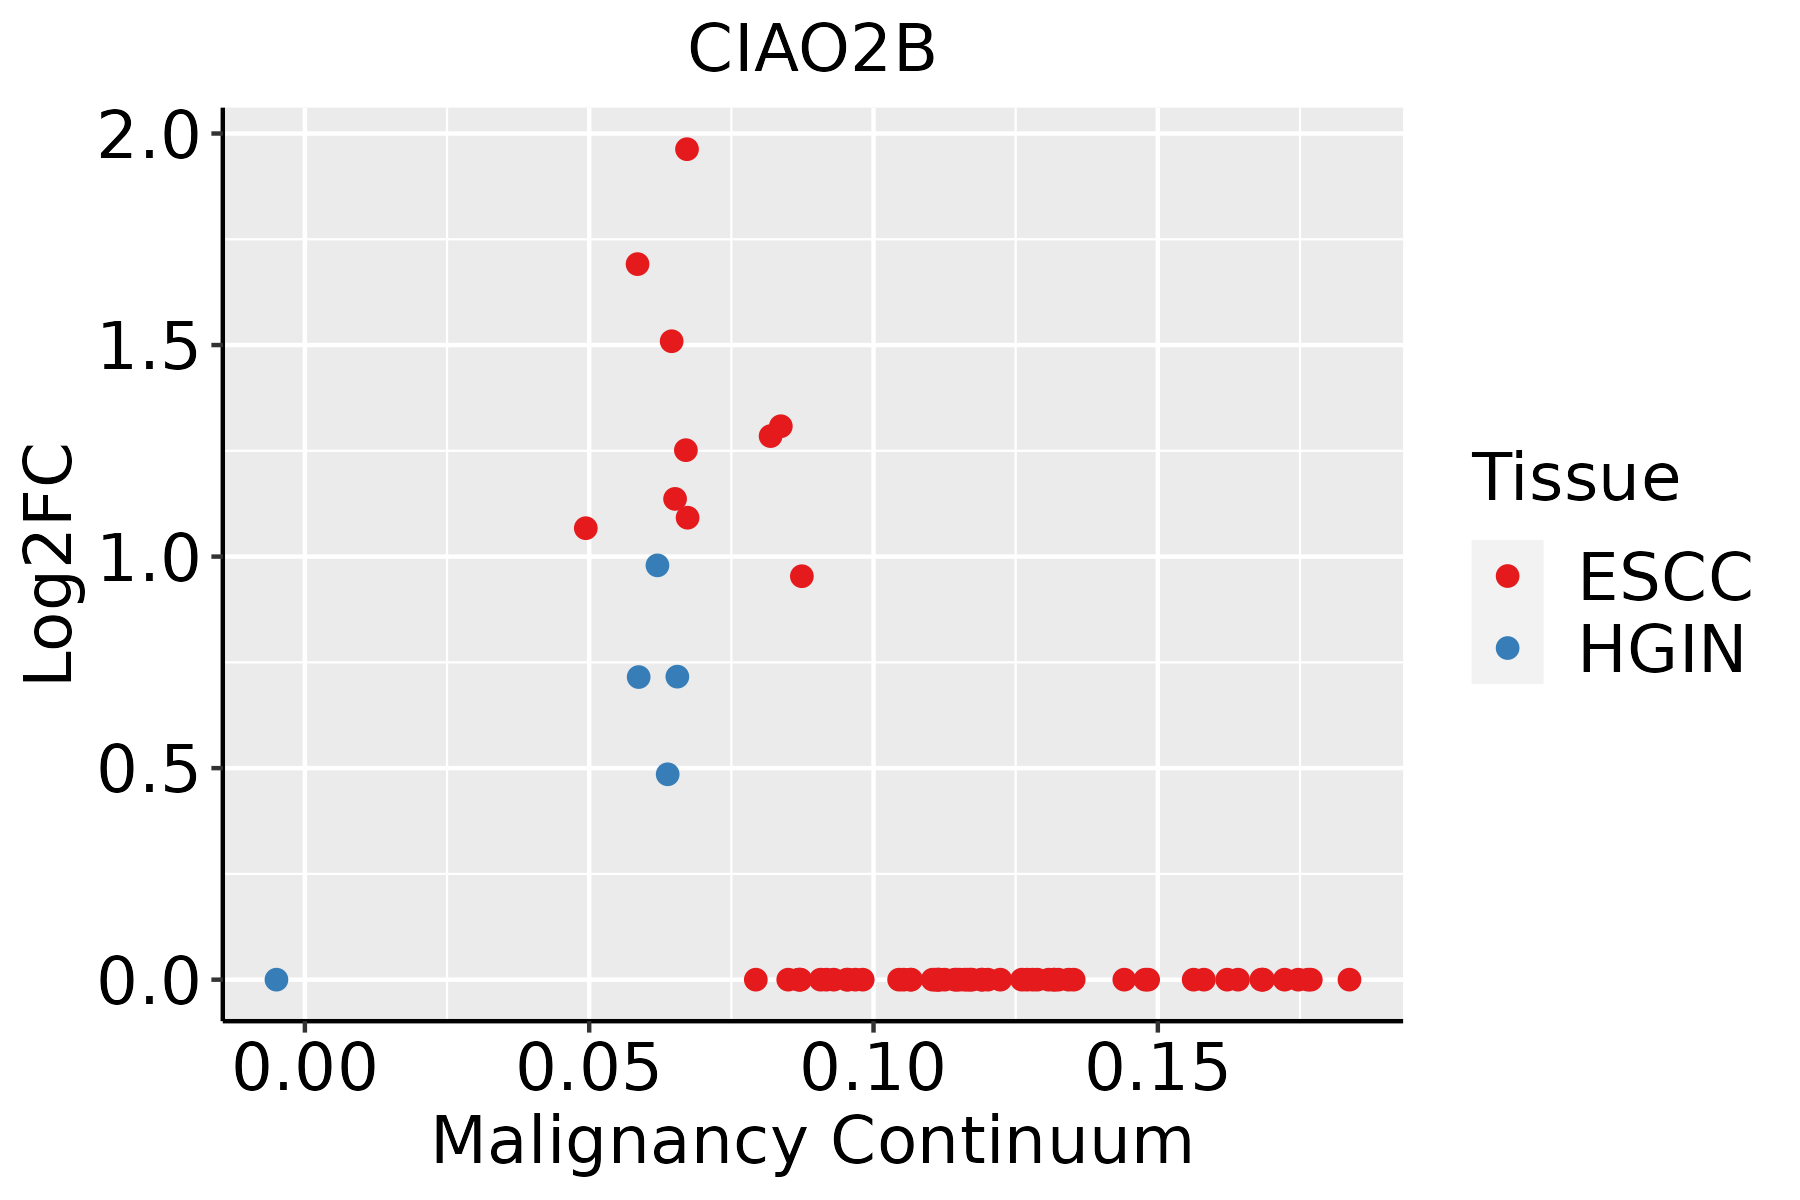 | ESCC: Esophageal squamous cell carcinoma |
| HGIN: High-grade intraepithelial neoplasias | ||
| LGIN: Low-grade intraepithelial neoplasias | ||
| GC | 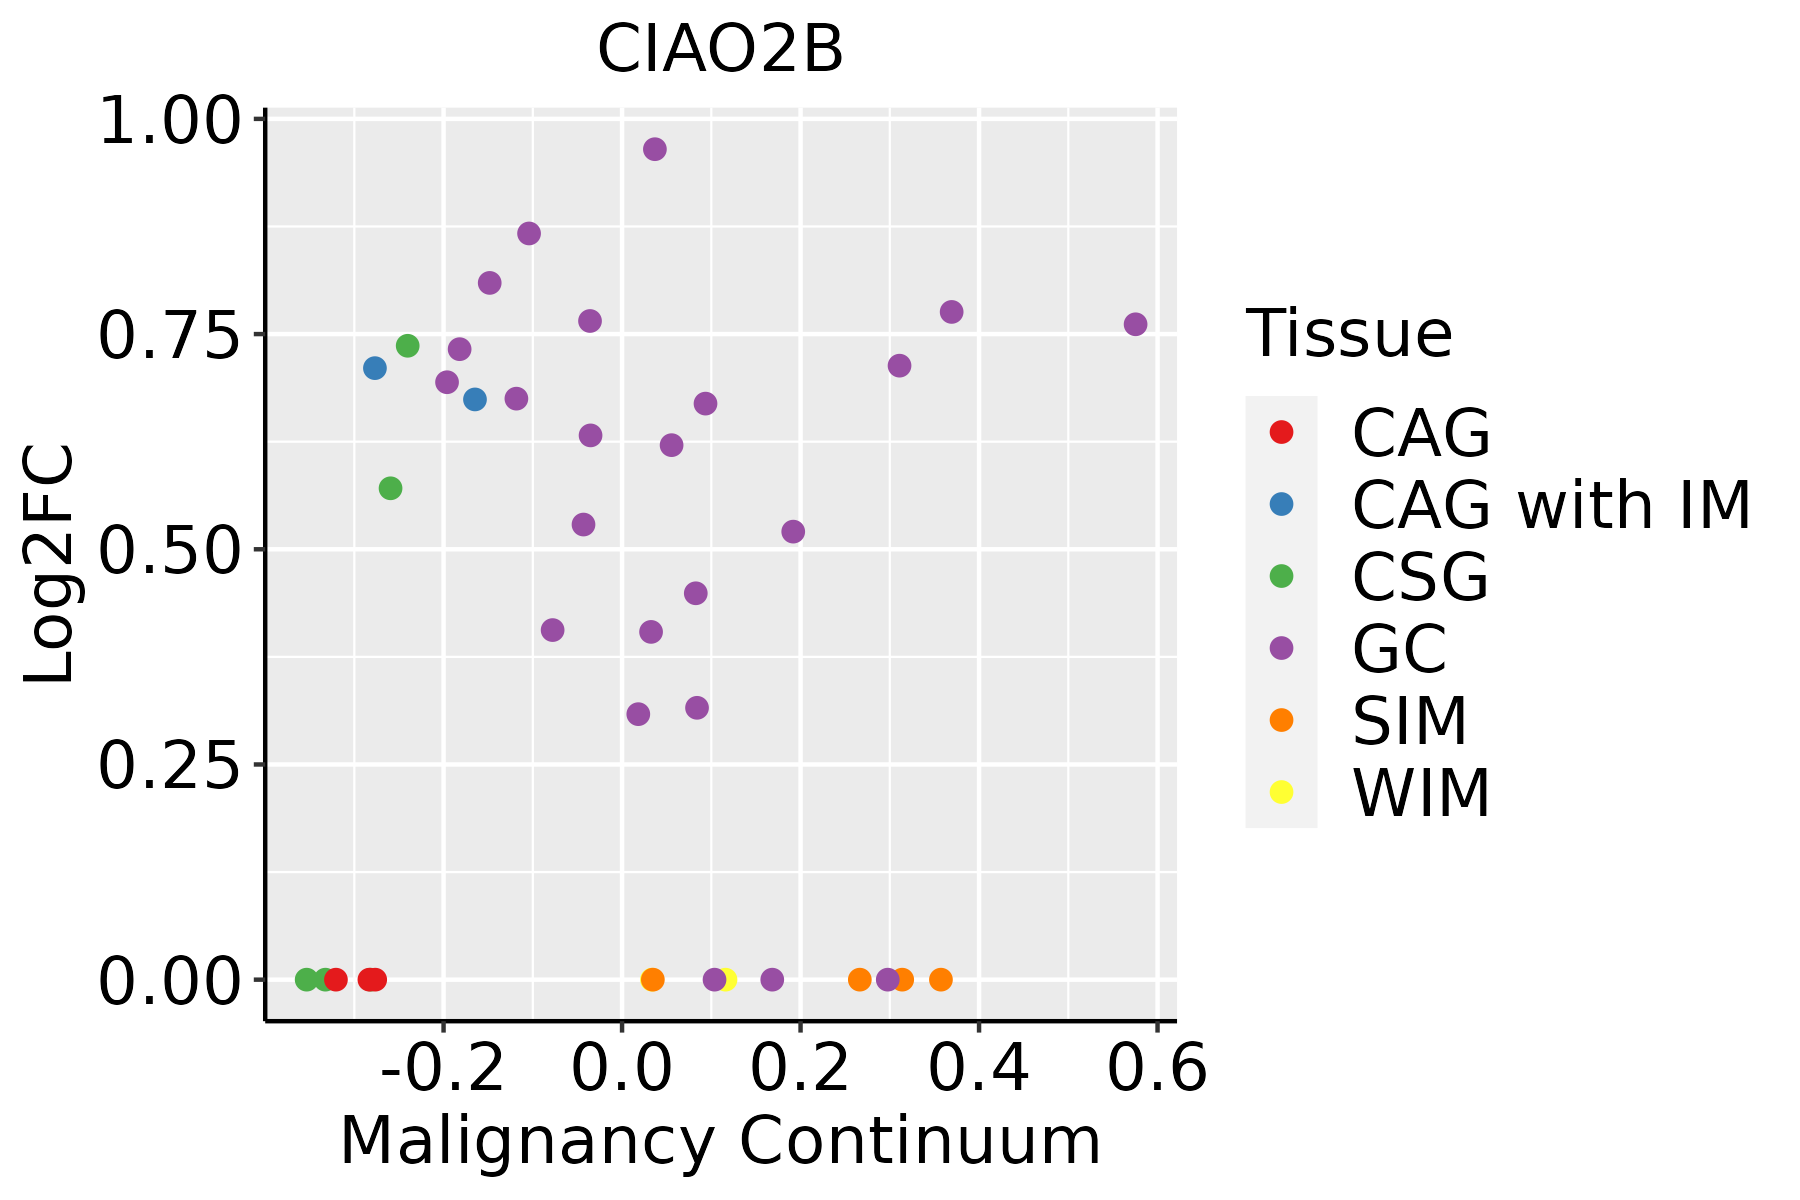 | CAG: Chronic atrophic gastritis |
| CAG with IM: Chronic atrophic gastritis with intestinal metaplasia | ||
| CSG: Chronic superficial gastritis | ||
| GC: Gastric cancer | ||
| SIM: Severe intestinal metaplasia | ||
| WIM: Wild intestinal metaplasia | ||
| Prostate | 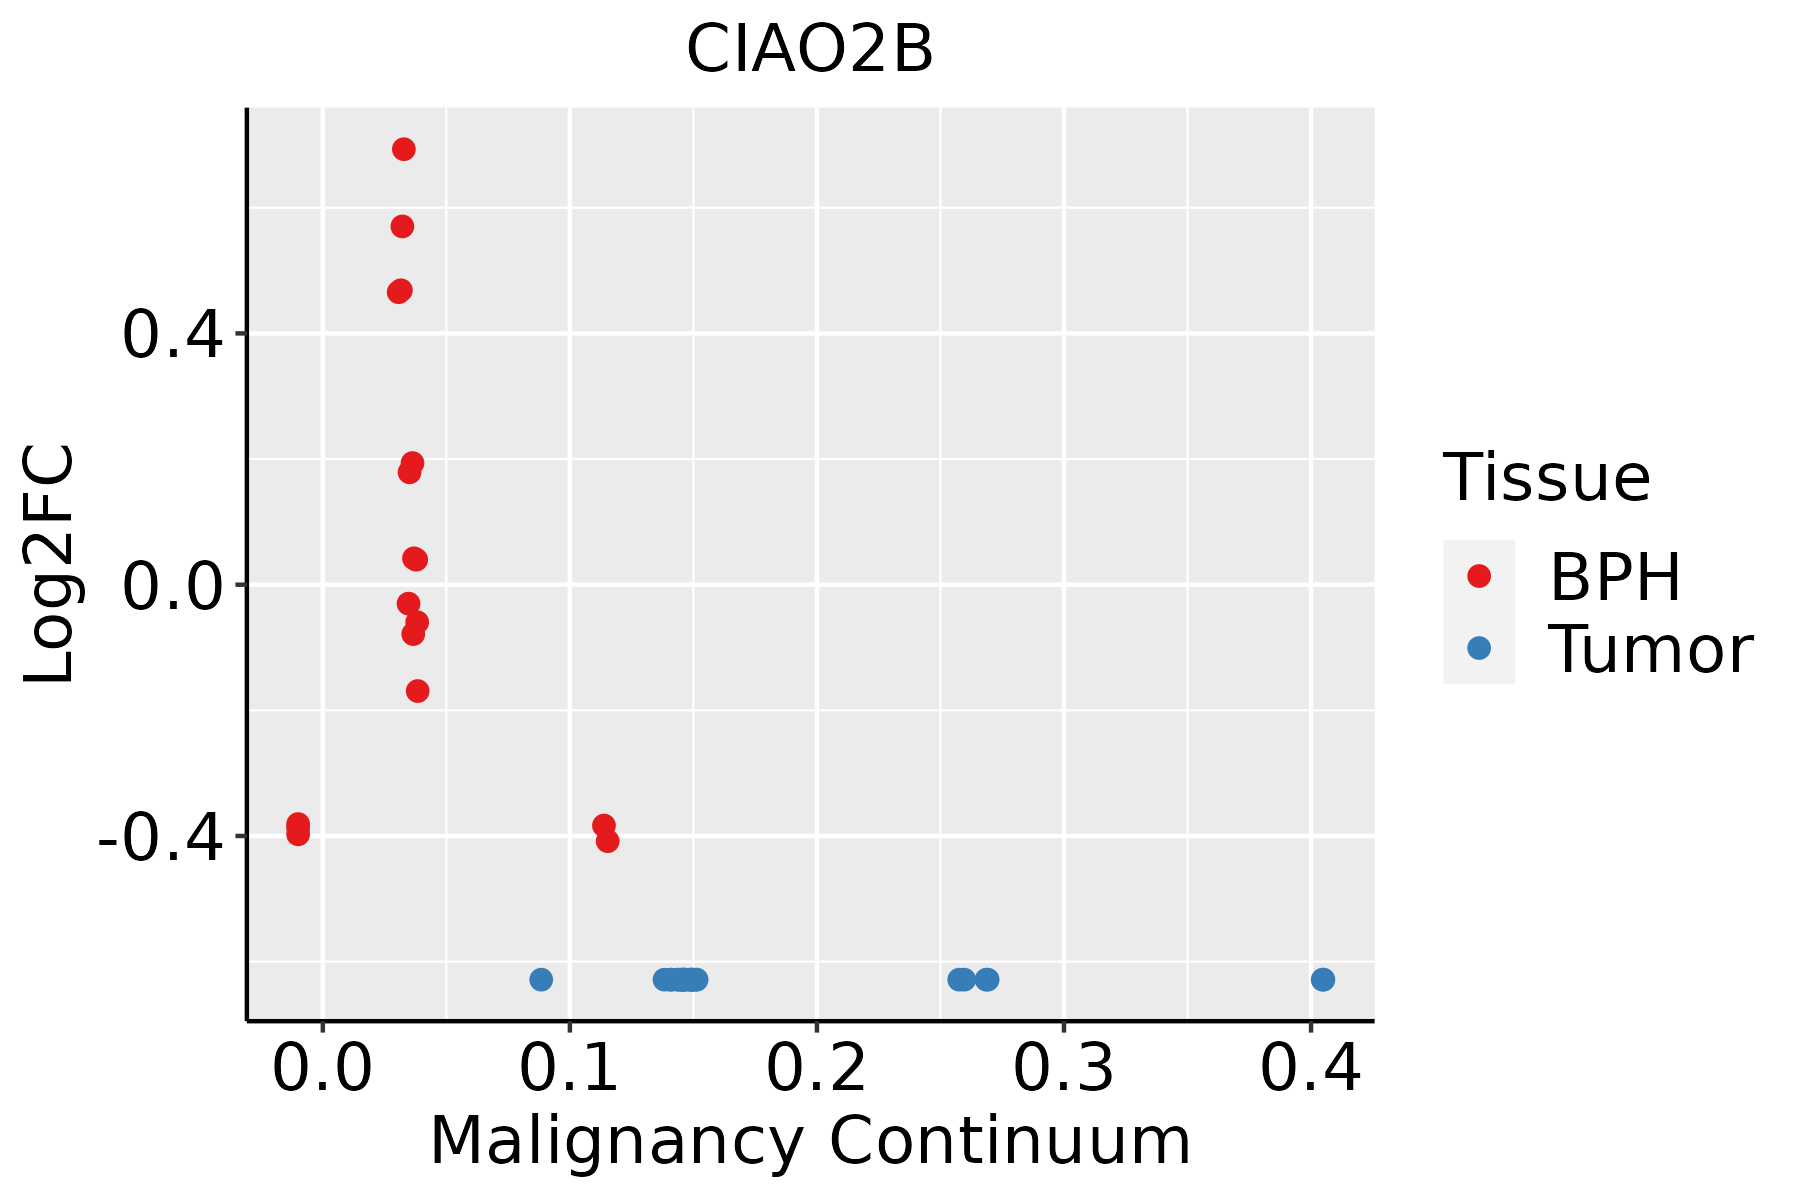 | BPH: Benign Prostatic Hyperplasia |
| Skin |  | AK: Actinic keratosis |
| cSCC: Cutaneous squamous cell carcinoma | ||
| SCCIS:squamous cell carcinoma in situ |
| ∗log2FC in expression of this searched gene in stem-like cells from each diseased tissue sample relative to stem-like cells in normal samples in each tissue plotted against the malignancy continuum. Samples are colored based on if they are from different disease stage. |
Top |
Malignant transformation related pathway analysis |
| Find out the enriched GO biological processes and KEGG pathways involved in transition from healthy to precancer to cancer |
| Tissue | Disease Stage | Enriched GO biological Processes |
| Colorectum | AD |  |
| Colorectum | SER |  |
| Colorectum | MSS |  |
| Colorectum | MSI-H |  |
| Colorectum | FAP |  |
| ∗Top 15 enriched GO BP terms are showed in the bar plot of each disease state in each tissue. Each row represents a significant GO biological process which is colored according to the -log10(p.adjust). |
| Page: 1 2 3 4 5 6 7 8 9 |
| GO ID | Tissue | Disease Stage | Description | Gene Ratio | Bg Ratio | pvalue | p.adjust | Count |
| GO:00516048 | Cervix | CC | protein maturation | 56/2311 | 294/18723 | 5.90e-04 | 5.59e-03 | 56 |
| GO:005160414 | Cervix | N_HPV | protein maturation | 20/534 | 294/18723 | 3.17e-04 | 4.75e-03 | 20 |
| GO:0006790 | Colorectum | AD | sulfur compound metabolic process | 101/3918 | 339/18723 | 6.46e-05 | 1.07e-03 | 101 |
| GO:0051604 | Colorectum | AD | protein maturation | 85/3918 | 294/18723 | 6.73e-04 | 6.91e-03 | 85 |
| GO:00516041 | Colorectum | SER | protein maturation | 73/2897 | 294/18723 | 1.82e-05 | 5.38e-04 | 73 |
| GO:00067901 | Colorectum | SER | sulfur compound metabolic process | 73/2897 | 339/18723 | 1.75e-03 | 1.81e-02 | 73 |
| GO:005160417 | Esophagus | HGIN | protein maturation | 68/2587 | 294/18723 | 9.77e-06 | 2.86e-04 | 68 |
| GO:00070593 | Esophagus | HGIN | chromosome segregation | 71/2587 | 346/18723 | 3.47e-04 | 5.62e-03 | 71 |
| GO:00974282 | Esophagus | HGIN | protein maturation by iron-sulfur cluster transfer | 8/2587 | 16/18723 | 6.00e-04 | 8.41e-03 | 8 |
| GO:00162263 | Esophagus | HGIN | iron-sulfur cluster assembly | 10/2587 | 26/18723 | 1.60e-03 | 1.79e-02 | 10 |
| GO:00311633 | Esophagus | HGIN | metallo-sulfur cluster assembly | 10/2587 | 26/18723 | 1.60e-03 | 1.79e-02 | 10 |
| GO:000705911 | Esophagus | ESCC | chromosome segregation | 238/8552 | 346/18723 | 1.72e-18 | 1.82e-16 | 238 |
| GO:005160418 | Esophagus | ESCC | protein maturation | 189/8552 | 294/18723 | 7.64e-11 | 2.39e-09 | 189 |
| GO:00067906 | Esophagus | ESCC | sulfur compound metabolic process | 201/8552 | 339/18723 | 2.64e-07 | 3.94e-06 | 201 |
| GO:001622611 | Esophagus | ESCC | iron-sulfur cluster assembly | 21/8552 | 26/18723 | 2.69e-04 | 1.63e-03 | 21 |
| GO:003116311 | Esophagus | ESCC | metallo-sulfur cluster assembly | 21/8552 | 26/18723 | 2.69e-04 | 1.63e-03 | 21 |
| GO:009742811 | Esophagus | ESCC | protein maturation by iron-sulfur cluster transfer | 14/8552 | 16/18723 | 6.78e-04 | 3.56e-03 | 14 |
| GO:00516049 | Prostate | BPH | protein maturation | 80/3107 | 294/18723 | 2.64e-06 | 4.23e-05 | 80 |
| GO:005160415 | Prostate | Tumor | protein maturation | 81/3246 | 294/18723 | 7.58e-06 | 1.13e-04 | 81 |
| GO:00070594 | Skin | AK | chromosome segregation | 60/1910 | 346/18723 | 2.88e-05 | 4.98e-04 | 60 |
| Page: 1 2 |
| Pathway ID | Tissue | Disease Stage | Description | Gene Ratio | Bg Ratio | pvalue | p.adjust | qvalue | Count |
| Page: 1 |
Top |
Cell-cell communication analysis |
| Identification of potential cell-cell interactions between two cell types and their ligand-receptor pairs for different disease states |
| Ligand | Receptor | LRpair | Pathway | Tissue | Disease Stage |
| Page: 1 |
Top |
Single-cell gene regulatory network inference analysis |
| Find out the significant the regulons (TFs) and the target genes of each regulon across cell types for different disease states |
| TF | Cell Type | Tissue | Disease Stage | Target Gene | RSS | Regulon Activity |
| ∗The dot plots of a searched regulon are shown for all cell subpopulations in each disease state of each tissue based on the regulon specific score inferred using pySCENIC and by calculating the average expression. |
| Page: 1 |
Top |
Somatic mutation of malignant transformation related genes |
| Annotation of somatic variants for genes involved in malignant transformation |
| Hugo Symbol | Variant Class | Variant Classification | dbSNP RS | HGVSc | HGVSp | HGVSp Short | SWISSPROT | BIOTYPE | SIFT | PolyPhen | Tumor Sample Barcode | Tissue | Histology | Sex | Age | Stage | Therapy Types | Drugs | Outcome |
| Page: 1 |
Top |
Related drugs of malignant transformation related genes |
| Identification of chemicals and drugs interact with genes involved in malignant transfromation |
| (DGIdb 4.0) |
| Entrez ID | Symbol | Category | Interaction Types | Drug Claim Name | Drug Name | PMIDs |
| Page: 1 |

Copyright 2023-Present -The University of Texas Health Science Center at Houston |