
|
|||||
|
 | |
| |
| |
| |
| |
| |
|
Gene: CFAP97 |
Gene summary for CFAP97 |
| Gene information | Species | Human | Gene symbol | CFAP97 | Gene ID | 57587 |
| Gene name | cilia and flagella associated protein 97 | |
| Gene Alias | KIAA1430 | |
| Cytomap | 4q35.1 | |
| Gene Type | protein-coding | GO ID | NA | UniProtAcc | Q9P2B7 |
Top |
Malignant transformation analysis |
| Identification of the aberrant gene expression in precancerous and cancerous lesions by comparing the gene expression of stem-like cells in diseased tissues with normal stem cells |
| Entrez ID | Symbol | Replicates | Species | Organ | Tissue | Adj P-value | Log2FC | Malignancy |
| 57587 | CFAP97 | P48T-E | Human | Esophagus | ESCC | 5.80e-17 | 2.81e-01 | 0.0959 |
| 57587 | CFAP97 | P49T-E | Human | Esophagus | ESCC | 3.65e-15 | 1.43e+00 | 0.1768 |
| 57587 | CFAP97 | P52T-E | Human | Esophagus | ESCC | 1.17e-25 | 5.60e-01 | 0.1555 |
| 57587 | CFAP97 | P54T-E | Human | Esophagus | ESCC | 5.07e-38 | 8.34e-01 | 0.0975 |
| 57587 | CFAP97 | P56T-E | Human | Esophagus | ESCC | 8.15e-08 | 1.33e+00 | 0.1613 |
| 57587 | CFAP97 | P57T-E | Human | Esophagus | ESCC | 2.06e-15 | 3.38e-01 | 0.0926 |
| 57587 | CFAP97 | P61T-E | Human | Esophagus | ESCC | 1.98e-09 | 1.27e-01 | 0.099 |
| 57587 | CFAP97 | P62T-E | Human | Esophagus | ESCC | 1.95e-40 | 7.69e-01 | 0.1302 |
| 57587 | CFAP97 | P65T-E | Human | Esophagus | ESCC | 2.03e-26 | 4.51e-01 | 0.0978 |
| 57587 | CFAP97 | P74T-E | Human | Esophagus | ESCC | 3.00e-26 | 7.94e-01 | 0.1479 |
| 57587 | CFAP97 | P75T-E | Human | Esophagus | ESCC | 2.29e-11 | 2.86e-01 | 0.1125 |
| 57587 | CFAP97 | P76T-E | Human | Esophagus | ESCC | 7.52e-35 | 6.96e-01 | 0.1207 |
| 57587 | CFAP97 | P79T-E | Human | Esophagus | ESCC | 3.73e-24 | 4.91e-01 | 0.1154 |
| 57587 | CFAP97 | P80T-E | Human | Esophagus | ESCC | 1.45e-66 | 2.06e+00 | 0.155 |
| 57587 | CFAP97 | P82T-E | Human | Esophagus | ESCC | 1.04e-11 | 6.58e-01 | 0.1072 |
| 57587 | CFAP97 | P83T-E | Human | Esophagus | ESCC | 7.82e-48 | 1.24e+00 | 0.1738 |
| 57587 | CFAP97 | P89T-E | Human | Esophagus | ESCC | 1.48e-12 | 8.38e-01 | 0.1752 |
| 57587 | CFAP97 | P91T-E | Human | Esophagus | ESCC | 1.78e-12 | 1.40e+00 | 0.1828 |
| 57587 | CFAP97 | P107T-E | Human | Esophagus | ESCC | 1.36e-32 | 6.28e-01 | 0.171 |
| 57587 | CFAP97 | P126T-E | Human | Esophagus | ESCC | 1.07e-07 | 5.34e-01 | 0.1125 |
| Page: 1 2 3 4 5 6 |
| Tissue | Expression Dynamics | Abbreviation |
| Esophagus | 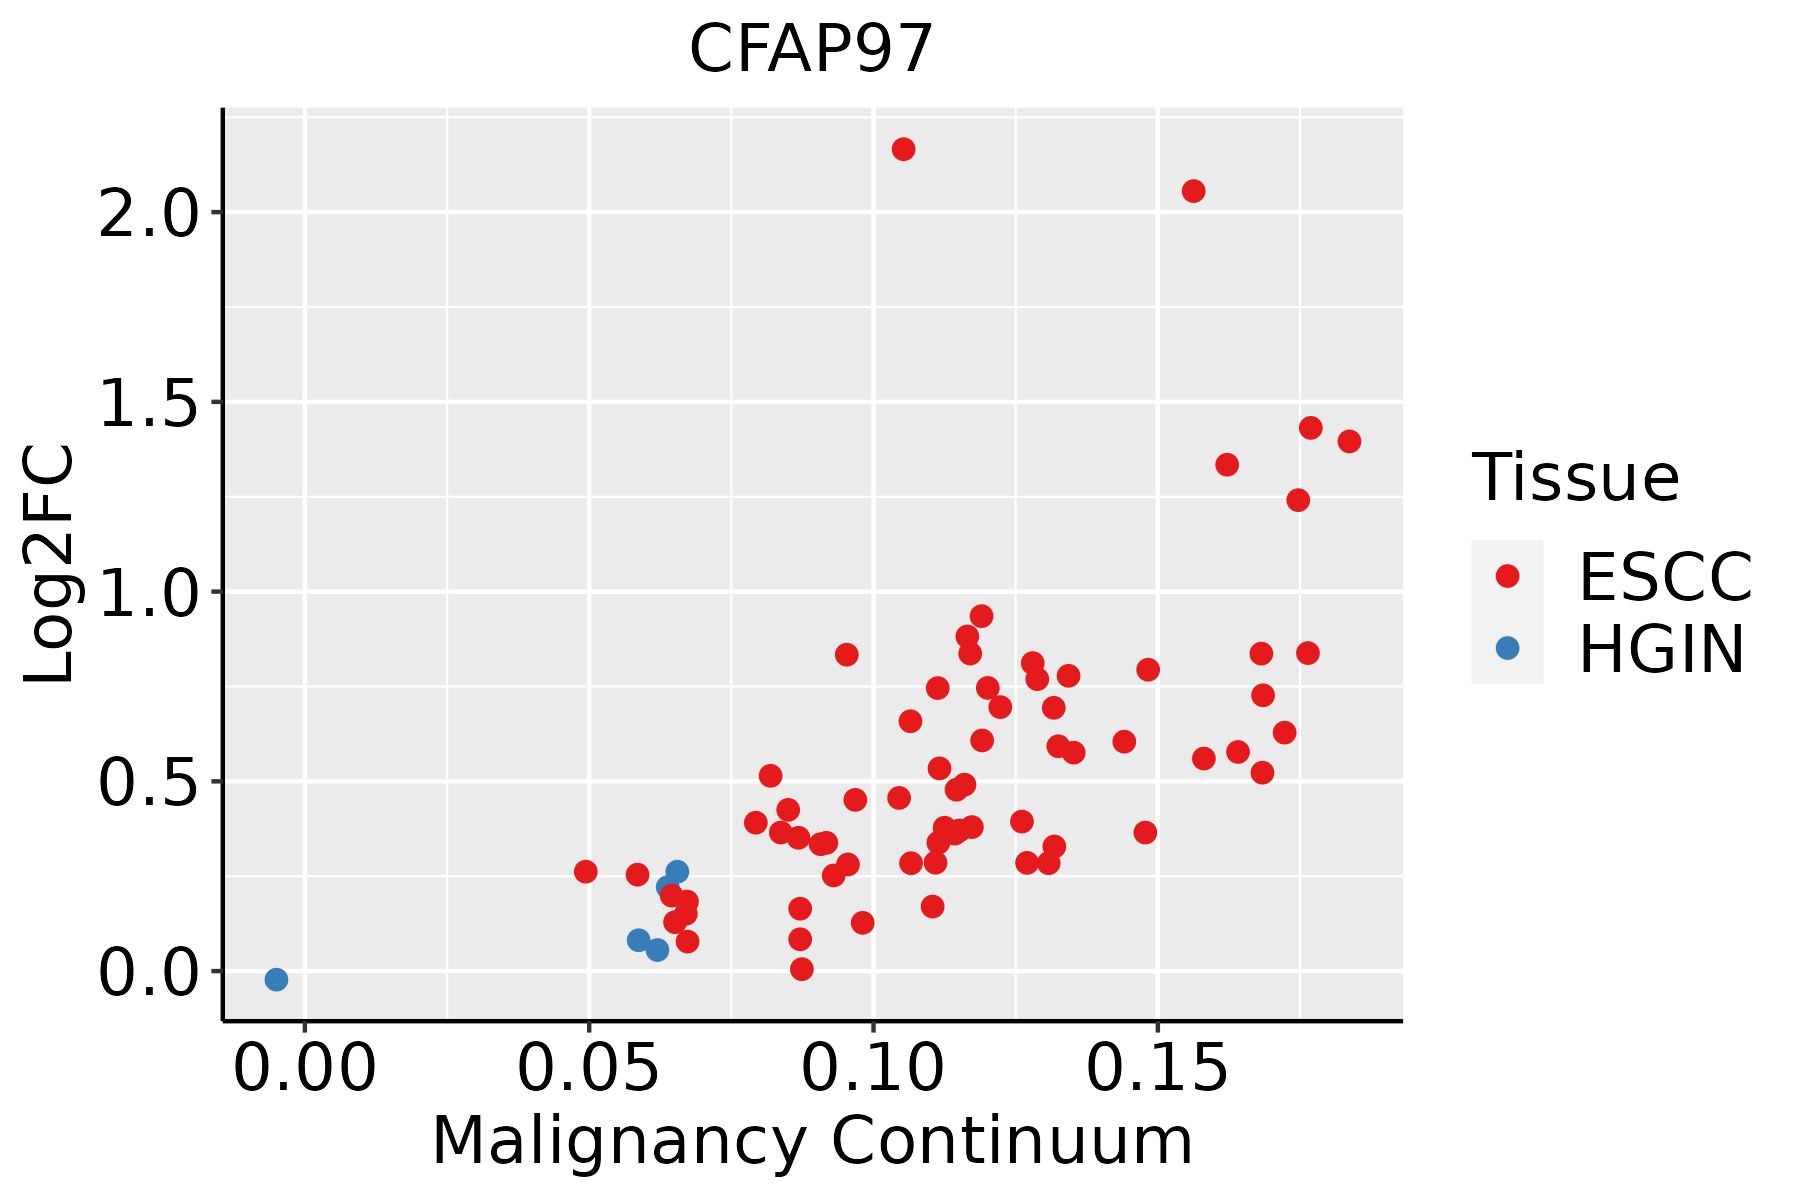 | ESCC: Esophageal squamous cell carcinoma |
| HGIN: High-grade intraepithelial neoplasias | ||
| LGIN: Low-grade intraepithelial neoplasias | ||
| Liver |  | HCC: Hepatocellular carcinoma |
| NAFLD: Non-alcoholic fatty liver disease | ||
| Oral Cavity |  | EOLP: Erosive Oral lichen planus |
| LP: leukoplakia | ||
| NEOLP: Non-erosive oral lichen planus | ||
| OSCC: Oral squamous cell carcinoma | ||
| Thyroid | 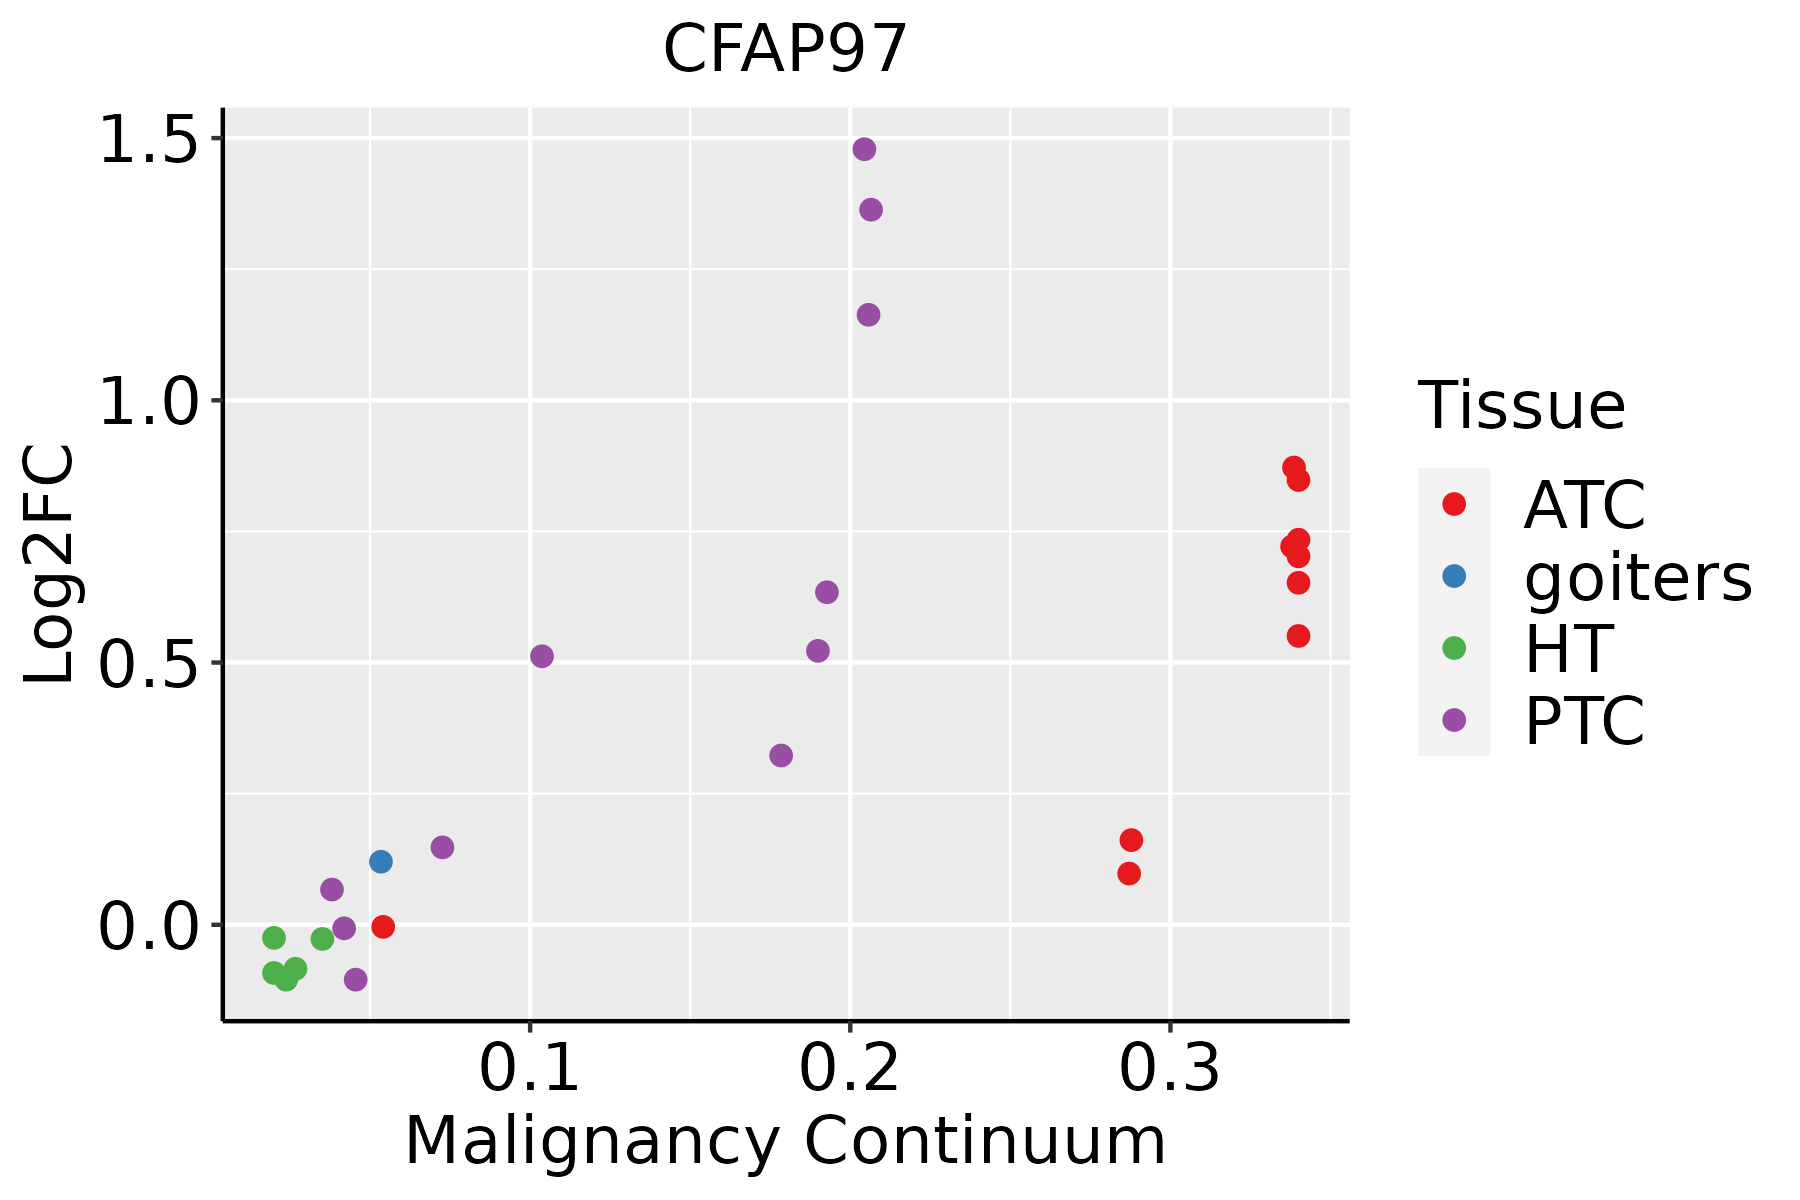 | ATC: Anaplastic thyroid cancer |
| HT: Hashimoto's thyroiditis | ||
| PTC: Papillary thyroid cancer |
| ∗log2FC in expression of this searched gene in stem-like cells from each diseased tissue sample relative to stem-like cells in normal samples in each tissue plotted against the malignancy continuum. Samples are colored based on if they are from different disease stage. |
Top |
Malignant transformation related pathway analysis |
| Find out the enriched GO biological processes and KEGG pathways involved in transition from healthy to precancer to cancer |
| Tissue | Disease Stage | Enriched GO biological Processes |
| Colorectum | AD |  |
| Colorectum | SER |  |
| Colorectum | MSS |  |
| Colorectum | MSI-H |  |
| Colorectum | FAP |  |
| ∗Top 15 enriched GO BP terms are showed in the bar plot of each disease state in each tissue. Each row represents a significant GO biological process which is colored according to the -log10(p.adjust). |
| Page: 1 2 3 4 5 6 7 8 9 |
| GO ID | Tissue | Disease Stage | Description | Gene Ratio | Bg Ratio | pvalue | p.adjust | Count |
| Page: 1 |
| Pathway ID | Tissue | Disease Stage | Description | Gene Ratio | Bg Ratio | pvalue | p.adjust | qvalue | Count |
| Page: 1 |
Top |
Cell-cell communication analysis |
| Identification of potential cell-cell interactions between two cell types and their ligand-receptor pairs for different disease states |
| Ligand | Receptor | LRpair | Pathway | Tissue | Disease Stage |
| Page: 1 |
Top |
Single-cell gene regulatory network inference analysis |
| Find out the significant the regulons (TFs) and the target genes of each regulon across cell types for different disease states |
| TF | Cell Type | Tissue | Disease Stage | Target Gene | RSS | Regulon Activity |
| ∗The dot plots of a searched regulon are shown for all cell subpopulations in each disease state of each tissue based on the regulon specific score inferred using pySCENIC and by calculating the average expression. |
| Page: 1 |
Top |
Somatic mutation of malignant transformation related genes |
| Annotation of somatic variants for genes involved in malignant transformation |
| Hugo Symbol | Variant Class | Variant Classification | dbSNP RS | HGVSc | HGVSp | HGVSp Short | SWISSPROT | BIOTYPE | SIFT | PolyPhen | Tumor Sample Barcode | Tissue | Histology | Sex | Age | Stage | Therapy Types | Drugs | Outcome |
| CFAP97 | SNV | Missense_Mutation | rs781085964 | c.1205C>T | p.Ala402Val | p.A402V | Q9P2B7 | protein_coding | deleterious(0) | probably_damaging(0.991) | TCGA-AN-A046-01 | Breast | breast invasive carcinoma | Female | >=65 | I/II | Unknown | Unknown | SD |
| CFAP97 | SNV | Missense_Mutation | c.615N>T | p.Lys205Asn | p.K205N | Q9P2B7 | protein_coding | tolerated(0.32) | benign(0.001) | TCGA-D8-A27W-01 | Breast | breast invasive carcinoma | Female | <65 | III/IV | Chemotherapy | doxorubicine+cyclophosphamide | SD | |
| CFAP97 | SNV | Missense_Mutation | c.608N>T | p.Ser203Leu | p.S203L | Q9P2B7 | protein_coding | tolerated(0.1) | benign(0.036) | TCGA-E2-A14V-01 | Breast | breast invasive carcinoma | Female | <65 | I/II | Chemotherapy | cyclophosphamide | SD | |
| CFAP97 | insertion | Nonsense_Mutation | novel | c.825_826insCATTCCCAACAATAAAAAATATCTACTA | p.Asp276HisfsTer5 | p.D276Hfs*5 | Q9P2B7 | protein_coding | TCGA-AR-A0U0-01 | Breast | breast invasive carcinoma | Female | >=65 | I/II | Unknown | Unknown | SD | ||
| CFAP97 | SNV | Missense_Mutation | rs373566490 | c.158N>T | p.Ser53Leu | p.S53L | Q9P2B7 | protein_coding | tolerated(0.61) | benign(0) | TCGA-FU-A3HZ-01 | Cervix | cervical & endocervical cancer | Female | <65 | I/II | Chemotherapy | cisplatin | CR |
| CFAP97 | SNV | Missense_Mutation | rs777547282 | c.1397N>A | p.Arg466His | p.R466H | Q9P2B7 | protein_coding | deleterious(0) | probably_damaging(0.997) | TCGA-AA-3672-01 | Colorectum | colon adenocarcinoma | Female | >=65 | III/IV | Unknown | Unknown | SD |
| CFAP97 | SNV | Missense_Mutation | c.775N>C | p.Ser259Pro | p.S259P | Q9P2B7 | protein_coding | deleterious(0) | probably_damaging(0.95) | TCGA-AA-3672-01 | Colorectum | colon adenocarcinoma | Female | >=65 | III/IV | Unknown | Unknown | SD | |
| CFAP97 | SNV | Missense_Mutation | c.53N>G | p.Asp18Gly | p.D18G | Q9P2B7 | protein_coding | deleterious(0) | probably_damaging(0.984) | TCGA-AA-A010-01 | Colorectum | colon adenocarcinoma | Female | <65 | I/II | Chemotherapy | folinic | CR | |
| CFAP97 | SNV | Missense_Mutation | novel | c.1069N>A | p.Asp357Asn | p.D357N | Q9P2B7 | protein_coding | tolerated(0.11) | probably_damaging(0.911) | TCGA-CA-6717-01 | Colorectum | colon adenocarcinoma | Male | <65 | I/II | Chemotherapy | oxaliplatin | CR |
| CFAP97 | SNV | Missense_Mutation | novel | c.495N>T | p.Lys165Asn | p.K165N | Q9P2B7 | protein_coding | deleterious(0.01) | benign(0.071) | TCGA-CA-6717-01 | Colorectum | colon adenocarcinoma | Male | <65 | I/II | Chemotherapy | oxaliplatin | CR |
| Page: 1 2 3 4 5 |
Top |
Related drugs of malignant transformation related genes |
| Identification of chemicals and drugs interact with genes involved in malignant transfromation |
| (DGIdb 4.0) |
| Entrez ID | Symbol | Category | Interaction Types | Drug Claim Name | Drug Name | PMIDs |
| Page: 1 |

Copyright 2023-Present -The University of Texas Health Science Center at Houston |