
|
|||||
|
 | |
| |
| |
| |
| |
| |
|
Gene: CERS5 |
Gene summary for CERS5 |
| Gene information | Species | Human | Gene symbol | CERS5 | Gene ID | 91012 |
| Gene name | ceramide synthase 5 | |
| Gene Alias | LASS5 | |
| Cytomap | 12q13.12 | |
| Gene Type | protein-coding | GO ID | GO:0006629 | UniProtAcc | Q8N5B7 |
Top |
Malignant transformation analysis |
| Identification of the aberrant gene expression in precancerous and cancerous lesions by comparing the gene expression of stem-like cells in diseased tissues with normal stem cells |
| Entrez ID | Symbol | Replicates | Species | Organ | Tissue | Adj P-value | Log2FC | Malignancy |
| 91012 | CERS5 | P52T-E | Human | Esophagus | ESCC | 2.75e-16 | 2.81e-01 | 0.1555 |
| 91012 | CERS5 | P54T-E | Human | Esophagus | ESCC | 9.09e-18 | 2.94e-01 | 0.0975 |
| 91012 | CERS5 | P56T-E | Human | Esophagus | ESCC | 3.22e-08 | 8.46e-01 | 0.1613 |
| 91012 | CERS5 | P57T-E | Human | Esophagus | ESCC | 1.09e-18 | 2.43e-01 | 0.0926 |
| 91012 | CERS5 | P61T-E | Human | Esophagus | ESCC | 1.41e-21 | 4.80e-01 | 0.099 |
| 91012 | CERS5 | P62T-E | Human | Esophagus | ESCC | 1.94e-43 | 6.01e-01 | 0.1302 |
| 91012 | CERS5 | P65T-E | Human | Esophagus | ESCC | 4.35e-23 | 9.86e-02 | 0.0978 |
| 91012 | CERS5 | P74T-E | Human | Esophagus | ESCC | 1.24e-24 | 5.58e-01 | 0.1479 |
| 91012 | CERS5 | P75T-E | Human | Esophagus | ESCC | 4.32e-26 | 5.41e-01 | 0.1125 |
| 91012 | CERS5 | P76T-E | Human | Esophagus | ESCC | 3.18e-18 | 3.00e-01 | 0.1207 |
| 91012 | CERS5 | P79T-E | Human | Esophagus | ESCC | 4.33e-19 | 3.28e-01 | 0.1154 |
| 91012 | CERS5 | P80T-E | Human | Esophagus | ESCC | 4.07e-18 | 4.46e-01 | 0.155 |
| 91012 | CERS5 | P82T-E | Human | Esophagus | ESCC | 1.41e-08 | 4.76e-01 | 0.1072 |
| 91012 | CERS5 | P83T-E | Human | Esophagus | ESCC | 9.12e-30 | 5.32e-01 | 0.1738 |
| 91012 | CERS5 | P84T-E | Human | Esophagus | ESCC | 3.55e-07 | 2.18e-01 | 0.0933 |
| 91012 | CERS5 | P89T-E | Human | Esophagus | ESCC | 8.57e-20 | 1.23e+00 | 0.1752 |
| 91012 | CERS5 | P91T-E | Human | Esophagus | ESCC | 1.01e-11 | 7.94e-01 | 0.1828 |
| 91012 | CERS5 | P107T-E | Human | Esophagus | ESCC | 5.57e-25 | 4.17e-01 | 0.171 |
| 91012 | CERS5 | P126T-E | Human | Esophagus | ESCC | 1.96e-07 | 2.95e-01 | 0.1125 |
| 91012 | CERS5 | P127T-E | Human | Esophagus | ESCC | 1.12e-18 | 6.27e-02 | 0.0826 |
| Page: 1 2 3 4 5 6 |
| Tissue | Expression Dynamics | Abbreviation |
| Esophagus | 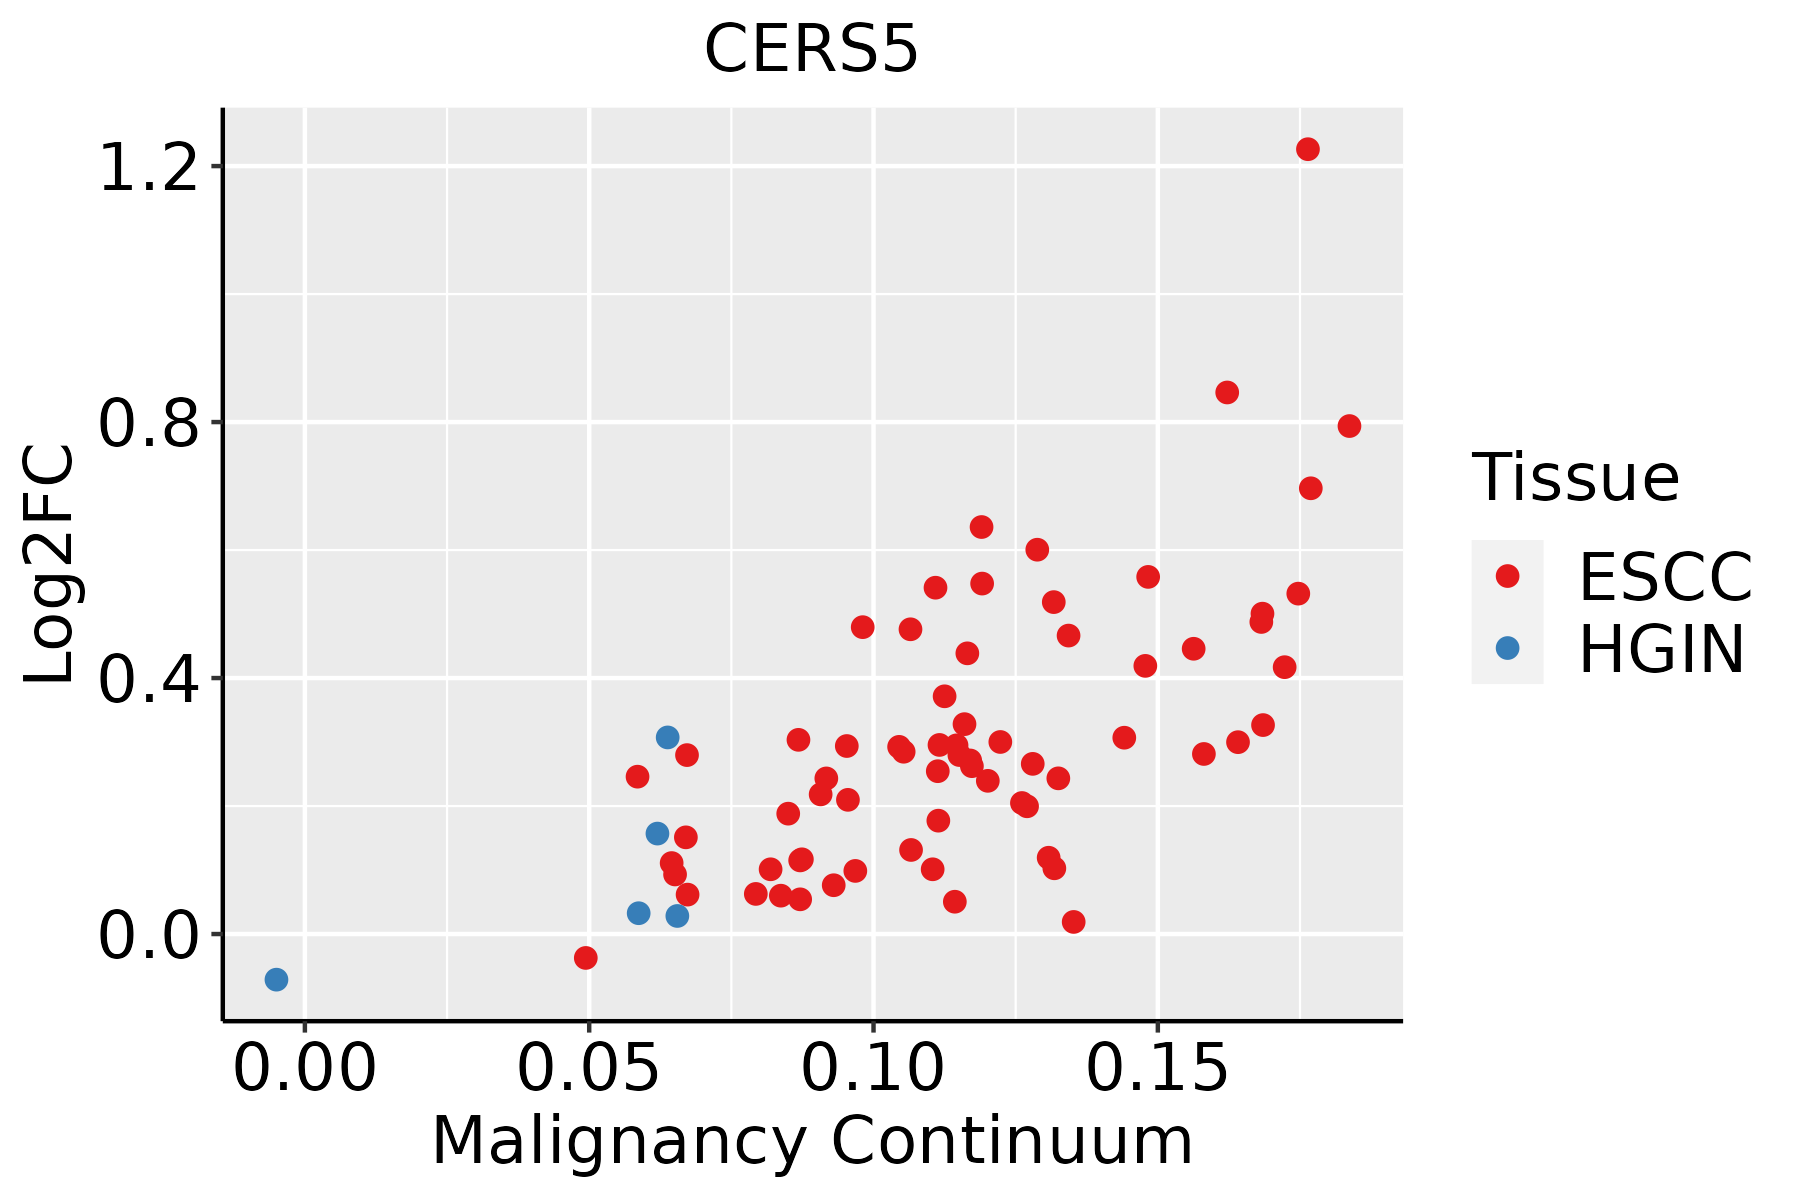 | ESCC: Esophageal squamous cell carcinoma |
| HGIN: High-grade intraepithelial neoplasias | ||
| LGIN: Low-grade intraepithelial neoplasias | ||
| Liver | 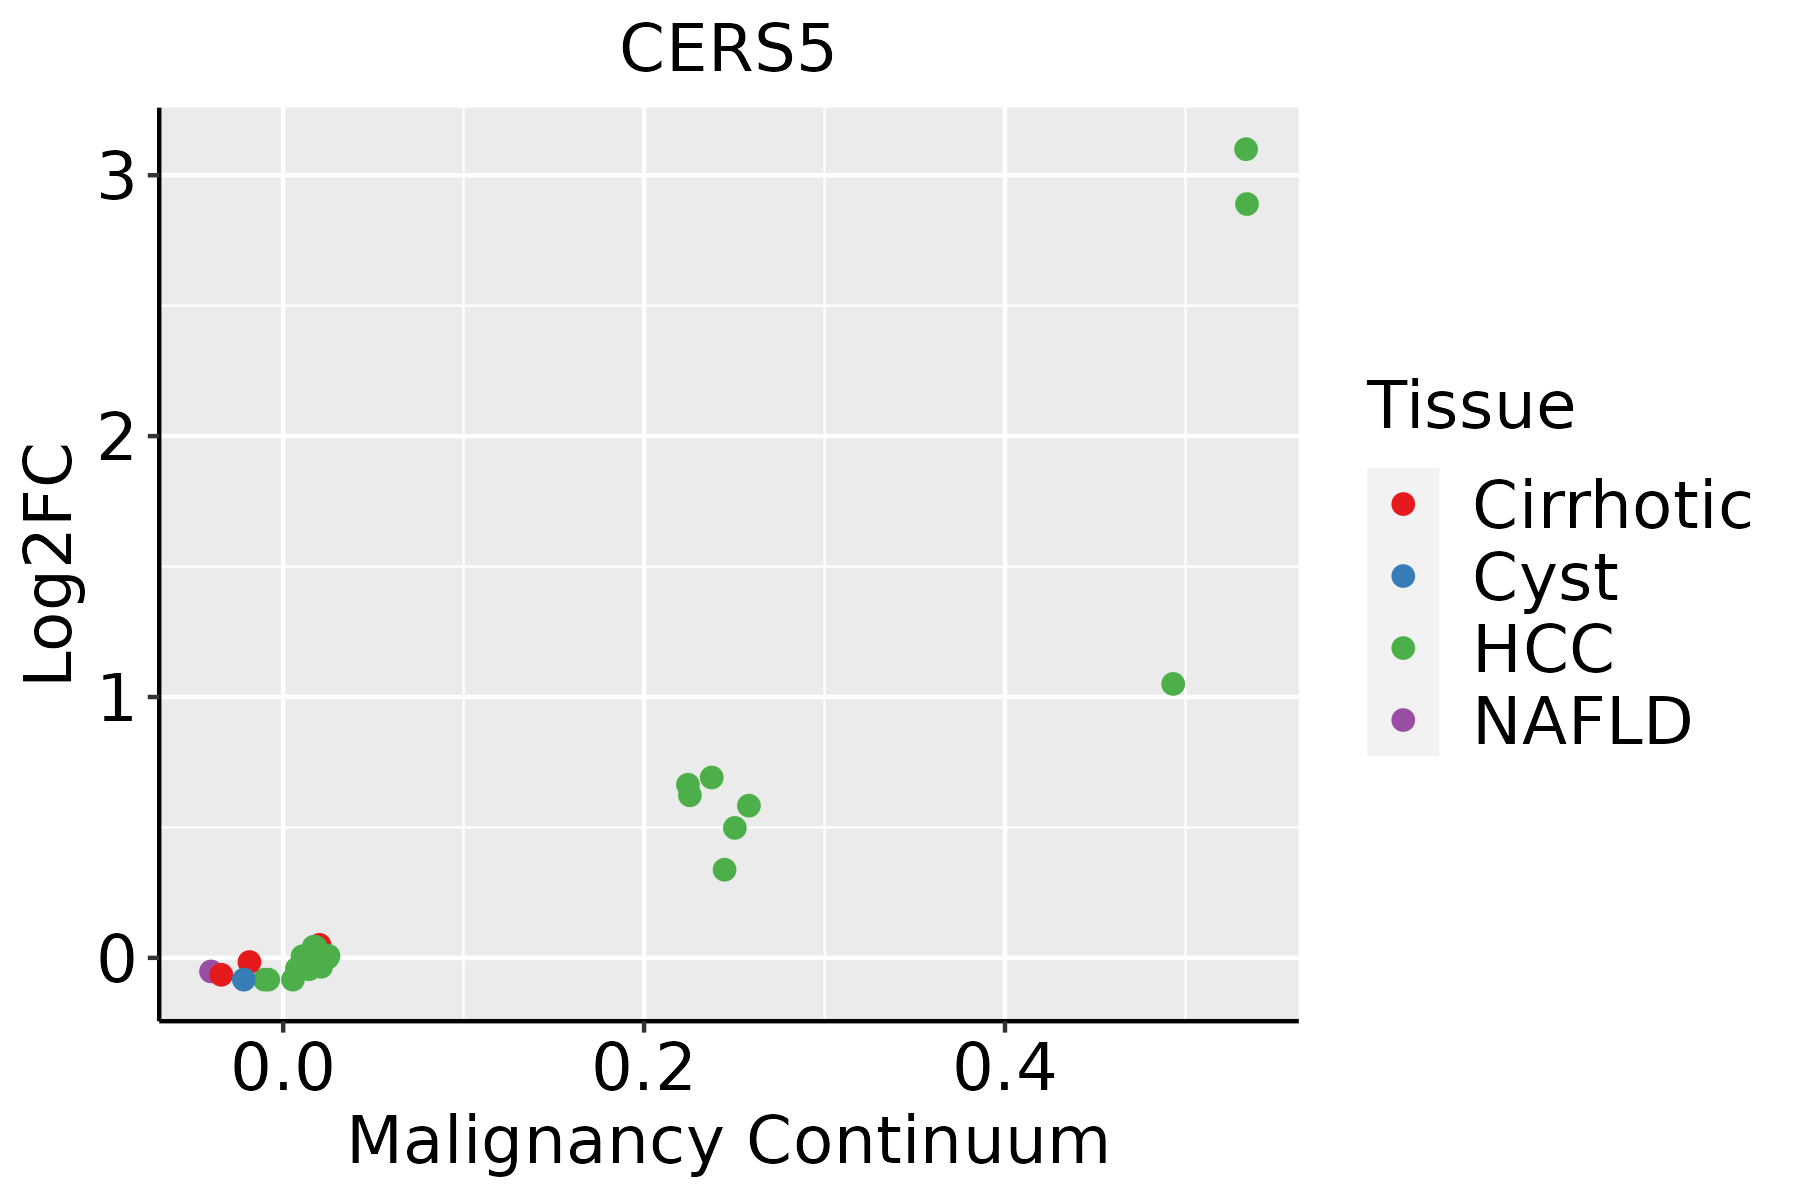 | HCC: Hepatocellular carcinoma |
| NAFLD: Non-alcoholic fatty liver disease | ||
| Oral Cavity | 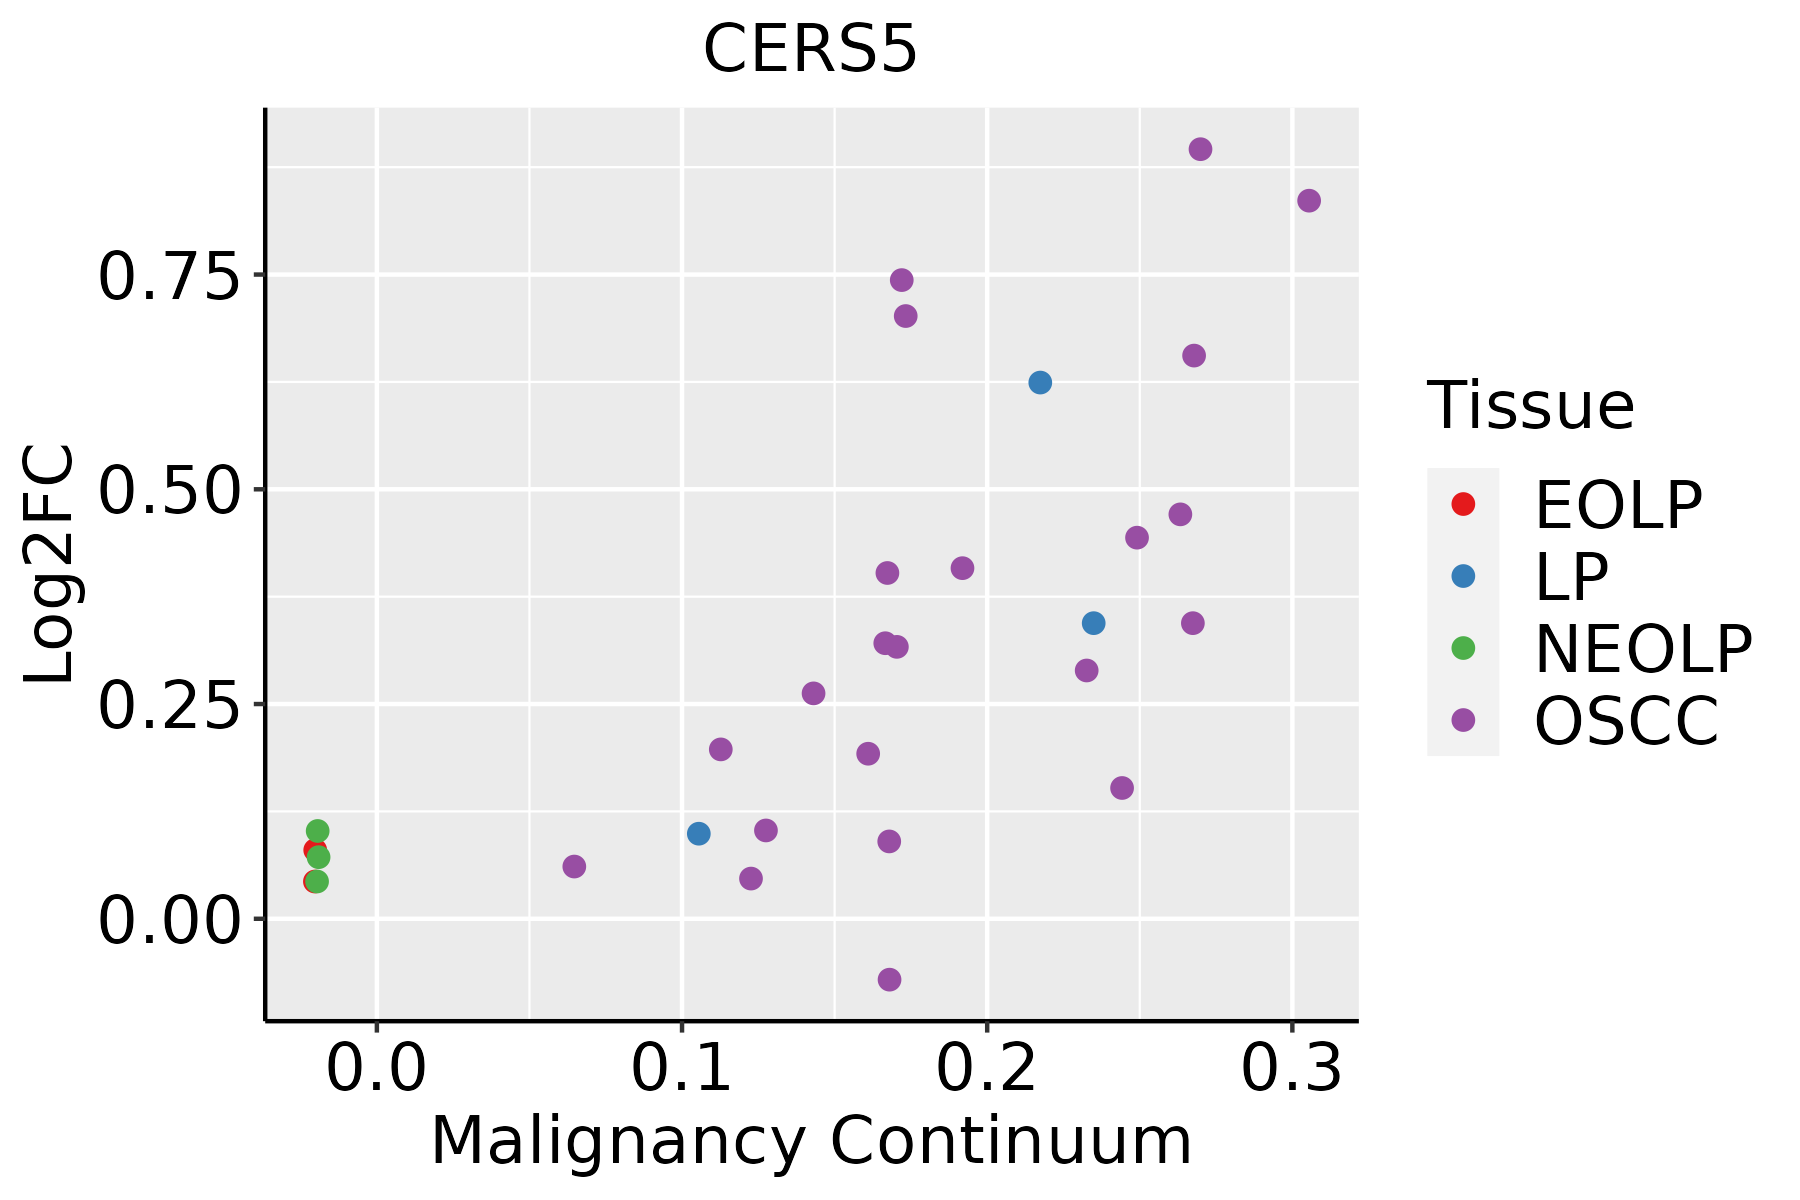 | EOLP: Erosive Oral lichen planus |
| LP: leukoplakia | ||
| NEOLP: Non-erosive oral lichen planus | ||
| OSCC: Oral squamous cell carcinoma | ||
| Thyroid | 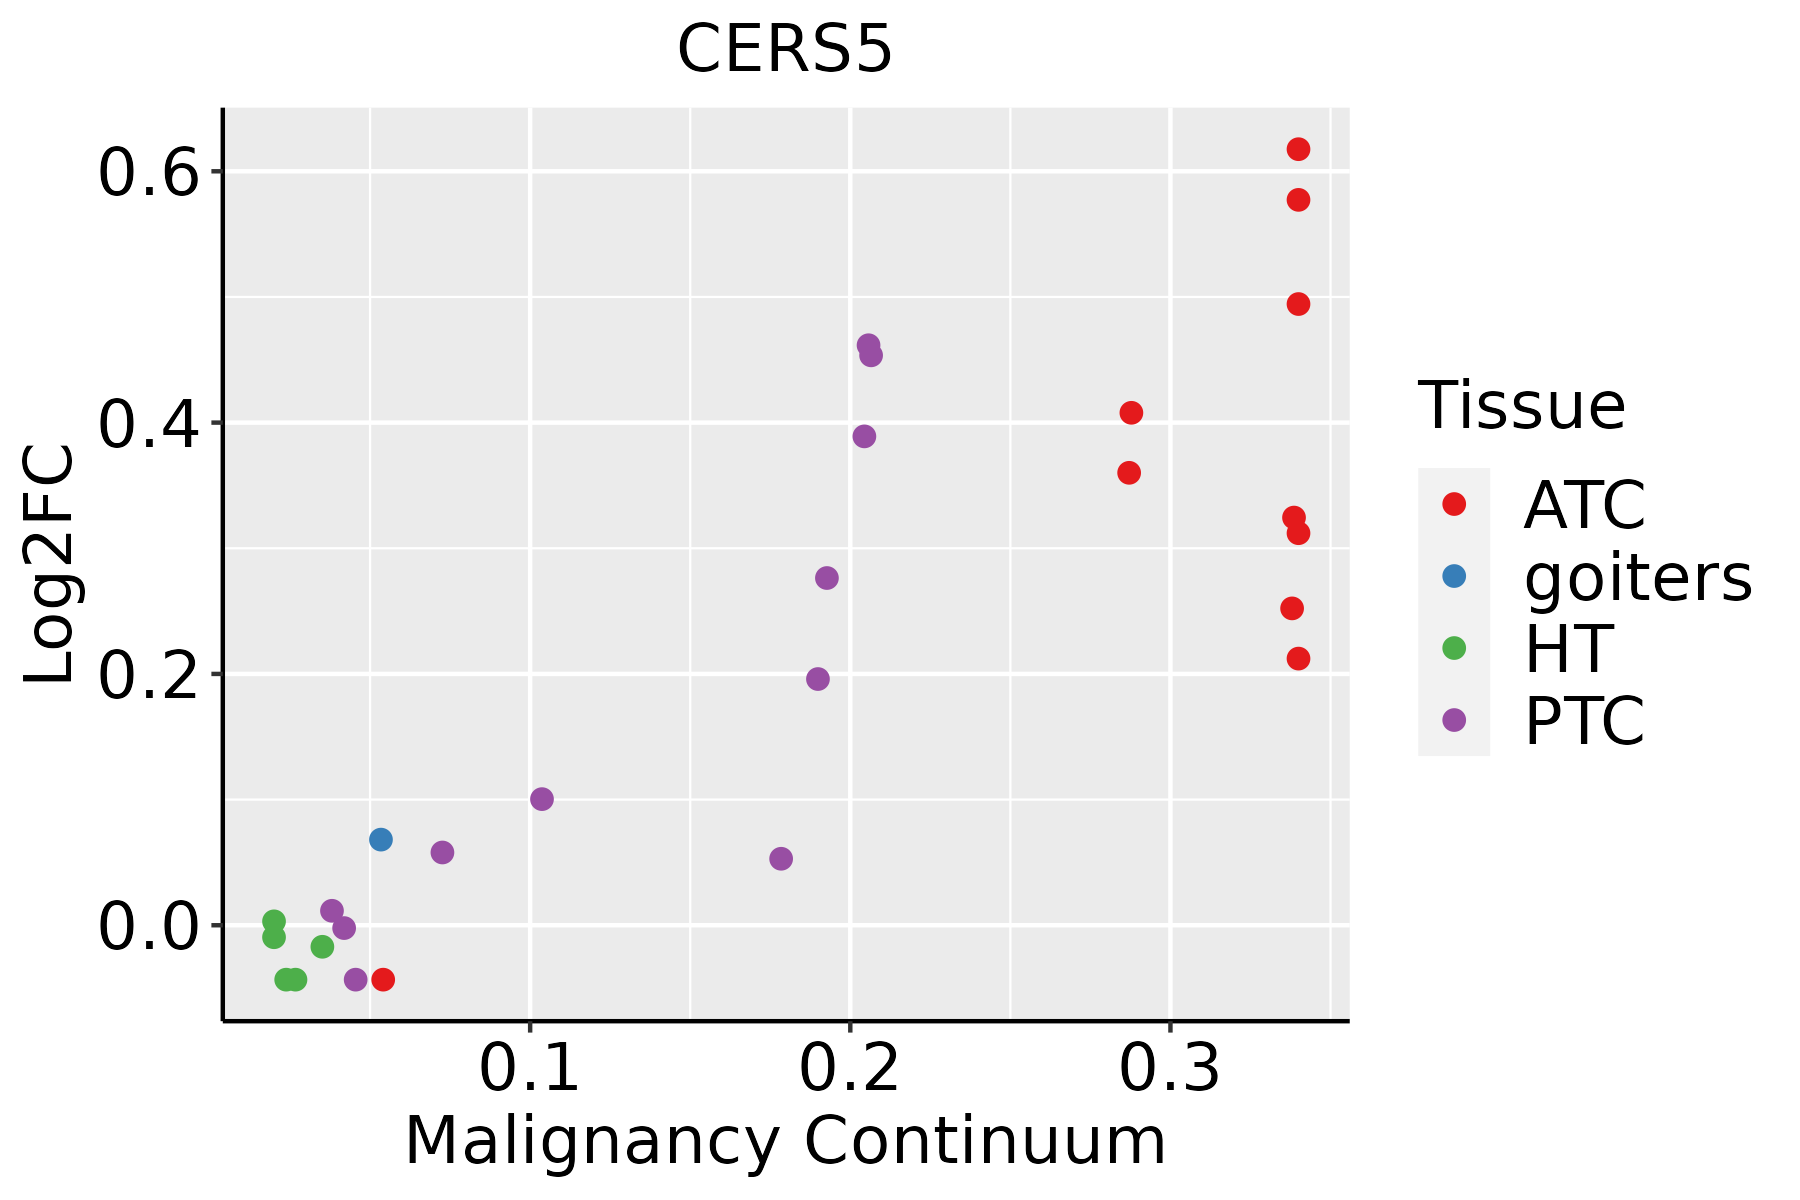 | ATC: Anaplastic thyroid cancer |
| HT: Hashimoto's thyroiditis | ||
| PTC: Papillary thyroid cancer |
| ∗log2FC in expression of this searched gene in stem-like cells from each diseased tissue sample relative to stem-like cells in normal samples in each tissue plotted against the malignancy continuum. Samples are colored based on if they are from different disease stage. |
Top |
Malignant transformation related pathway analysis |
| Find out the enriched GO biological processes and KEGG pathways involved in transition from healthy to precancer to cancer |
| Tissue | Disease Stage | Enriched GO biological Processes |
| Colorectum | AD |  |
| Colorectum | SER |  |
| Colorectum | MSS |  |
| Colorectum | MSI-H |  |
| Colorectum | FAP |  |
| ∗Top 15 enriched GO BP terms are showed in the bar plot of each disease state in each tissue. Each row represents a significant GO biological process which is colored according to the -log10(p.adjust). |
| Page: 1 2 3 4 5 6 7 8 9 |
| GO ID | Tissue | Disease Stage | Description | Gene Ratio | Bg Ratio | pvalue | p.adjust | Count |
| GO:00066433 | Esophagus | ESCC | membrane lipid metabolic process | 130/8552 | 203/18723 | 9.29e-08 | 1.54e-06 | 130 |
| GO:00464673 | Esophagus | ESCC | membrane lipid biosynthetic process | 91/8552 | 142/18723 | 7.19e-06 | 7.19e-05 | 91 |
| GO:00066652 | Esophagus | ESCC | sphingolipid metabolic process | 96/8552 | 155/18723 | 3.21e-05 | 2.66e-04 | 96 |
| GO:00301481 | Esophagus | ESCC | sphingolipid biosynthetic process | 62/8552 | 103/18723 | 2.10e-03 | 9.38e-03 | 62 |
| GO:00066721 | Esophagus | ESCC | ceramide metabolic process | 61/8552 | 102/18723 | 2.82e-03 | 1.19e-02 | 61 |
| GO:0046513 | Esophagus | ESCC | ceramide biosynthetic process | 40/8552 | 65/18723 | 7.25e-03 | 2.63e-02 | 40 |
| GO:00066431 | Liver | HCC | membrane lipid metabolic process | 115/7958 | 203/18723 | 3.17e-05 | 3.22e-04 | 115 |
| GO:0006665 | Liver | HCC | sphingolipid metabolic process | 85/7958 | 155/18723 | 1.27e-03 | 6.92e-03 | 85 |
| GO:0046467 | Liver | HCC | membrane lipid biosynthetic process | 78/7958 | 142/18723 | 1.85e-03 | 9.46e-03 | 78 |
| GO:00066432 | Oral cavity | OSCC | membrane lipid metabolic process | 111/7305 | 203/18723 | 4.02e-06 | 4.69e-05 | 111 |
| GO:00066651 | Oral cavity | OSCC | sphingolipid metabolic process | 84/7305 | 155/18723 | 8.64e-05 | 6.61e-04 | 84 |
| GO:00464672 | Oral cavity | OSCC | membrane lipid biosynthetic process | 77/7305 | 142/18723 | 1.63e-04 | 1.13e-03 | 77 |
| GO:0006672 | Oral cavity | OSCC | ceramide metabolic process | 53/7305 | 102/18723 | 5.28e-03 | 2.06e-02 | 53 |
| GO:0030148 | Oral cavity | OSCC | sphingolipid biosynthetic process | 53/7305 | 103/18723 | 6.81e-03 | 2.53e-02 | 53 |
| Page: 1 |
| Pathway ID | Tissue | Disease Stage | Description | Gene Ratio | Bg Ratio | pvalue | p.adjust | qvalue | Count |
| hsa0407116 | Esophagus | ESCC | Sphingolipid signaling pathway | 85/4205 | 121/8465 | 3.04e-06 | 1.73e-05 | 8.84e-06 | 85 |
| hsa006003 | Esophagus | ESCC | Sphingolipid metabolism | 36/4205 | 53/8465 | 5.41e-03 | 1.36e-02 | 6.99e-03 | 36 |
| hsa0407117 | Esophagus | ESCC | Sphingolipid signaling pathway | 85/4205 | 121/8465 | 3.04e-06 | 1.73e-05 | 8.84e-06 | 85 |
| hsa0060012 | Esophagus | ESCC | Sphingolipid metabolism | 36/4205 | 53/8465 | 5.41e-03 | 1.36e-02 | 6.99e-03 | 36 |
| hsa040718 | Liver | HCC | Sphingolipid signaling pathway | 72/4020 | 121/8465 | 5.01e-03 | 1.47e-02 | 8.18e-03 | 72 |
| hsa00600 | Liver | HCC | Sphingolipid metabolism | 34/4020 | 53/8465 | 1.06e-02 | 2.71e-02 | 1.51e-02 | 34 |
| hsa0407111 | Liver | HCC | Sphingolipid signaling pathway | 72/4020 | 121/8465 | 5.01e-03 | 1.47e-02 | 8.18e-03 | 72 |
| hsa006001 | Liver | HCC | Sphingolipid metabolism | 34/4020 | 53/8465 | 1.06e-02 | 2.71e-02 | 1.51e-02 | 34 |
| hsa0407114 | Oral cavity | OSCC | Sphingolipid signaling pathway | 82/3704 | 121/8465 | 6.97e-08 | 5.08e-07 | 2.58e-07 | 82 |
| hsa006002 | Oral cavity | OSCC | Sphingolipid metabolism | 33/3704 | 53/8465 | 5.00e-03 | 1.20e-02 | 6.13e-03 | 33 |
| hsa0407115 | Oral cavity | OSCC | Sphingolipid signaling pathway | 82/3704 | 121/8465 | 6.97e-08 | 5.08e-07 | 2.58e-07 | 82 |
| hsa0060011 | Oral cavity | OSCC | Sphingolipid metabolism | 33/3704 | 53/8465 | 5.00e-03 | 1.20e-02 | 6.13e-03 | 33 |
| hsa0407141 | Oral cavity | EOLP | Sphingolipid signaling pathway | 44/1218 | 121/8465 | 1.19e-09 | 3.51e-08 | 2.07e-08 | 44 |
| hsa0407151 | Oral cavity | EOLP | Sphingolipid signaling pathway | 44/1218 | 121/8465 | 1.19e-09 | 3.51e-08 | 2.07e-08 | 44 |
| Page: 1 |
Top |
Cell-cell communication analysis |
| Identification of potential cell-cell interactions between two cell types and their ligand-receptor pairs for different disease states |
| Ligand | Receptor | LRpair | Pathway | Tissue | Disease Stage |
| Page: 1 |
Top |
Single-cell gene regulatory network inference analysis |
| Find out the significant the regulons (TFs) and the target genes of each regulon across cell types for different disease states |
| TF | Cell Type | Tissue | Disease Stage | Target Gene | RSS | Regulon Activity |
| CERS5 | TREG | Cervix | ADJ | ALOX5AP,AC074032.1,FCER1G, etc. | 1.50e-02 |  |
| CERS5 | PLA | Cervix | N_HPV | ALOX5AP,AC074032.1,FCER1G, etc. | 1.27e-02 |  |
| CERS5 | TREG | Oral cavity | ADJ | AC074032.1,BZRAP1,VMO1, etc. | 4.06e-02 |  |
| CERS5 | TREG | Oral cavity | Healthy | AC074032.1,BZRAP1,VMO1, etc. | 5.92e-02 |  |
| CERS5 | CD8TEX | Oral cavity | NEOLP | AC074032.1,BZRAP1,VMO1, etc. | 1.03e-02 |  |
| ∗The dot plots of a searched regulon are shown for all cell subpopulations in each disease state of each tissue based on the regulon specific score inferred using pySCENIC and by calculating the average expression. |
| Page: 1 |
Top |
Somatic mutation of malignant transformation related genes |
| Annotation of somatic variants for genes involved in malignant transformation |
| Hugo Symbol | Variant Class | Variant Classification | dbSNP RS | HGVSc | HGVSp | HGVSp Short | SWISSPROT | BIOTYPE | SIFT | PolyPhen | Tumor Sample Barcode | Tissue | Histology | Sex | Age | Stage | Therapy Types | Drugs | Outcome |
| CERS5 | SNV | Missense_Mutation | c.484N>T | p.Leu162Phe | p.L162F | Q8N5B7 | protein_coding | deleterious(0) | probably_damaging(0.927) | TCGA-5L-AAT0-01 | Breast | breast invasive carcinoma | Female | <65 | I/II | Hormone Therapy | tamoxiphen | SD | |
| CERS5 | SNV | Missense_Mutation | c.1017N>T | p.Leu339Phe | p.L339F | Q8N5B7 | protein_coding | tolerated(0.15) | benign(0.133) | TCGA-AC-A23H-01 | Breast | breast invasive carcinoma | Female | >=65 | I/II | Unknown | Unknown | PD | |
| CERS5 | insertion | In_Frame_Ins | novel | c.1031_1032insCACATGGGAGGC | p.Val344_Ser345insThrTrpGluAla | p.V344_S345insTWEA | Q8N5B7 | protein_coding | TCGA-BH-A0EB-01 | Breast | breast invasive carcinoma | Female | >=65 | I/II | Hormone Therapy | arimidex | SD | ||
| CERS5 | insertion | Nonsense_Mutation | novel | c.1030-1_1030insTAGCTCCAGCAATGGTGCCAATCGGGTGAATG | p.Val344Ter | p.V344* | Q8N5B7 | protein_coding | TCGA-BH-A0EB-01 | Breast | breast invasive carcinoma | Female | >=65 | I/II | Hormone Therapy | arimidex | SD | ||
| CERS5 | SNV | Missense_Mutation | c.895N>A | p.Glu299Lys | p.E299K | Q8N5B7 | protein_coding | deleterious(0.01) | benign(0.159) | TCGA-C5-A1BI-01 | Cervix | cervical & endocervical cancer | Female | <65 | III/IV | Chemotherapy | cisplatin | SD | |
| CERS5 | SNV | Missense_Mutation | novel | c.305N>T | p.Tyr102Phe | p.Y102F | Q8N5B7 | protein_coding | tolerated(0.32) | benign(0.062) | TCGA-AA-3678-01 | Colorectum | colon adenocarcinoma | Female | <65 | III/IV | Chemotherapy | folinic | CR |
| CERS5 | SNV | Missense_Mutation | novel | c.547C>A | p.Leu183Ile | p.L183I | Q8N5B7 | protein_coding | deleterious(0.05) | benign(0.192) | TCGA-AA-3845-01 | Colorectum | colon adenocarcinoma | Female | >=65 | I/II | Unknown | Unknown | PD |
| CERS5 | SNV | Missense_Mutation | c.389G>T | p.Arg130Met | p.R130M | Q8N5B7 | protein_coding | deleterious(0) | probably_damaging(0.992) | TCGA-AD-6889-01 | Colorectum | colon adenocarcinoma | Male | >=65 | I/II | Chemotherapy | xeloda | PD | |
| CERS5 | SNV | Missense_Mutation | c.224N>A | p.Cys75Tyr | p.C75Y | Q8N5B7 | protein_coding | tolerated(1) | benign(0) | TCGA-AZ-6601-01 | Colorectum | colon adenocarcinoma | Male | >=65 | I/II | Unknown | Unknown | PD | |
| CERS5 | SNV | Missense_Mutation | rs373121500 | c.1045N>T | p.Arg349Cys | p.R349C | Q8N5B7 | protein_coding | deleterious(0) | probably_damaging(0.951) | TCGA-CA-6717-01 | Colorectum | colon adenocarcinoma | Male | <65 | I/II | Chemotherapy | oxaliplatin | CR |
| Page: 1 2 3 4 |
Top |
Related drugs of malignant transformation related genes |
| Identification of chemicals and drugs interact with genes involved in malignant transfromation |
| (DGIdb 4.0) |
| Entrez ID | Symbol | Category | Interaction Types | Drug Claim Name | Drug Name | PMIDs |
| Page: 1 |

Copyright 2023-Present -The University of Texas Health Science Center at Houston |