
|
|||||
|
 | |
| |
| |
| |
| |
| |
|
Gene: CDHR5 |
Gene summary for CDHR5 |
| Gene information | Species | Human | Gene symbol | CDHR5 | Gene ID | 53841 |
| Gene name | cadherin related family member 5 | |
| Gene Alias | MLPCDH | |
| Cytomap | 11p15.5 | |
| Gene Type | protein-coding | GO ID | GO:0007155 | UniProtAcc | B4DV98 |
Top |
Malignant transformation analysis |
| Identification of the aberrant gene expression in precancerous and cancerous lesions by comparing the gene expression of stem-like cells in diseased tissues with normal stem cells |
| Entrez ID | Symbol | Replicates | Species | Organ | Tissue | Adj P-value | Log2FC | Malignancy |
| 53841 | CDHR5 | Pat17-B | Human | Stomach | GC | 1.64e-40 | 9.91e-01 | 0.3109 |
| 53841 | CDHR5 | Pat18-B | Human | Stomach | GC | 6.24e-06 | 3.28e-01 | -0.0432 |
| 53841 | CDHR5 | Pat19-B | Human | Stomach | GC | 4.25e-16 | 5.61e-01 | 0.0826 |
| 53841 | CDHR5 | Pat22-B | Human | Stomach | GC | 3.99e-10 | 2.66e-01 | -0.1042 |
| 53841 | CDHR5 | WIM_2 | Human | Stomach | WIM | 2.16e-09 | 5.99e-01 | 0.1159 |
| 53841 | CDHR5 | SIM_1 | Human | Stomach | SIM | 2.40e-16 | 5.50e-01 | 0.3573 |
| 53841 | CDHR5 | SIM_2 | Human | Stomach | SIM | 2.12e-24 | 6.41e-01 | 0.3139 |
| 53841 | CDHR5 | SIM_4 | Human | Stomach | SIM | 1.57e-07 | 4.26e-01 | 0.2664 |
| Page: 1 2 3 |
| Tissue | Expression Dynamics | Abbreviation |
| Colorectum (GSE201348) |  | FAP: Familial adenomatous polyposis |
| CRC: Colorectal cancer | ||
| Colorectum (HTA11) |  | AD: Adenomas |
| SER: Sessile serrated lesions | ||
| MSI-H: Microsatellite-high colorectal cancer | ||
| MSS: Microsatellite stable colorectal cancer | ||
| GC | 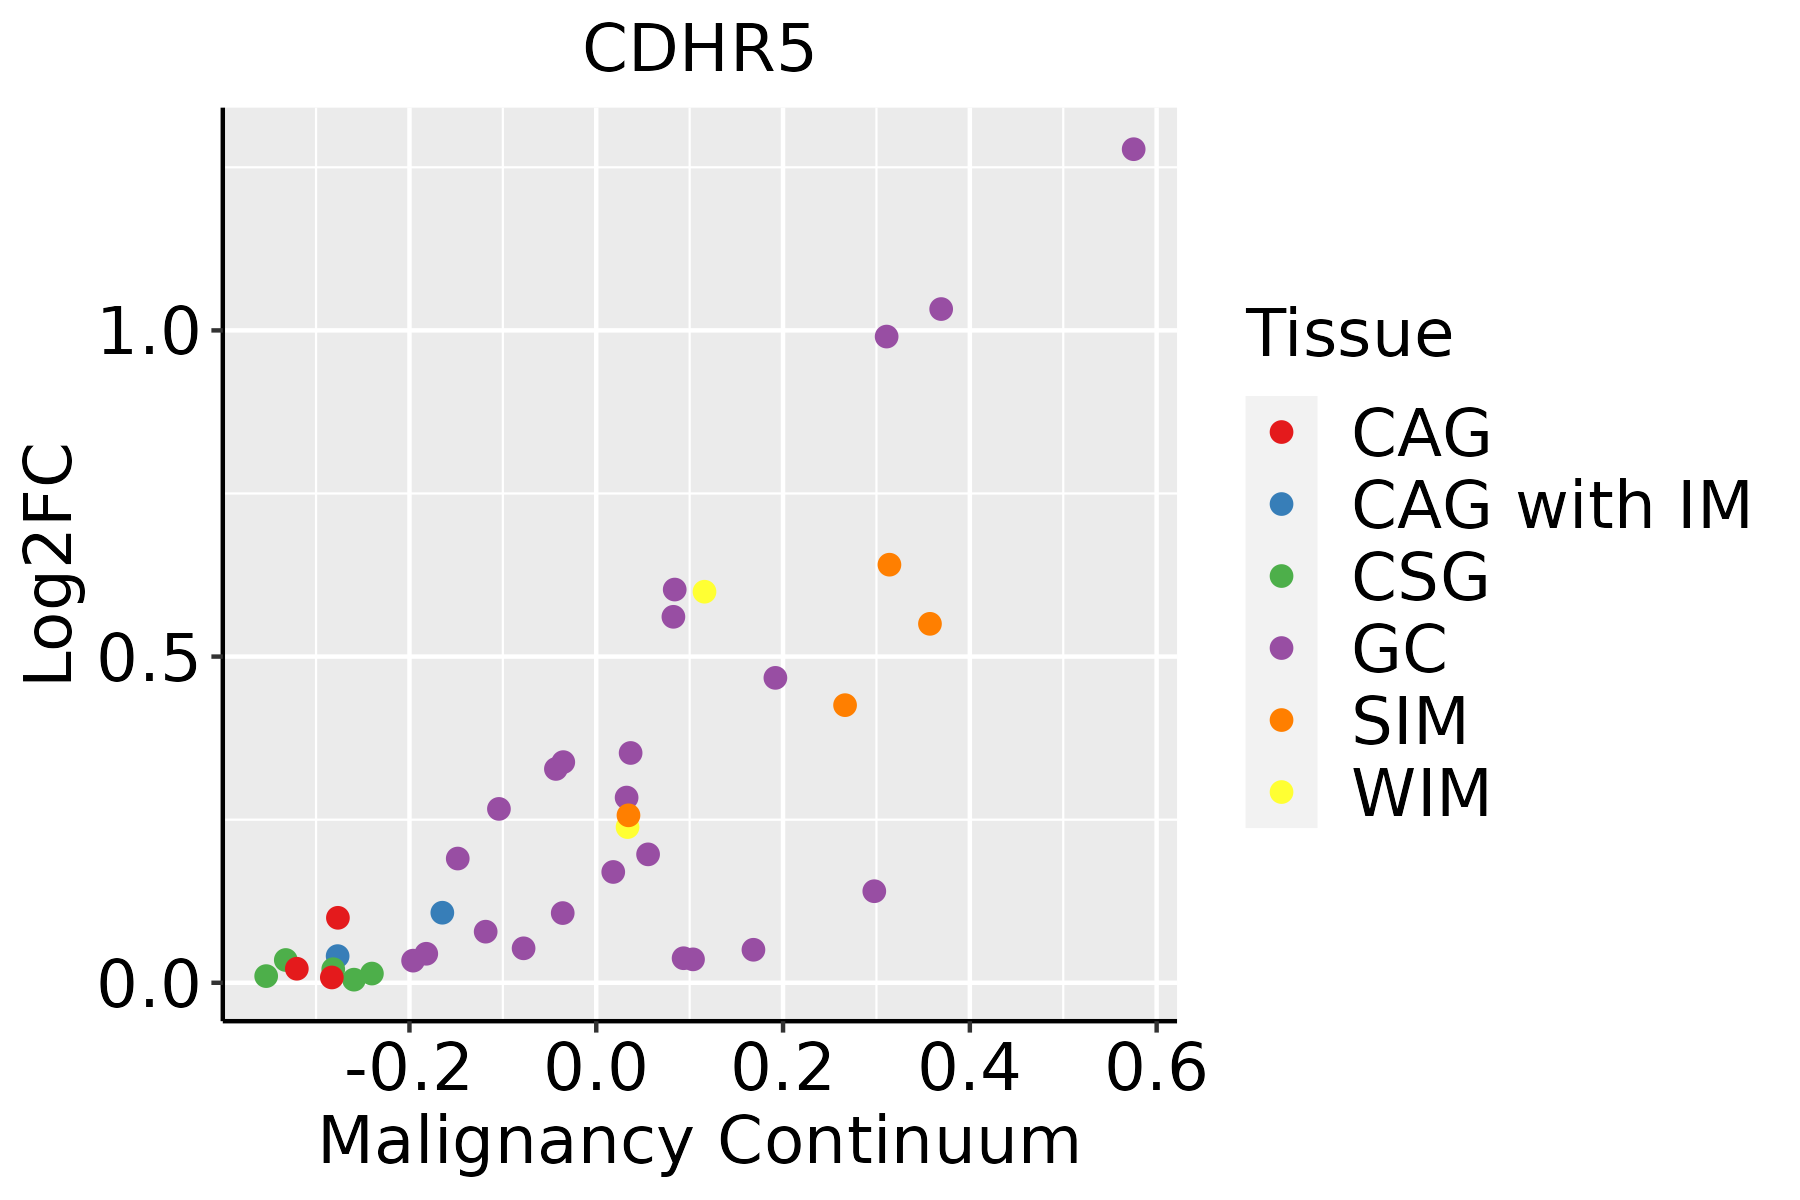 | CAG: Chronic atrophic gastritis |
| CAG with IM: Chronic atrophic gastritis with intestinal metaplasia | ||
| CSG: Chronic superficial gastritis | ||
| GC: Gastric cancer | ||
| SIM: Severe intestinal metaplasia | ||
| WIM: Wild intestinal metaplasia | ||
| Liver |  | HCC: Hepatocellular carcinoma |
| NAFLD: Non-alcoholic fatty liver disease |
| ∗log2FC in expression of this searched gene in stem-like cells from each diseased tissue sample relative to stem-like cells in normal samples in each tissue plotted against the malignancy continuum. Samples are colored based on if they are from different disease stage. |
Top |
Malignant transformation related pathway analysis |
| Find out the enriched GO biological processes and KEGG pathways involved in transition from healthy to precancer to cancer |
| Tissue | Disease Stage | Enriched GO biological Processes |
| Colorectum | AD |  |
| Colorectum | SER |  |
| Colorectum | MSS |  |
| Colorectum | MSI-H |  |
| Colorectum | FAP |  |
| ∗Top 15 enriched GO BP terms are showed in the bar plot of each disease state in each tissue. Each row represents a significant GO biological process which is colored according to the -log10(p.adjust). |
| Page: 1 2 3 4 5 6 7 8 9 |
| GO ID | Tissue | Disease Stage | Description | Gene Ratio | Bg Ratio | pvalue | p.adjust | Count |
| GO:0032535 | Colorectum | AD | regulation of cellular component size | 142/3918 | 383/18723 | 1.74e-13 | 3.41e-11 | 142 |
| GO:0032530 | Colorectum | AD | regulation of microvillus organization | 10/3918 | 13/18723 | 2.43e-05 | 4.69e-04 | 10 |
| GO:0032528 | Colorectum | AD | microvillus organization | 14/3918 | 24/18723 | 6.90e-05 | 1.11e-03 | 14 |
| GO:00325351 | Colorectum | SER | regulation of cellular component size | 115/2897 | 383/18723 | 3.04e-13 | 1.10e-10 | 115 |
| GO:00325301 | Colorectum | SER | regulation of microvillus organization | 10/2897 | 13/18723 | 1.41e-06 | 6.46e-05 | 10 |
| GO:00325281 | Colorectum | SER | microvillus organization | 14/2897 | 24/18723 | 1.83e-06 | 7.80e-05 | 14 |
| GO:0032536 | Colorectum | SER | regulation of cell projection size | 6/2897 | 12/18723 | 5.42e-03 | 4.03e-02 | 6 |
| GO:00325352 | Colorectum | MSS | regulation of cellular component size | 127/3467 | 383/18723 | 3.44e-12 | 5.79e-10 | 127 |
| GO:00325302 | Colorectum | MSS | regulation of microvillus organization | 9/3467 | 13/18723 | 8.79e-05 | 1.41e-03 | 9 |
| GO:00325282 | Colorectum | MSS | microvillus organization | 13/3467 | 24/18723 | 9.44e-05 | 1.49e-03 | 13 |
| GO:00325353 | Colorectum | FAP | regulation of cellular component size | 99/2622 | 383/18723 | 4.53e-10 | 1.16e-07 | 99 |
| GO:00325303 | Colorectum | FAP | regulation of microvillus organization | 8/2622 | 13/18723 | 9.75e-05 | 1.65e-03 | 8 |
| GO:00325283 | Colorectum | FAP | microvillus organization | 11/2622 | 24/18723 | 1.70e-04 | 2.56e-03 | 11 |
| GO:003253522 | Liver | HCC | regulation of cellular component size | 217/7958 | 383/18723 | 1.28e-08 | 3.14e-07 | 217 |
| GO:00325307 | Liver | HCC | regulation of microvillus organization | 12/7958 | 13/18723 | 2.73e-04 | 1.98e-03 | 12 |
| GO:00325286 | Liver | HCC | microvillus organization | 18/7958 | 24/18723 | 1.27e-03 | 6.92e-03 | 18 |
| GO:00325285 | Stomach | GC | microvillus organization | 13/1159 | 24/18723 | 2.41e-10 | 3.75e-08 | 13 |
| GO:00325306 | Stomach | GC | regulation of microvillus organization | 8/1159 | 13/18723 | 2.05e-07 | 1.12e-05 | 8 |
| GO:00325364 | Stomach | GC | regulation of cell projection size | 6/1159 | 12/18723 | 3.71e-05 | 9.70e-04 | 6 |
| GO:00325355 | Stomach | GC | regulation of cellular component size | 44/1159 | 383/18723 | 5.66e-05 | 1.31e-03 | 44 |
| Page: 1 2 |
| Pathway ID | Tissue | Disease Stage | Description | Gene Ratio | Bg Ratio | pvalue | p.adjust | qvalue | Count |
| Page: 1 |
Top |
Cell-cell communication analysis |
| Identification of potential cell-cell interactions between two cell types and their ligand-receptor pairs for different disease states |
| Ligand | Receptor | LRpair | Pathway | Tissue | Disease Stage |
| Page: 1 |
Top |
Single-cell gene regulatory network inference analysis |
| Find out the significant the regulons (TFs) and the target genes of each regulon across cell types for different disease states |
| TF | Cell Type | Tissue | Disease Stage | Target Gene | RSS | Regulon Activity |
| ∗The dot plots of a searched regulon are shown for all cell subpopulations in each disease state of each tissue based on the regulon specific score inferred using pySCENIC and by calculating the average expression. |
| Page: 1 |
Top |
Somatic mutation of malignant transformation related genes |
| Annotation of somatic variants for genes involved in malignant transformation |
| Hugo Symbol | Variant Class | Variant Classification | dbSNP RS | HGVSc | HGVSp | HGVSp Short | SWISSPROT | BIOTYPE | SIFT | PolyPhen | Tumor Sample Barcode | Tissue | Histology | Sex | Age | Stage | Therapy Types | Drugs | Outcome |
| CDHR5 | SNV | Missense_Mutation | rs755331585 | c.661N>A | p.Ala221Thr | p.A221T | Q9HBB8 | protein_coding | deleterious(0) | probably_damaging(0.998) | TCGA-EW-A1IZ-01 | Breast | breast invasive carcinoma | Female | <65 | III/IV | Chemotherapy | taxotere | SD |
| CDHR5 | deletion | Frame_Shift_Del | novel | c.1686delN | p.Gln562HisfsTer213 | p.Q562Hfs*213 | Q9HBB8 | protein_coding | TCGA-D8-A27V-01 | Breast | breast invasive carcinoma | Female | <65 | I/II | Hormone Therapy | tamoxiphen | SD | ||
| CDHR5 | SNV | Missense_Mutation | c.1517N>T | p.Ser506Phe | p.S506F | Q9HBB8 | protein_coding | deleterious(0.01) | possibly_damaging(0.605) | TCGA-EK-A3GK-01 | Cervix | cervical & endocervical cancer | Female | <65 | I/II | Unknown | Unknown | SD | |
| CDHR5 | SNV | Missense_Mutation | rs373271397 | c.2476N>A | p.Glu826Lys | p.E826K | Q9HBB8 | protein_coding | tolerated(0.41) | benign(0.003) | TCGA-IR-A3LH-01 | Cervix | cervical & endocervical cancer | Female | <65 | I/II | Chemotherapy | cisplatin | CR |
| CDHR5 | SNV | Missense_Mutation | c.2470G>C | p.Glu824Gln | p.E824Q | Q9HBB8 | protein_coding | tolerated(0.12) | benign(0.045) | TCGA-Q1-A73P-01 | Cervix | cervical & endocervical cancer | Female | <65 | I/II | Unknown | Unknown | SD | |
| CDHR5 | SNV | Missense_Mutation | c.224N>A | p.Gly75Glu | p.G75E | Q9HBB8 | protein_coding | tolerated(0.11) | possibly_damaging(0.56) | TCGA-5M-AAT4-01 | Colorectum | colon adenocarcinoma | Male | >=65 | III/IV | Unknown | Unknown | PD | |
| CDHR5 | SNV | Missense_Mutation | rs764791491 | c.842G>A | p.Arg281His | p.R281H | Q9HBB8 | protein_coding | deleterious(0.05) | possibly_damaging(0.706) | TCGA-A6-6781-01 | Colorectum | colon adenocarcinoma | Male | <65 | III/IV | Chemotherapy | oxaliplatin | SD |
| CDHR5 | SNV | Missense_Mutation | rs760407741 | c.367N>A | p.Glu123Lys | p.E123K | Q9HBB8 | protein_coding | tolerated(0.66) | benign(0.024) | TCGA-AA-3815-01 | Colorectum | colon adenocarcinoma | Female | >=65 | I/II | Unknown | Unknown | SD |
| CDHR5 | SNV | Missense_Mutation | rs764162002 | c.410C>T | p.Thr137Met | p.T137M | Q9HBB8 | protein_coding | deleterious(0) | probably_damaging(0.917) | TCGA-AA-3864-01 | Colorectum | colon adenocarcinoma | Male | >=65 | I/II | Unknown | Unknown | SD |
| CDHR5 | SNV | Missense_Mutation | c.233N>C | p.Leu78Pro | p.L78P | Q9HBB8 | protein_coding | deleterious(0) | probably_damaging(0.999) | TCGA-AY-6197-01 | Colorectum | colon adenocarcinoma | Male | <65 | I/II | Unknown | Unknown | SD |
| Page: 1 2 3 4 5 6 |
Top |
Related drugs of malignant transformation related genes |
| Identification of chemicals and drugs interact with genes involved in malignant transfromation |
| (DGIdb 4.0) |
| Entrez ID | Symbol | Category | Interaction Types | Drug Claim Name | Drug Name | PMIDs |
| Page: 1 |

Copyright 2023-Present -The University of Texas Health Science Center at Houston |