
|
|||||
|
 | |
| |
| |
| |
| |
| |
|
Gene: CCDC6 |
Gene summary for CCDC6 |
| Gene information | Species | Human | Gene symbol | CCDC6 | Gene ID | 8030 |
| Gene name | coiled-coil domain containing 6 | |
| Gene Alias | D10S170 | |
| Cytomap | 10q21.2 | |
| Gene Type | protein-coding | GO ID | GO:0006996 | UniProtAcc | Q05CP8 |
Top |
Malignant transformation analysis |
| Identification of the aberrant gene expression in precancerous and cancerous lesions by comparing the gene expression of stem-like cells in diseased tissues with normal stem cells |
| Entrez ID | Symbol | Replicates | Species | Organ | Tissue | Adj P-value | Log2FC | Malignancy |
| 8030 | CCDC6 | F034 | Human | Colorectum | FAP | 4.95e-22 | -3.28e-01 | -0.0665 |
| 8030 | CCDC6 | F072B | Human | Colorectum | FAP | 1.36e-11 | -2.86e-01 | 0.257 |
| 8030 | CCDC6 | CRC-1-8810 | Human | Colorectum | CRC | 8.54e-10 | -3.38e-01 | 0.6257 |
| 8030 | CCDC6 | CRC-3-11773 | Human | Colorectum | CRC | 3.20e-14 | -3.21e-01 | 0.2564 |
| 8030 | CCDC6 | AEH-subject1 | Human | Endometrium | AEH | 1.73e-08 | 3.42e-01 | -0.3059 |
| 8030 | CCDC6 | AEH-subject2 | Human | Endometrium | AEH | 4.05e-07 | 2.68e-01 | -0.2525 |
| 8030 | CCDC6 | AEH-subject3 | Human | Endometrium | AEH | 1.96e-02 | 6.40e-02 | -0.2576 |
| 8030 | CCDC6 | AEH-subject4 | Human | Endometrium | AEH | 7.01e-05 | 2.82e-01 | -0.2657 |
| 8030 | CCDC6 | AEH-subject5 | Human | Endometrium | AEH | 2.23e-03 | 2.90e-01 | -0.2953 |
| 8030 | CCDC6 | EEC-subject1 | Human | Endometrium | EEC | 2.54e-03 | 1.95e-01 | -0.2682 |
| 8030 | CCDC6 | EEC-subject2 | Human | Endometrium | EEC | 4.24e-16 | 4.65e-01 | -0.2607 |
| 8030 | CCDC6 | EEC-subject3 | Human | Endometrium | EEC | 6.34e-08 | -6.39e-02 | -0.2525 |
| 8030 | CCDC6 | EEC-subject4 | Human | Endometrium | EEC | 2.08e-04 | 2.57e-01 | -0.2571 |
| 8030 | CCDC6 | EEC-subject5 | Human | Endometrium | EEC | 1.81e-10 | 4.02e-01 | -0.249 |
| 8030 | CCDC6 | GSM5276934 | Human | Endometrium | EEC | 3.41e-02 | -1.46e-01 | -0.0913 |
| 8030 | CCDC6 | GSM5276935 | Human | Endometrium | EEC | 9.10e-07 | 3.63e-01 | -0.123 |
| 8030 | CCDC6 | GSM6177620_NYU_UCEC1_lib1_lib1 | Human | Endometrium | EEC | 2.86e-12 | 1.76e-01 | -0.1869 |
| 8030 | CCDC6 | GSM6177620_NYU_UCEC1_lib2_lib2 | Human | Endometrium | EEC | 5.47e-12 | 1.66e-01 | -0.1875 |
| 8030 | CCDC6 | GSM6177620_NYU_UCEC1_lib3_lib3 | Human | Endometrium | EEC | 1.63e-13 | 7.20e-02 | -0.1883 |
| 8030 | CCDC6 | GSM6177621_NYU_UCEC2_lib1_lib1 | Human | Endometrium | EEC | 3.62e-09 | 3.17e-03 | -0.1934 |
| Page: 1 2 3 4 5 6 7 8 9 |
| Tissue | Expression Dynamics | Abbreviation |
| Breast | 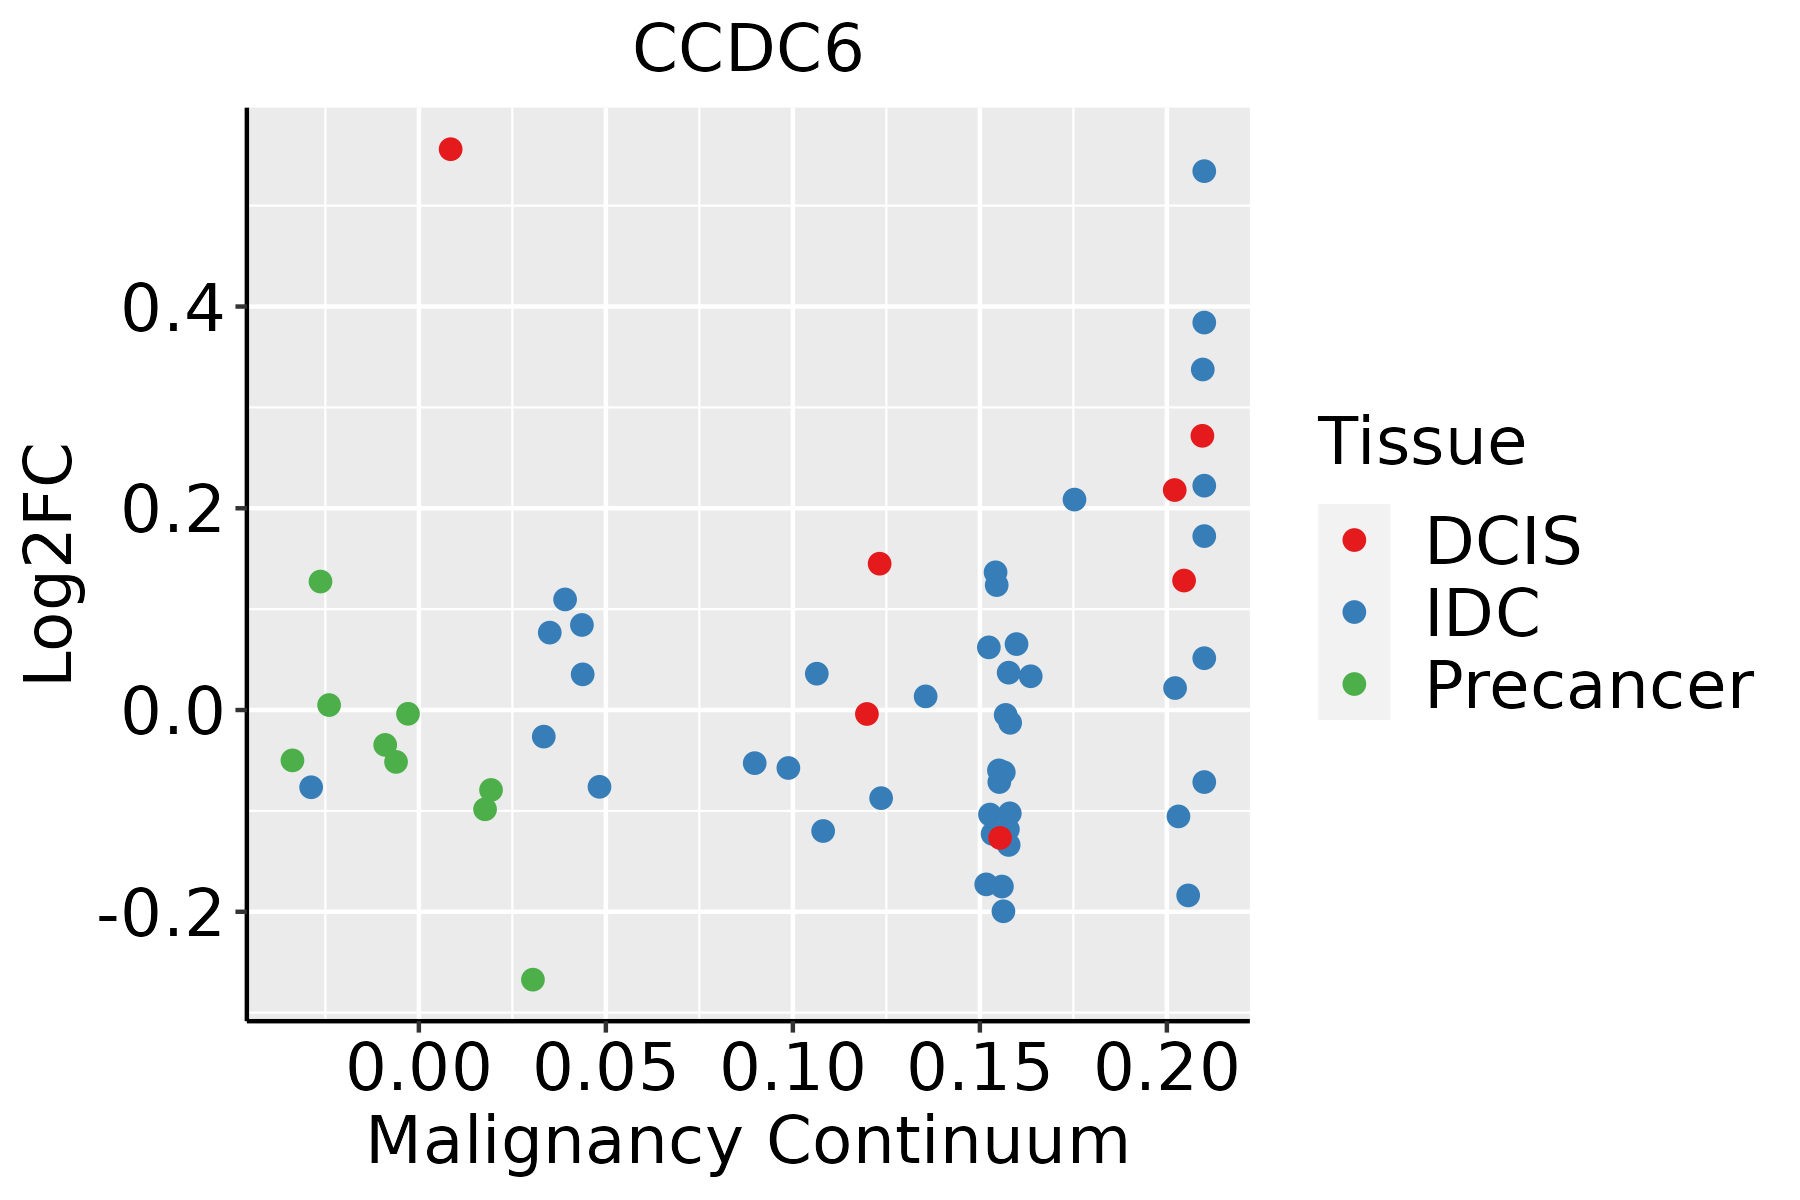 | IDC: Invasive ductal carcinoma |
| DCIS: Ductal carcinoma in situ | ||
| Precancer(BRCA1-mut): Precancerous lesion from BRCA1 mutation carriers | ||
| Colorectum (GSE201348) |  | FAP: Familial adenomatous polyposis |
| CRC: Colorectal cancer | ||
| Colorectum (HTA11) |  | AD: Adenomas |
| SER: Sessile serrated lesions | ||
| MSI-H: Microsatellite-high colorectal cancer | ||
| MSS: Microsatellite stable colorectal cancer | ||
| Endometrium | 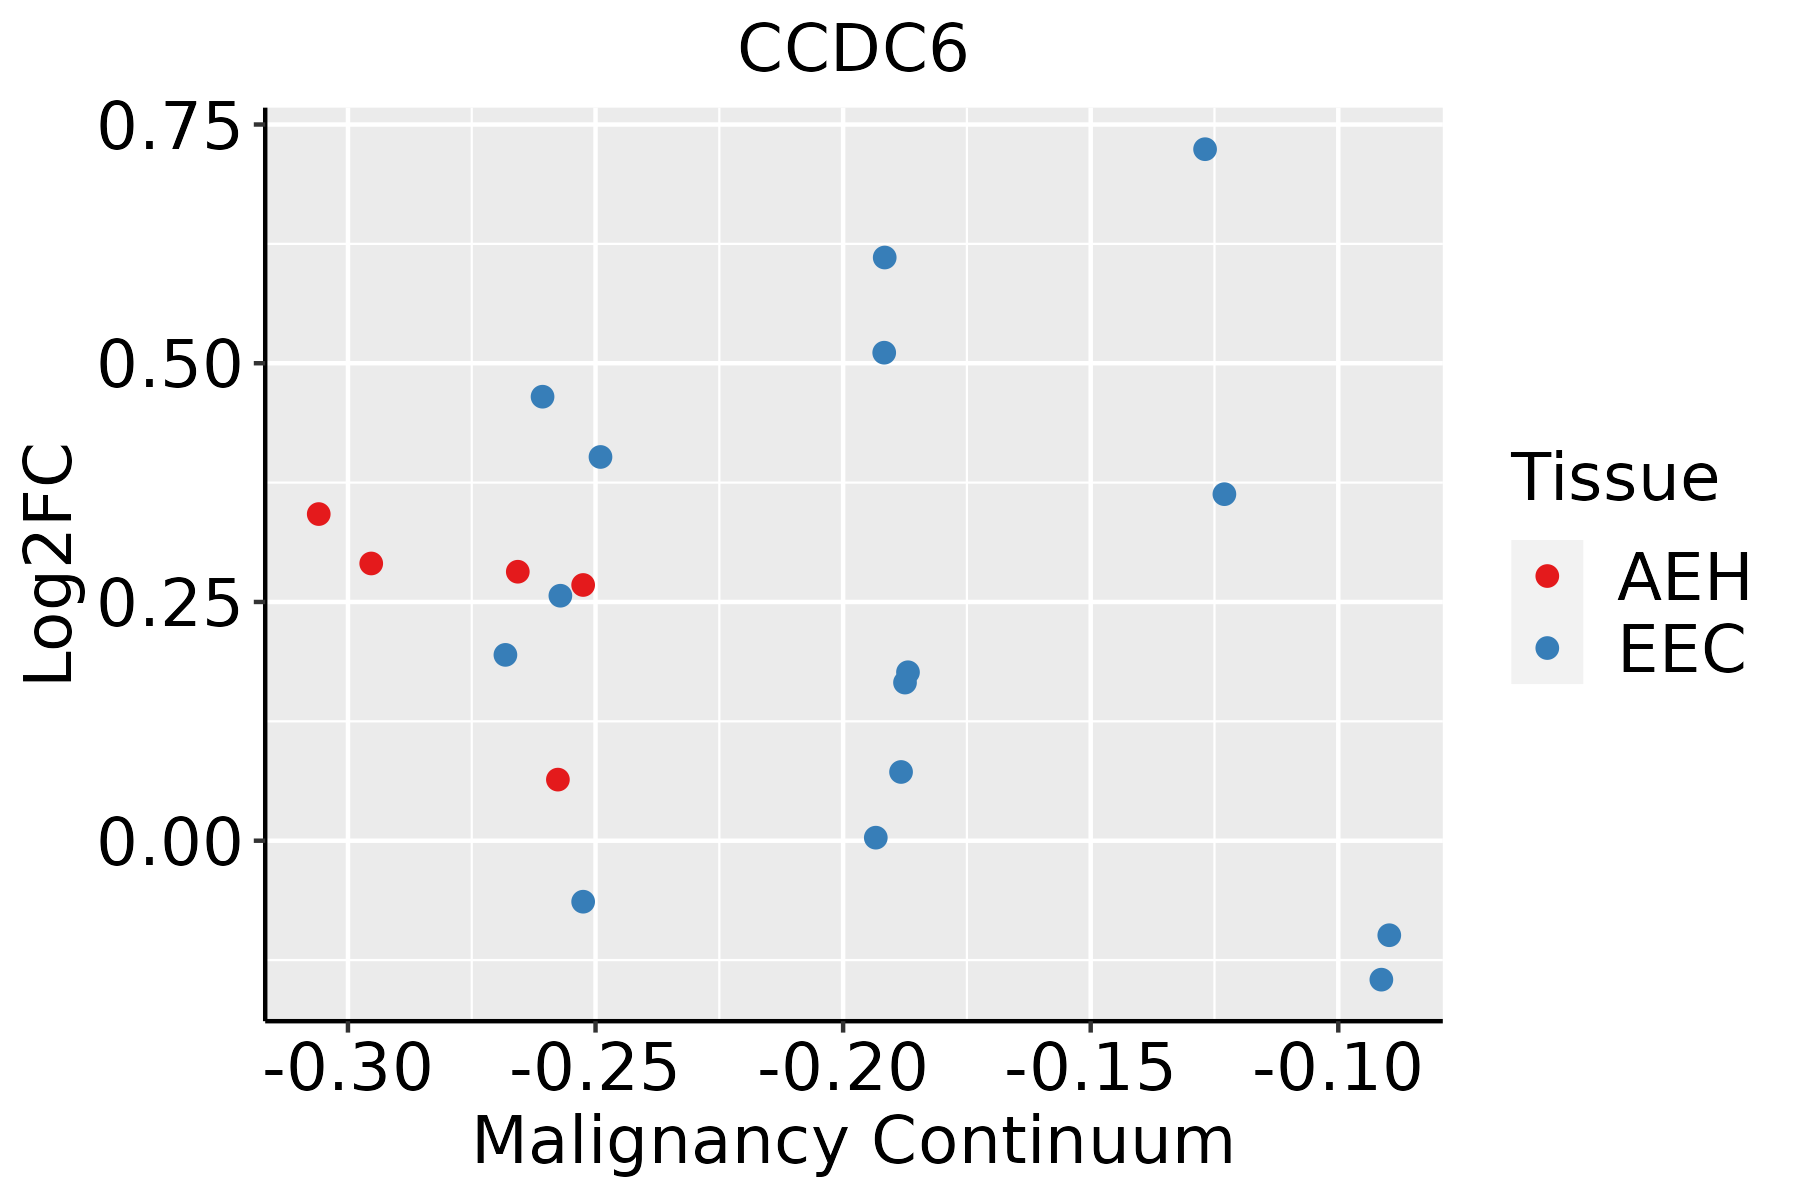 | AEH: Atypical endometrial hyperplasia |
| EEC: Endometrioid Cancer | ||
| Esophagus | 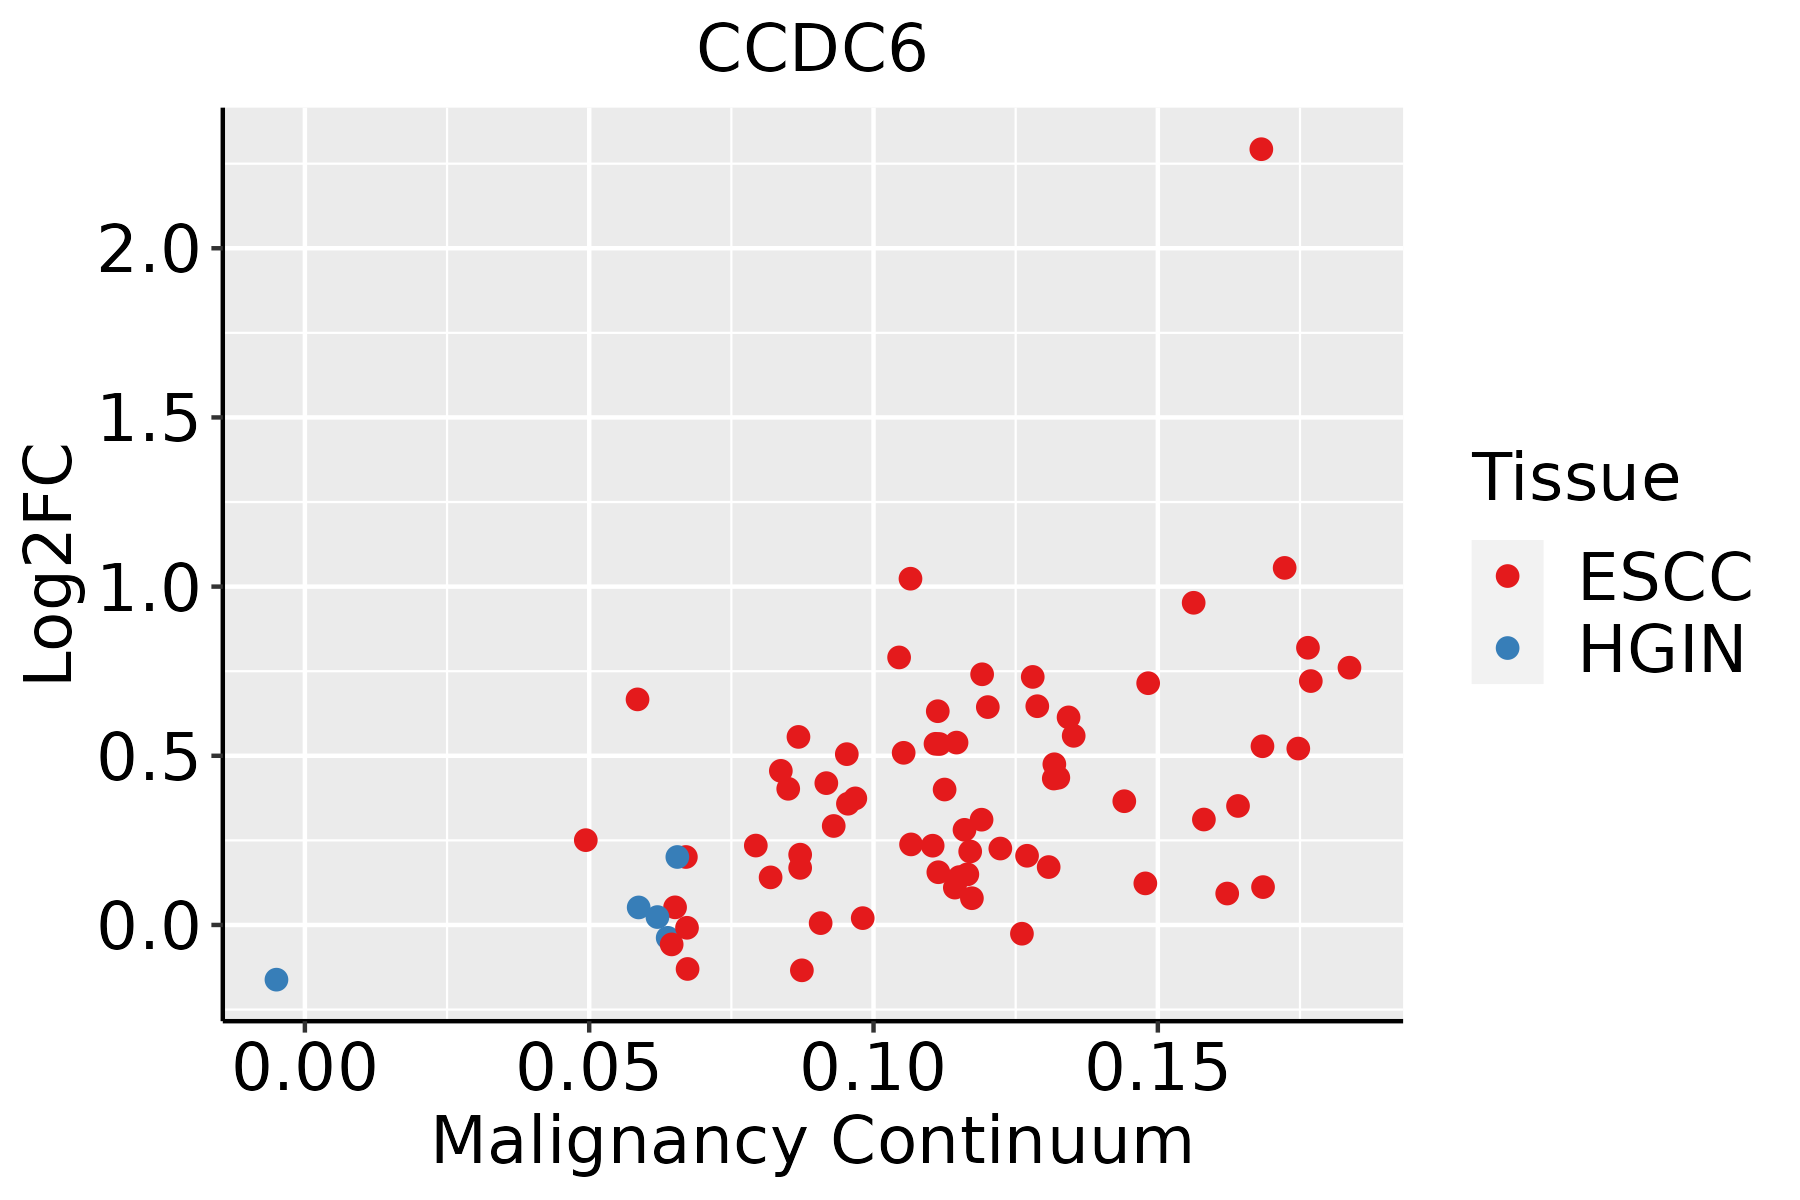 | ESCC: Esophageal squamous cell carcinoma |
| HGIN: High-grade intraepithelial neoplasias | ||
| LGIN: Low-grade intraepithelial neoplasias | ||
| Liver | 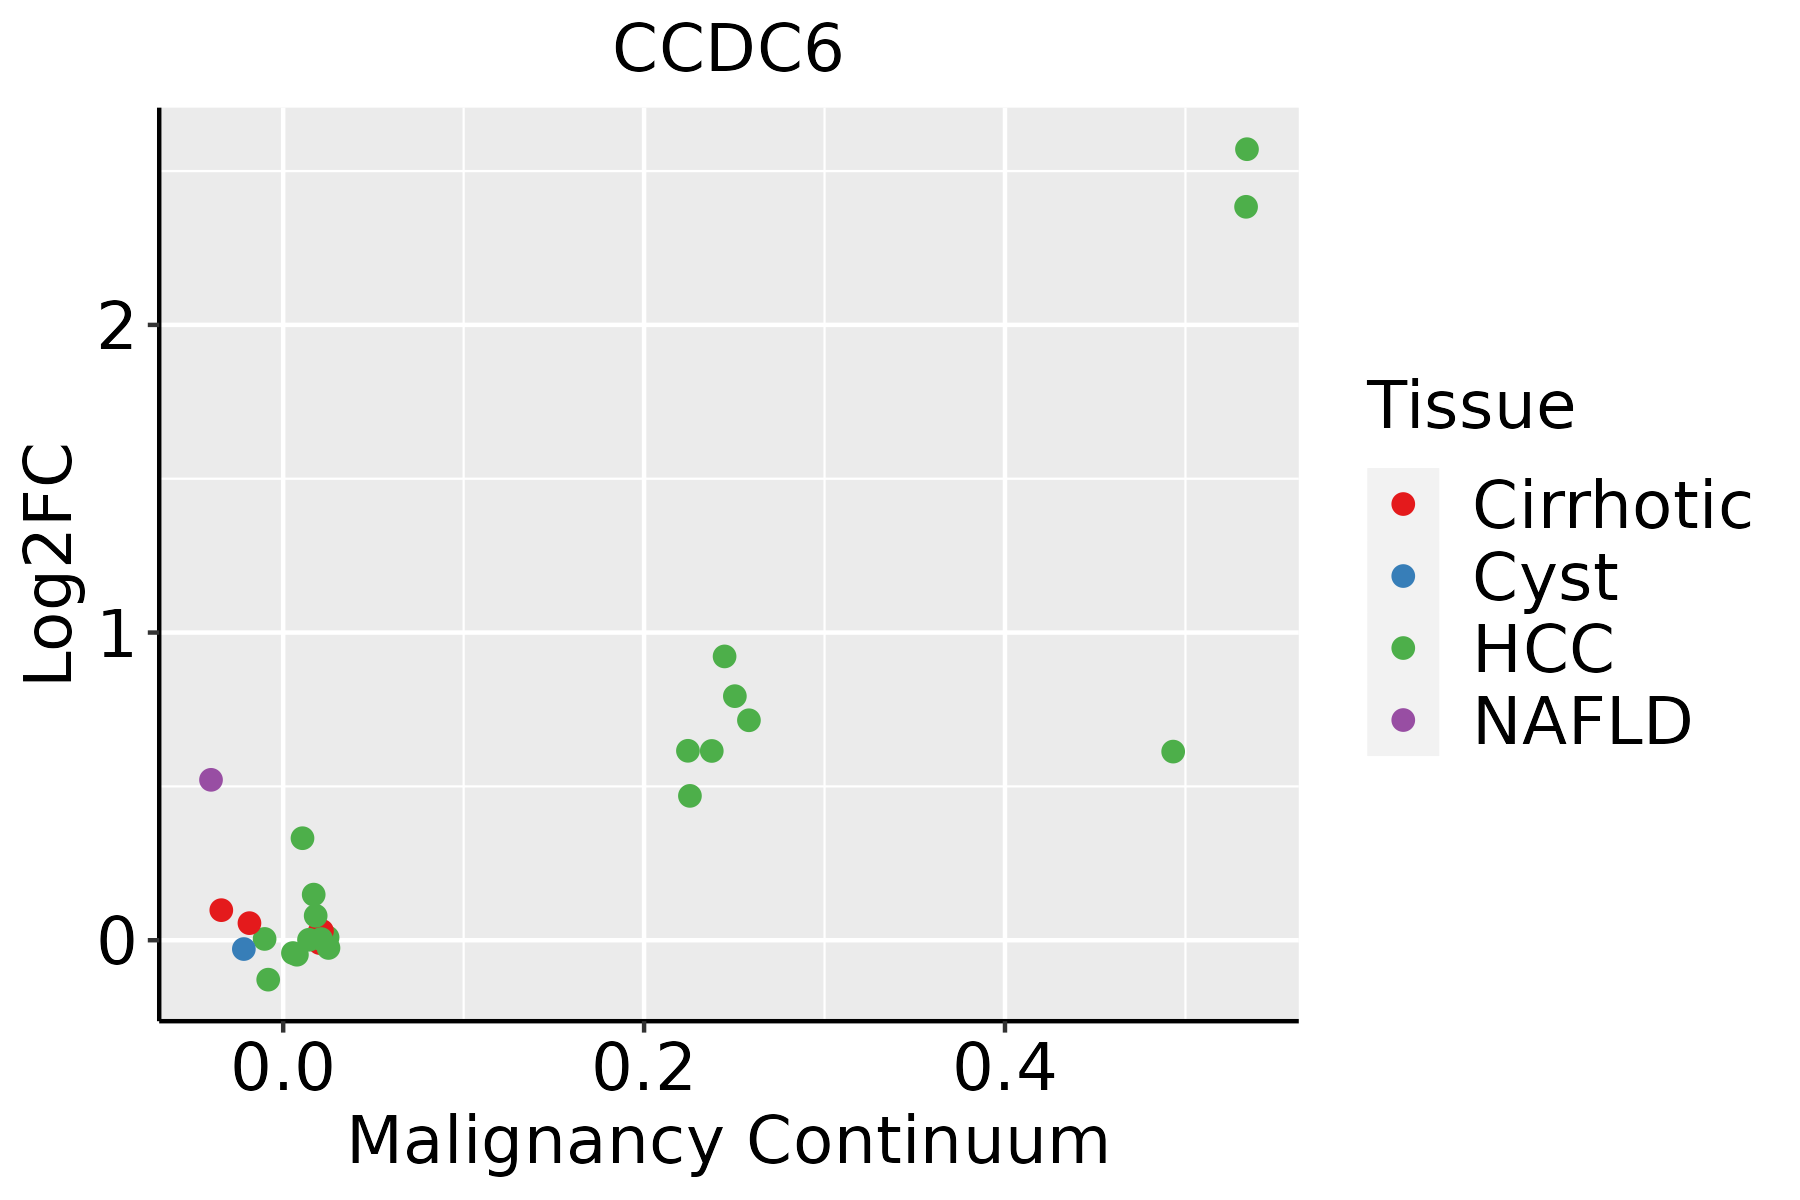 | HCC: Hepatocellular carcinoma |
| NAFLD: Non-alcoholic fatty liver disease | ||
| Oral Cavity | 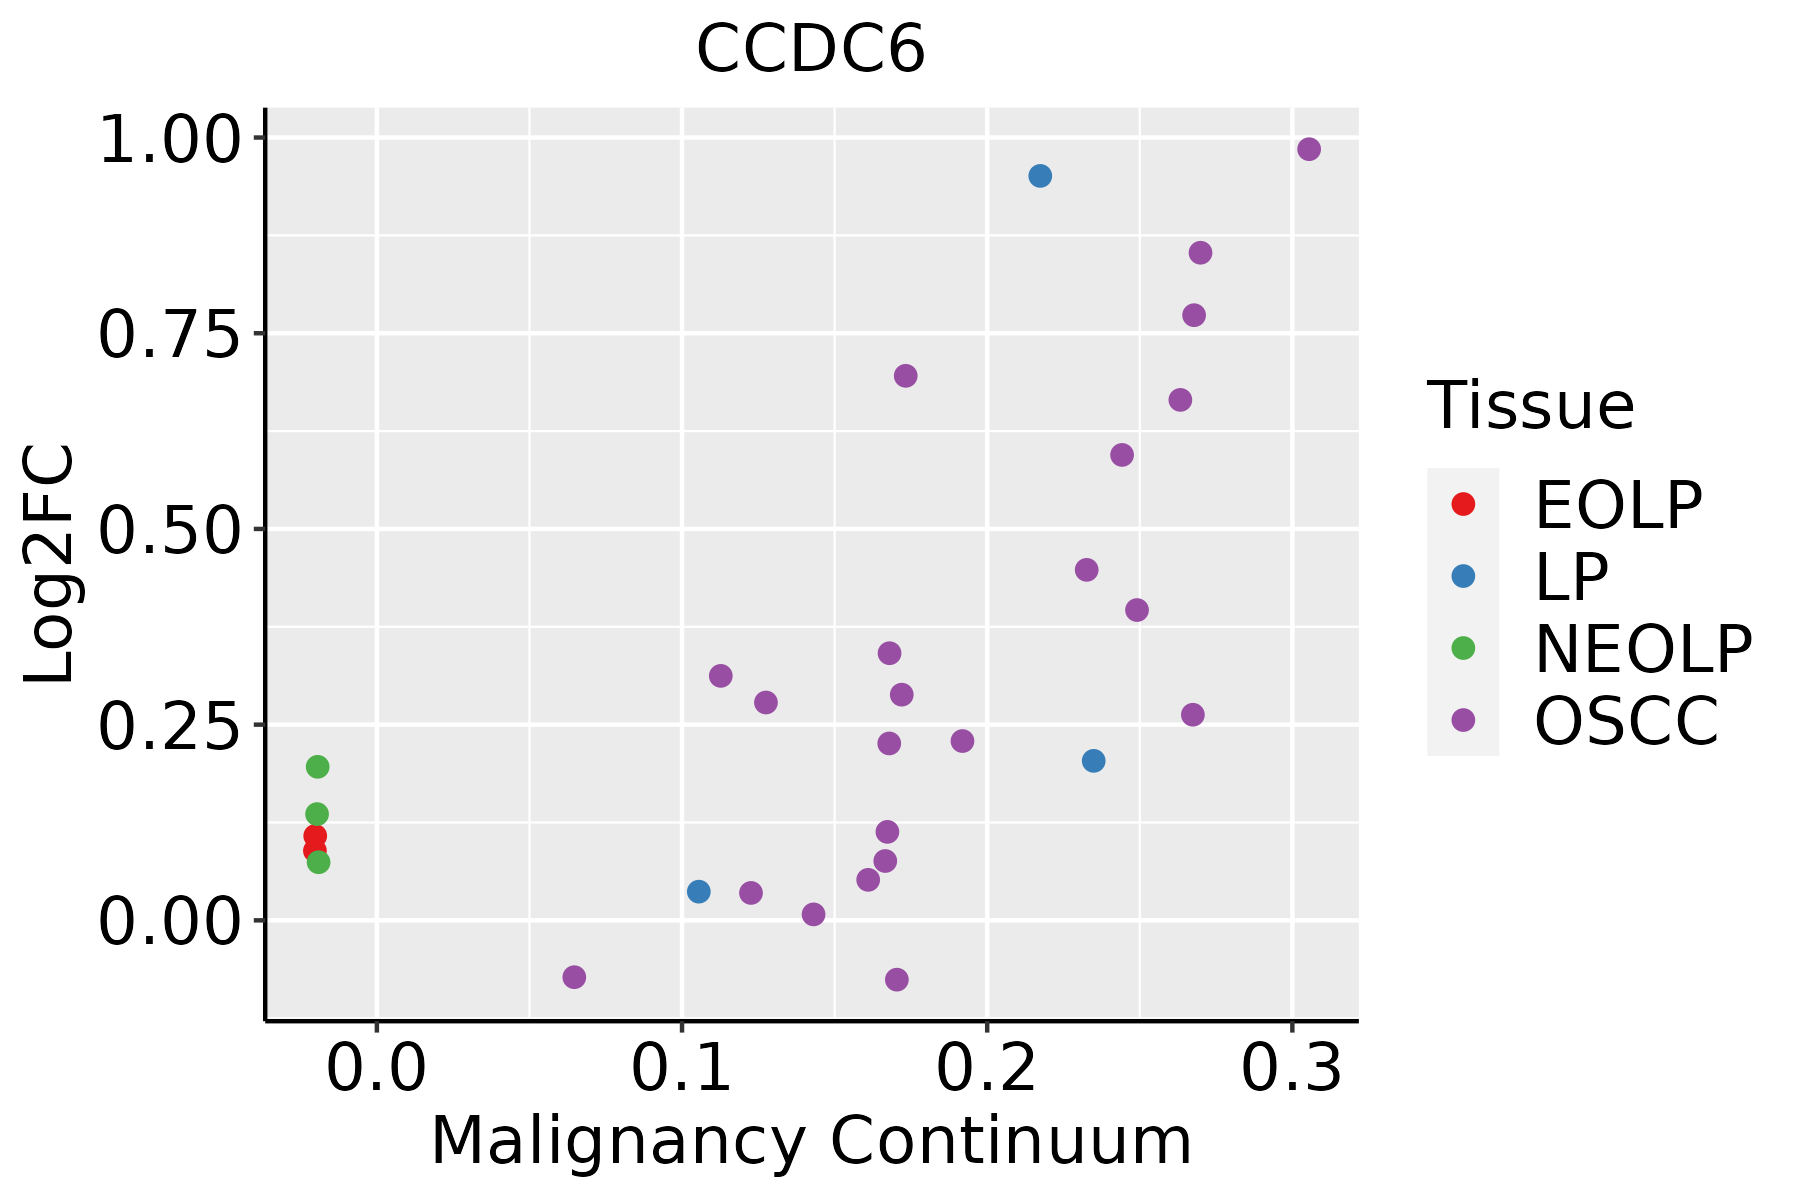 | EOLP: Erosive Oral lichen planus |
| LP: leukoplakia | ||
| NEOLP: Non-erosive oral lichen planus | ||
| OSCC: Oral squamous cell carcinoma | ||
| Prostate | 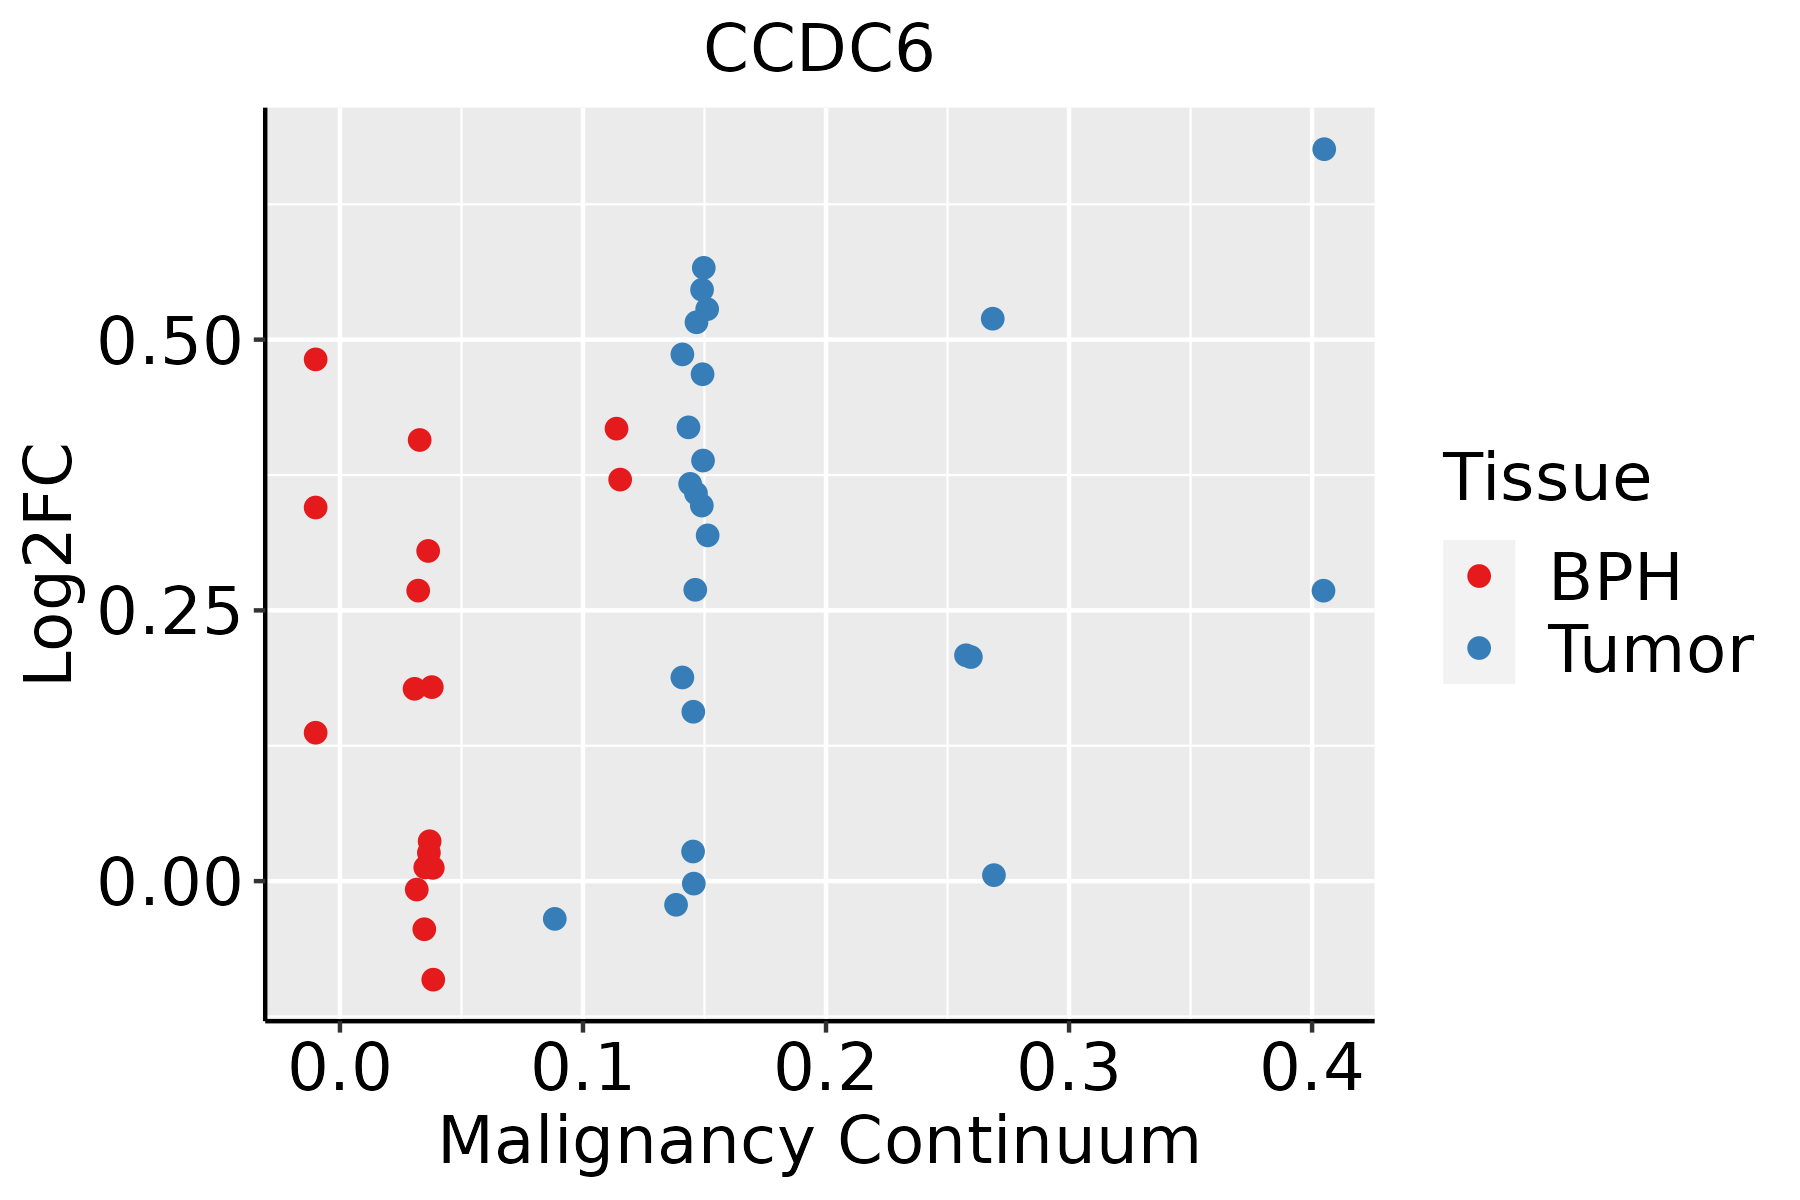 | BPH: Benign Prostatic Hyperplasia |
| Skin | 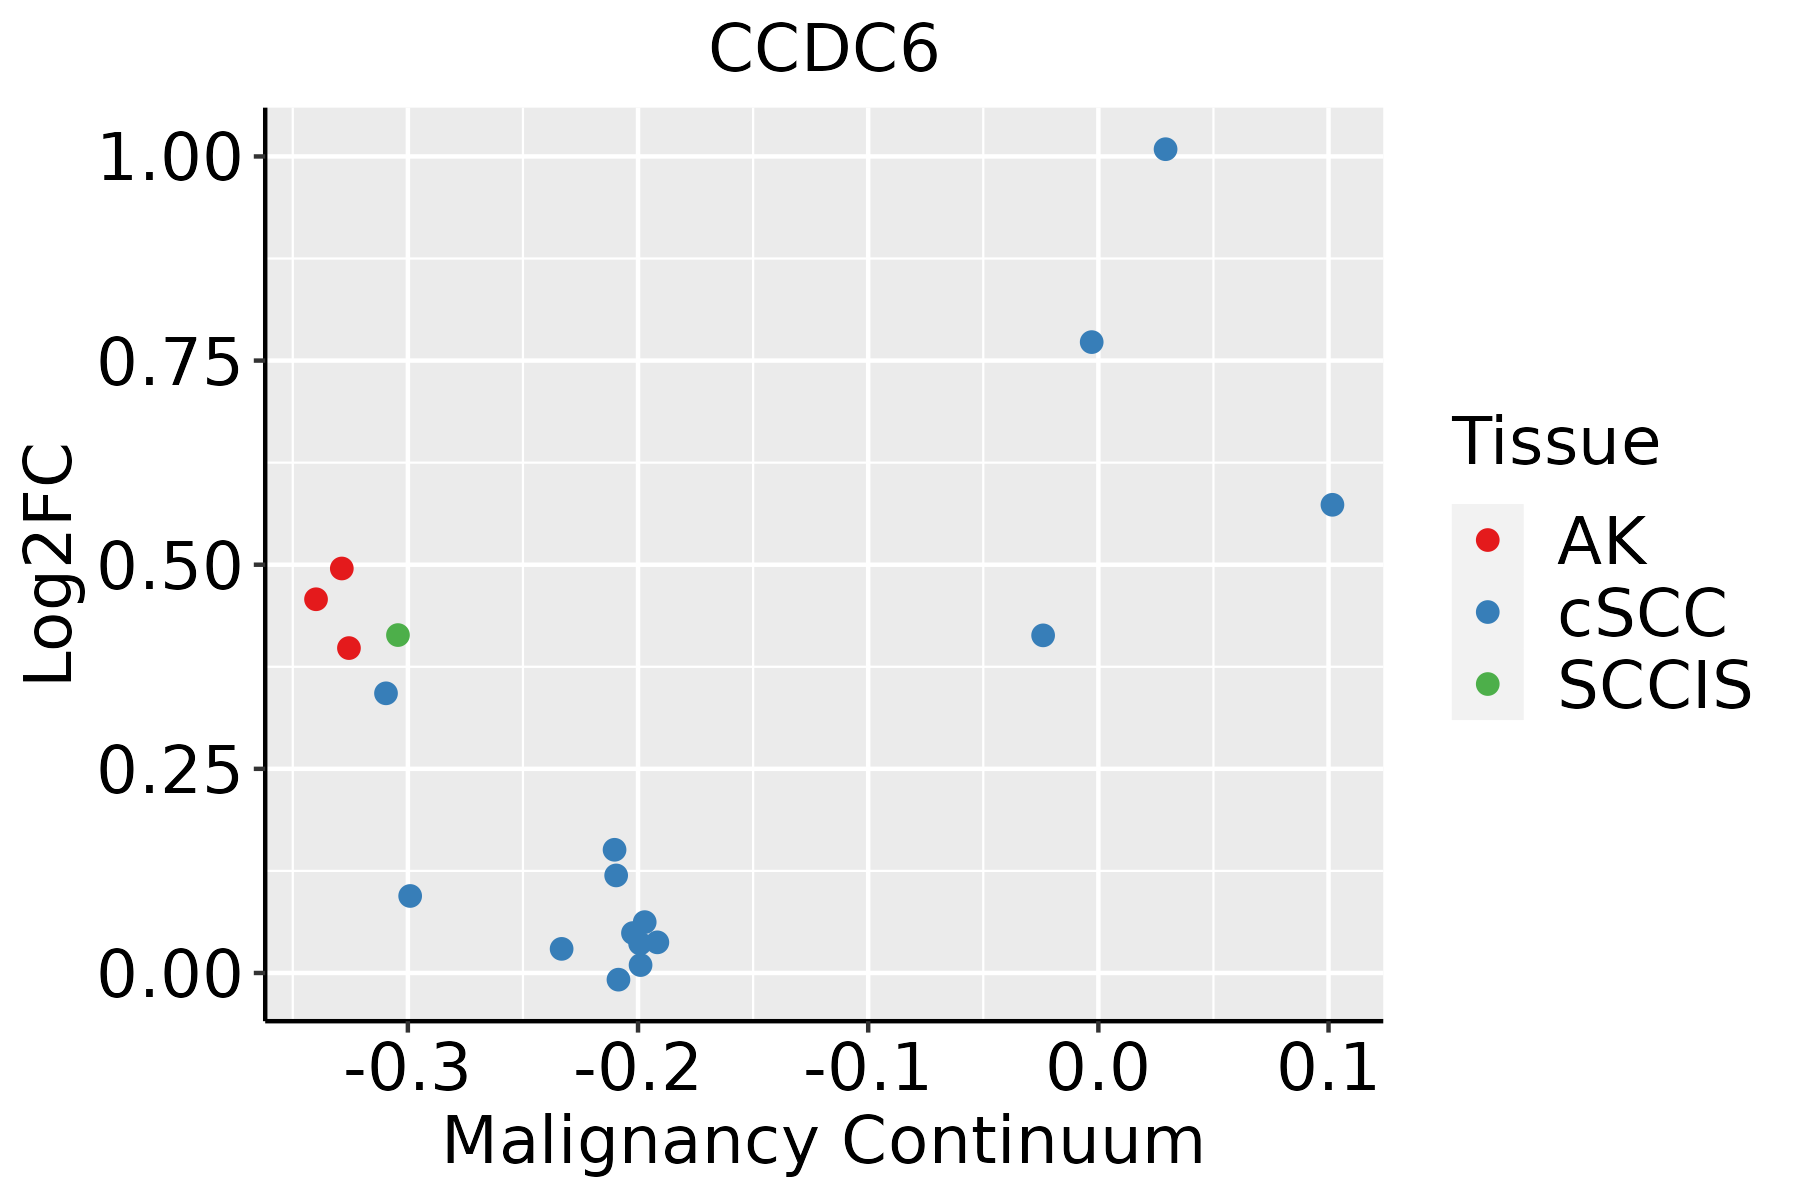 | AK: Actinic keratosis |
| cSCC: Cutaneous squamous cell carcinoma | ||
| SCCIS:squamous cell carcinoma in situ | ||
| Thyroid |  | ATC: Anaplastic thyroid cancer |
| HT: Hashimoto's thyroiditis | ||
| PTC: Papillary thyroid cancer |
| ∗log2FC in expression of this searched gene in stem-like cells from each diseased tissue sample relative to stem-like cells in normal samples in each tissue plotted against the malignancy continuum. Samples are colored based on if they are from different disease stage. |
Top |
Malignant transformation related pathway analysis |
| Find out the enriched GO biological processes and KEGG pathways involved in transition from healthy to precancer to cancer |
| Tissue | Disease Stage | Enriched GO biological Processes |
| Colorectum | AD |  |
| Colorectum | SER |  |
| Colorectum | MSS |  |
| Colorectum | MSI-H |  |
| Colorectum | FAP |  |
| ∗Top 15 enriched GO BP terms are showed in the bar plot of each disease state in each tissue. Each row represents a significant GO biological process which is colored according to the -log10(p.adjust). |
| Page: 1 2 3 4 5 6 7 8 9 |
| GO ID | Tissue | Disease Stage | Description | Gene Ratio | Bg Ratio | pvalue | p.adjust | Count |
| GO:000705111 | Liver | HCC | spindle organization | 116/7958 | 184/18723 | 1.40e-08 | 3.40e-07 | 116 |
| GO:005122511 | Liver | HCC | spindle assembly | 75/7958 | 117/18723 | 1.92e-06 | 2.67e-05 | 75 |
| GO:000931416 | Oral cavity | OSCC | response to radiation | 241/7305 | 456/18723 | 9.76e-10 | 2.40e-08 | 241 |
| GO:00094164 | Oral cavity | OSCC | response to light stimulus | 159/7305 | 320/18723 | 5.98e-05 | 4.92e-04 | 159 |
| GO:000705112 | Prostate | Tumor | spindle organization | 48/3246 | 184/18723 | 1.80e-03 | 1.06e-02 | 48 |
| GO:0009314111 | Thyroid | PTC | response to radiation | 195/5968 | 456/18723 | 5.10e-07 | 8.27e-06 | 195 |
| GO:00094167 | Thyroid | PTC | response to light stimulus | 127/5968 | 320/18723 | 1.76e-03 | 9.58e-03 | 127 |
| GO:000931426 | Thyroid | ATC | response to radiation | 210/6293 | 456/18723 | 1.69e-08 | 3.39e-07 | 210 |
| GO:000941613 | Thyroid | ATC | response to light stimulus | 139/6293 | 320/18723 | 1.42e-04 | 9.88e-04 | 139 |
| Page: 1 |
| Pathway ID | Tissue | Disease Stage | Description | Gene Ratio | Bg Ratio | pvalue | p.adjust | qvalue | Count |
| hsa052169 | Breast | IDC | Thyroid cancer | 9/867 | 37/8465 | 1.06e-02 | 4.92e-02 | 3.68e-02 | 9 |
| hsa0521614 | Breast | IDC | Thyroid cancer | 9/867 | 37/8465 | 1.06e-02 | 4.92e-02 | 3.68e-02 | 9 |
| hsa0521624 | Breast | DCIS | Thyroid cancer | 9/846 | 37/8465 | 9.07e-03 | 4.13e-02 | 3.04e-02 | 9 |
| hsa0521634 | Breast | DCIS | Thyroid cancer | 9/846 | 37/8465 | 9.07e-03 | 4.13e-02 | 3.04e-02 | 9 |
| hsa05216 | Colorectum | AD | Thyroid cancer | 21/2092 | 37/8465 | 3.05e-05 | 2.76e-04 | 1.76e-04 | 21 |
| hsa052161 | Colorectum | AD | Thyroid cancer | 21/2092 | 37/8465 | 3.05e-05 | 2.76e-04 | 1.76e-04 | 21 |
| hsa052162 | Colorectum | MSS | Thyroid cancer | 21/1875 | 37/8465 | 4.98e-06 | 6.00e-05 | 3.68e-05 | 21 |
| hsa052163 | Colorectum | MSS | Thyroid cancer | 21/1875 | 37/8465 | 4.98e-06 | 6.00e-05 | 3.68e-05 | 21 |
| hsa052164 | Colorectum | FAP | Thyroid cancer | 12/1404 | 37/8465 | 1.33e-02 | 4.46e-02 | 2.71e-02 | 12 |
| hsa052165 | Colorectum | FAP | Thyroid cancer | 12/1404 | 37/8465 | 1.33e-02 | 4.46e-02 | 2.71e-02 | 12 |
| hsa0521610 | Endometrium | AEH | Thyroid cancer | 12/1197 | 37/8465 | 3.68e-03 | 2.14e-02 | 1.56e-02 | 12 |
| hsa0521615 | Endometrium | AEH | Thyroid cancer | 12/1197 | 37/8465 | 3.68e-03 | 2.14e-02 | 1.56e-02 | 12 |
| hsa0521625 | Endometrium | EEC | Thyroid cancer | 13/1237 | 37/8465 | 1.51e-03 | 9.55e-03 | 7.12e-03 | 13 |
| hsa0521635 | Endometrium | EEC | Thyroid cancer | 13/1237 | 37/8465 | 1.51e-03 | 9.55e-03 | 7.12e-03 | 13 |
| hsa0521620 | Esophagus | HGIN | Thyroid cancer | 13/1383 | 37/8465 | 4.20e-03 | 3.04e-02 | 2.41e-02 | 13 |
| hsa05216110 | Esophagus | HGIN | Thyroid cancer | 13/1383 | 37/8465 | 4.20e-03 | 3.04e-02 | 2.41e-02 | 13 |
| hsa0521628 | Esophagus | ESCC | Thyroid cancer | 32/4205 | 37/8465 | 2.98e-06 | 1.72e-05 | 8.81e-06 | 32 |
| hsa0521638 | Esophagus | ESCC | Thyroid cancer | 32/4205 | 37/8465 | 2.98e-06 | 1.72e-05 | 8.81e-06 | 32 |
| hsa052167 | Liver | Cirrhotic | Thyroid cancer | 23/2530 | 37/8465 | 4.63e-05 | 3.28e-04 | 2.02e-04 | 23 |
| hsa0521612 | Liver | Cirrhotic | Thyroid cancer | 23/2530 | 37/8465 | 4.63e-05 | 3.28e-04 | 2.02e-04 | 23 |
| Page: 1 2 |
Top |
Cell-cell communication analysis |
| Identification of potential cell-cell interactions between two cell types and their ligand-receptor pairs for different disease states |
| Ligand | Receptor | LRpair | Pathway | Tissue | Disease Stage |
| Page: 1 |
Top |
Single-cell gene regulatory network inference analysis |
| Find out the significant the regulons (TFs) and the target genes of each regulon across cell types for different disease states |
| TF | Cell Type | Tissue | Disease Stage | Target Gene | RSS | Regulon Activity |
| ∗The dot plots of a searched regulon are shown for all cell subpopulations in each disease state of each tissue based on the regulon specific score inferred using pySCENIC and by calculating the average expression. |
| Page: 1 |
Top |
Somatic mutation of malignant transformation related genes |
| Annotation of somatic variants for genes involved in malignant transformation |
| Hugo Symbol | Variant Class | Variant Classification | dbSNP RS | HGVSc | HGVSp | HGVSp Short | SWISSPROT | BIOTYPE | SIFT | PolyPhen | Tumor Sample Barcode | Tissue | Histology | Sex | Age | Stage | Therapy Types | Drugs | Outcome |
| CCDC6 | SNV | Missense_Mutation | c.1273N>T | p.Arg425Trp | p.R425W | Q16204 | protein_coding | deleterious_low_confidence(0) | probably_damaging(0.982) | TCGA-EW-A1J3-01 | Breast | breast invasive carcinoma | Female | <65 | I/II | Chemotherapy | carboplatin | SD | |
| CCDC6 | insertion | Frame_Shift_Ins | novel | c.921_922insAT | p.Leu308IlefsTer23 | p.L308Ifs*23 | Q16204 | protein_coding | TCGA-A8-A08H-01 | Breast | breast invasive carcinoma | Female | >=65 | I/II | Unknown | Unknown | SD | ||
| CCDC6 | insertion | Frame_Shift_Ins | novel | c.920_921insCGCTGTT | p.Lys307AsnfsTer22 | p.K307Nfs*22 | Q16204 | protein_coding | TCGA-A8-A08H-01 | Breast | breast invasive carcinoma | Female | >=65 | I/II | Unknown | Unknown | SD | ||
| CCDC6 | SNV | Missense_Mutation | novel | c.533T>C | p.Ile178Thr | p.I178T | Q16204 | protein_coding | deleterious(0) | probably_damaging(0.998) | TCGA-2W-A8YY-01 | Cervix | cervical & endocervical cancer | Female | <65 | I/II | Chemotherapy | cisplatin | CR |
| CCDC6 | SNV | Missense_Mutation | novel | c.1043N>A | p.Arg348His | p.R348H | Q16204 | protein_coding | deleterious(0.03) | probably_damaging(0.976) | TCGA-C5-A2LY-01 | Cervix | cervical & endocervical cancer | Female | <65 | I/II | Chemotherapy | cisplatin | SD |
| CCDC6 | SNV | Missense_Mutation | novel | c.1280C>T | p.Thr427Met | p.T427M | Q16204 | protein_coding | deleterious_low_confidence(0) | probably_damaging(0.99) | TCGA-C5-A907-01 | Cervix | cervical & endocervical cancer | Female | <65 | I/II | Chemotherapy | cisplatin | SD |
| CCDC6 | SNV | Missense_Mutation | c.891N>A | p.Met297Ile | p.M297I | Q16204 | protein_coding | tolerated(1) | benign(0.007) | TCGA-IR-A3LI-01 | Cervix | cervical & endocervical cancer | Female | <65 | I/II | Chemotherapy | cisplatin | CR | |
| CCDC6 | SNV | Missense_Mutation | novel | c.1267T>A | p.Phe423Ile | p.F423I | Q16204 | protein_coding | deleterious(0) | probably_damaging(0.916) | TCGA-AA-3947-01 | Colorectum | colon adenocarcinoma | Female | <65 | I/II | Unknown | Unknown | SD |
| CCDC6 | SNV | Missense_Mutation | novel | c.1403N>T | p.Ala468Val | p.A468V | Q16204 | protein_coding | tolerated_low_confidence(1) | benign(0) | TCGA-AA-3984-01 | Colorectum | colon adenocarcinoma | Female | <65 | I/II | Unknown | Unknown | SD |
| CCDC6 | SNV | Missense_Mutation | c.589N>T | p.Arg197Trp | p.R197W | Q16204 | protein_coding | deleterious(0) | probably_damaging(0.997) | TCGA-AD-A5EJ-01 | Colorectum | colon adenocarcinoma | Female | >=65 | I/II | Unknown | Unknown | SD |
| Page: 1 2 3 4 5 |
Top |
Related drugs of malignant transformation related genes |
| Identification of chemicals and drugs interact with genes involved in malignant transfromation |
| (DGIdb 4.0) |
| Entrez ID | Symbol | Category | Interaction Types | Drug Claim Name | Drug Name | PMIDs |
| Page: 1 |

Copyright 2023-Present -The University of Texas Health Science Center at Houston |