
|
|||||
|
 | |
| |
| |
| |
| |
| |
|
Gene: CASD1 |
Gene summary for CASD1 |
| Gene information | Species | Human | Gene symbol | CASD1 | Gene ID | 64921 |
| Gene name | CAS1 domain containing 1 | |
| Gene Alias | C7orf12 | |
| Cytomap | 7q21.3 | |
| Gene Type | protein-coding | GO ID | GO:0005975 | UniProtAcc | Q8WZ77 |
Top |
Malignant transformation analysis |
| Identification of the aberrant gene expression in precancerous and cancerous lesions by comparing the gene expression of stem-like cells in diseased tissues with normal stem cells |
| Entrez ID | Symbol | Replicates | Species | Organ | Tissue | Adj P-value | Log2FC | Malignancy |
| 64921 | CASD1 | A018-E-020 | Human | Colorectum | FAP | 2.19e-17 | -5.13e-01 | -0.2034 |
| 64921 | CASD1 | F034 | Human | Colorectum | FAP | 2.18e-20 | -4.46e-01 | -0.0665 |
| 64921 | CASD1 | F072B | Human | Colorectum | FAP | 4.51e-03 | -1.44e-01 | 0.257 |
| 64921 | CASD1 | CRC-3-11773 | Human | Colorectum | CRC | 2.11e-16 | -5.25e-01 | 0.2564 |
| 64921 | CASD1 | HCC1_Meng | Human | Liver | HCC | 9.54e-27 | 3.00e-02 | 0.0246 |
| 64921 | CASD1 | HCC2_Meng | Human | Liver | HCC | 1.18e-08 | 5.24e-02 | 0.0107 |
| 64921 | CASD1 | HCC1 | Human | Liver | HCC | 2.04e-03 | 3.31e+00 | 0.5336 |
| 64921 | CASD1 | HCC2 | Human | Liver | HCC | 4.78e-04 | 1.87e+00 | 0.5341 |
| 64921 | CASD1 | HTA12-15-2 | Human | Pancreas | PDAC | 6.47e-03 | 4.73e-01 | 0.2315 |
| 64921 | CASD1 | HTA12-25-1 | Human | Pancreas | PDAC | 3.81e-02 | 4.81e-01 | 0.313 |
| 64921 | CASD1 | HTA12-26-1 | Human | Pancreas | PDAC | 1.61e-13 | 7.00e-01 | 0.3728 |
| 64921 | CASD1 | HTA12-29-1 | Human | Pancreas | PDAC | 2.08e-30 | 6.78e-01 | 0.3722 |
| 64921 | CASD1 | male-WTA | Human | Thyroid | PTC | 1.69e-18 | 1.55e-01 | 0.1037 |
| 64921 | CASD1 | PTC01 | Human | Thyroid | PTC | 1.51e-06 | 6.22e-02 | 0.1899 |
| 64921 | CASD1 | PTC03 | Human | Thyroid | PTC | 3.38e-03 | 1.95e-01 | 0.1784 |
| 64921 | CASD1 | PTC04 | Human | Thyroid | PTC | 8.27e-22 | 3.28e-01 | 0.1927 |
| 64921 | CASD1 | PTC05 | Human | Thyroid | PTC | 2.67e-16 | 6.23e-01 | 0.2065 |
| 64921 | CASD1 | PTC06 | Human | Thyroid | PTC | 4.59e-30 | 7.02e-01 | 0.2057 |
| 64921 | CASD1 | PTC07 | Human | Thyroid | PTC | 2.12e-31 | 4.88e-01 | 0.2044 |
| 64921 | CASD1 | ATC12 | Human | Thyroid | ATC | 5.84e-09 | 3.76e-02 | 0.34 |
| Page: 1 2 3 4 |
| Tissue | Expression Dynamics | Abbreviation |
| Colorectum (GSE201348) |  | FAP: Familial adenomatous polyposis |
| CRC: Colorectal cancer | ||
| Colorectum (HTA11) |  | AD: Adenomas |
| SER: Sessile serrated lesions | ||
| MSI-H: Microsatellite-high colorectal cancer | ||
| MSS: Microsatellite stable colorectal cancer | ||
| Liver | 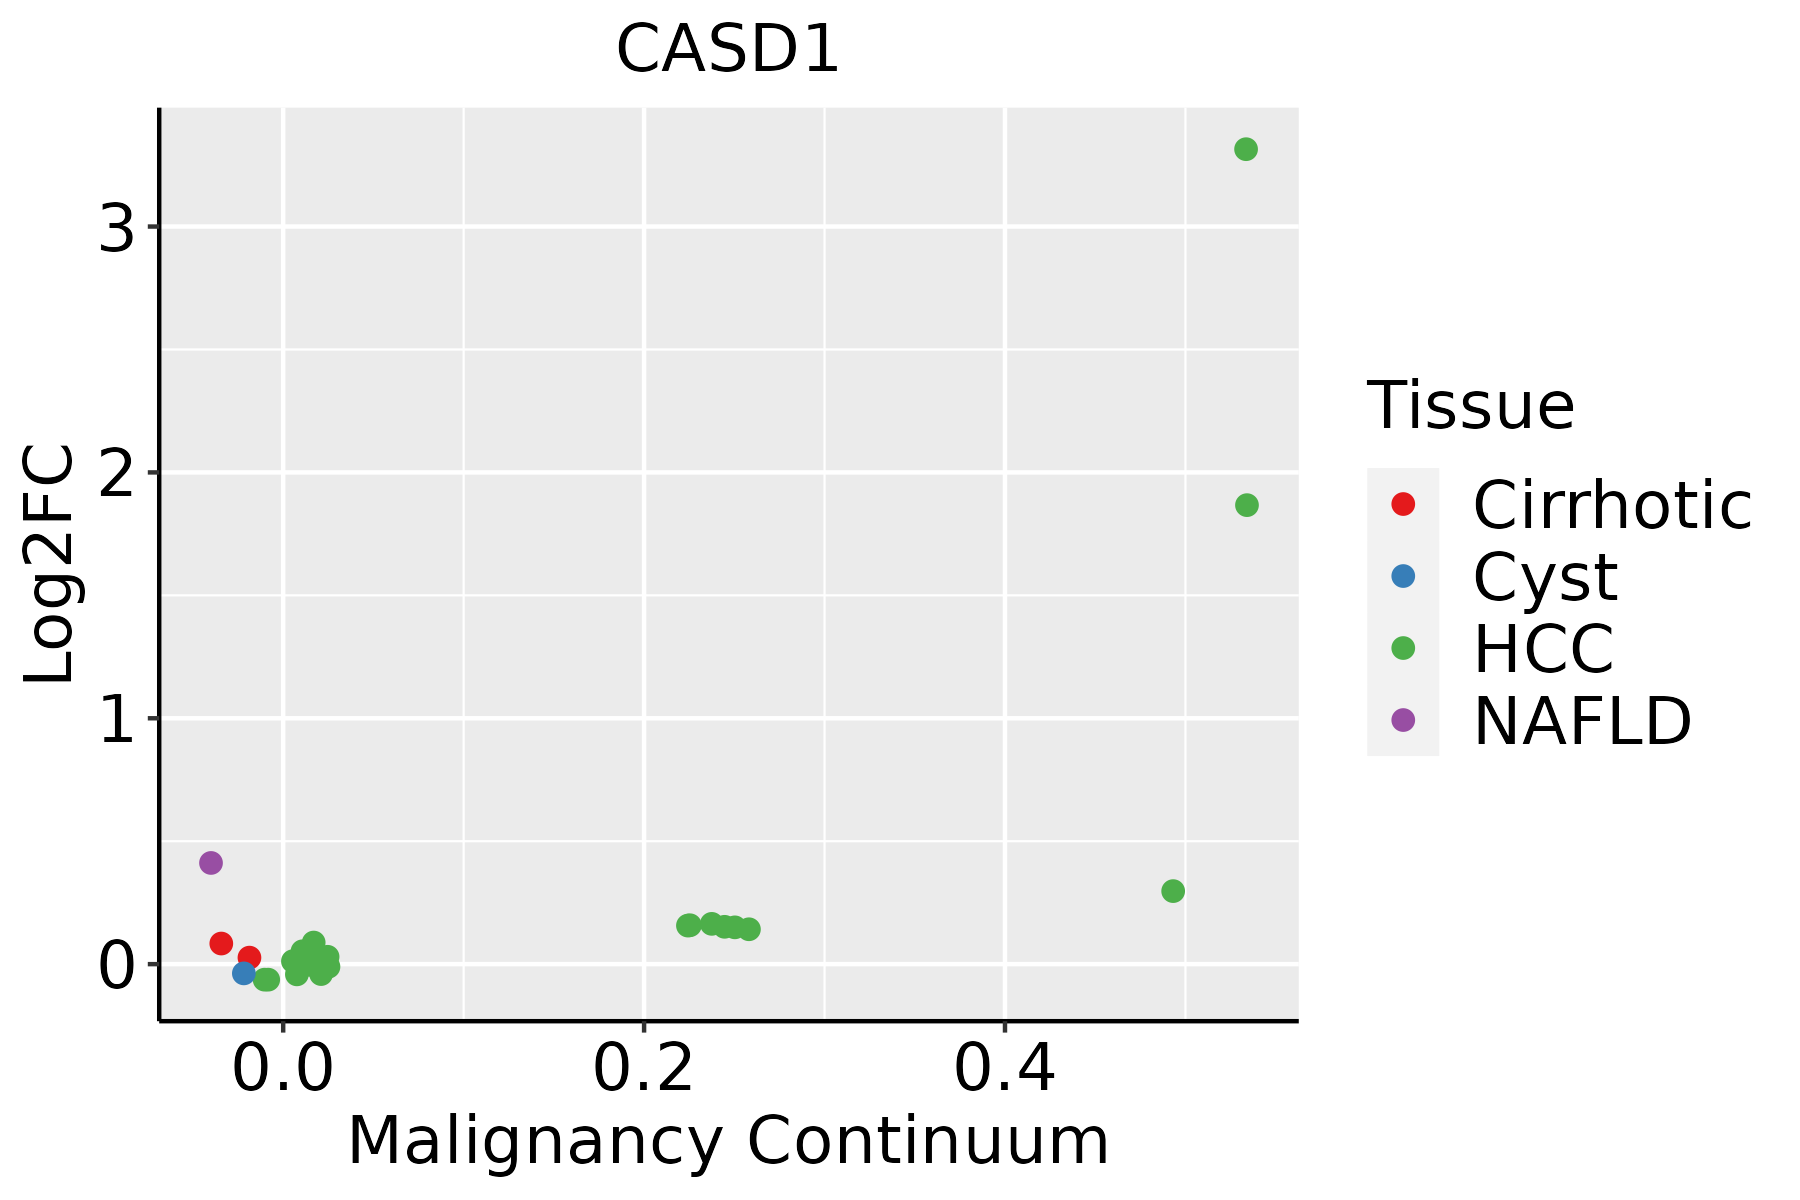 | HCC: Hepatocellular carcinoma |
| NAFLD: Non-alcoholic fatty liver disease | ||
| Thyroid |  | ATC: Anaplastic thyroid cancer |
| HT: Hashimoto's thyroiditis | ||
| PTC: Papillary thyroid cancer |
| ∗log2FC in expression of this searched gene in stem-like cells from each diseased tissue sample relative to stem-like cells in normal samples in each tissue plotted against the malignancy continuum. Samples are colored based on if they are from different disease stage. |
Top |
Malignant transformation related pathway analysis |
| Find out the enriched GO biological processes and KEGG pathways involved in transition from healthy to precancer to cancer |
| Tissue | Disease Stage | Enriched GO biological Processes |
| Colorectum | AD |  |
| Colorectum | SER |  |
| Colorectum | MSS |  |
| Colorectum | MSI-H |  |
| Colorectum | FAP |  |
| ∗Top 15 enriched GO BP terms are showed in the bar plot of each disease state in each tissue. Each row represents a significant GO biological process which is colored according to the -log10(p.adjust). |
| Page: 1 2 3 4 5 6 7 8 9 |
| GO ID | Tissue | Disease Stage | Description | Gene Ratio | Bg Ratio | pvalue | p.adjust | Count |
| Page: 1 |
| Pathway ID | Tissue | Disease Stage | Description | Gene Ratio | Bg Ratio | pvalue | p.adjust | qvalue | Count |
| Page: 1 |
Top |
Cell-cell communication analysis |
| Identification of potential cell-cell interactions between two cell types and their ligand-receptor pairs for different disease states |
| Ligand | Receptor | LRpair | Pathway | Tissue | Disease Stage |
| Page: 1 |
Top |
Single-cell gene regulatory network inference analysis |
| Find out the significant the regulons (TFs) and the target genes of each regulon across cell types for different disease states |
| TF | Cell Type | Tissue | Disease Stage | Target Gene | RSS | Regulon Activity |
| ∗The dot plots of a searched regulon are shown for all cell subpopulations in each disease state of each tissue based on the regulon specific score inferred using pySCENIC and by calculating the average expression. |
| Page: 1 |
Top |
Somatic mutation of malignant transformation related genes |
| Annotation of somatic variants for genes involved in malignant transformation |
| Hugo Symbol | Variant Class | Variant Classification | dbSNP RS | HGVSc | HGVSp | HGVSp Short | SWISSPROT | BIOTYPE | SIFT | PolyPhen | Tumor Sample Barcode | Tissue | Histology | Sex | Age | Stage | Therapy Types | Drugs | Outcome |
| CASD1 | SNV | Missense_Mutation | novel | c.51N>A | p.Phe17Leu | p.F17L | Q96PB1 | protein_coding | tolerated(0.29) | benign(0.074) | TCGA-5L-AAT1-01 | Breast | breast invasive carcinoma | Female | <65 | III/IV | Hormone Therapy | letrozol | SD |
| CASD1 | SNV | Missense_Mutation | novel | c.183G>T | p.Glu61Asp | p.E61D | Q96PB1 | protein_coding | tolerated(1) | benign(0.003) | TCGA-AN-A046-01 | Breast | breast invasive carcinoma | Female | >=65 | I/II | Unknown | Unknown | SD |
| CASD1 | SNV | Missense_Mutation | rs761691839 | c.1291N>G | p.Thr431Ala | p.T431A | Q96PB1 | protein_coding | deleterious(0.01) | probably_damaging(0.994) | TCGA-EW-A1PH-01 | Breast | breast invasive carcinoma | Female | <65 | I/II | Chemotherapy | cyclophosphamide | SD |
| CASD1 | SNV | Missense_Mutation | c.100N>T | p.Ala34Ser | p.A34S | Q96PB1 | protein_coding | tolerated(0.2) | benign(0) | TCGA-EK-A2PM-01 | Cervix | cervical & endocervical cancer | Female | >=65 | I/II | Unknown | Unknown | SD | |
| CASD1 | SNV | Missense_Mutation | c.1615A>C | p.Ile539Leu | p.I539L | Q96PB1 | protein_coding | tolerated(0.51) | benign(0) | TCGA-FU-A3HZ-01 | Cervix | cervical & endocervical cancer | Female | <65 | I/II | Chemotherapy | cisplatin | CR | |
| CASD1 | SNV | Missense_Mutation | novel | c.1872N>T | p.Gln624His | p.Q624H | Q96PB1 | protein_coding | tolerated(0.15) | probably_damaging(0.983) | TCGA-VS-AA62-01 | Cervix | cervical & endocervical cancer | Female | <65 | I/II | Chemotherapy | cisplatin | PD |
| CASD1 | SNV | Missense_Mutation | rs780697479 | c.1486N>T | p.Arg496Cys | p.R496C | Q96PB1 | protein_coding | deleterious(0) | probably_damaging(0.92) | TCGA-A6-6141-01 | Colorectum | colon adenocarcinoma | Male | <65 | I/II | Chemotherapy | 5-fu | SD |
| CASD1 | SNV | Missense_Mutation | novel | c.965T>C | p.Leu322Ser | p.L322S | Q96PB1 | protein_coding | tolerated(0.09) | benign(0.007) | TCGA-AA-3814-01 | Colorectum | colon adenocarcinoma | Female | >=65 | I/II | Unknown | Unknown | SD |
| CASD1 | SNV | Missense_Mutation | c.1375N>T | p.His459Tyr | p.H459Y | Q96PB1 | protein_coding | deleterious(0) | probably_damaging(0.989) | TCGA-AA-3966-01 | Colorectum | colon adenocarcinoma | Female | >=65 | I/II | Unknown | Unknown | SD | |
| CASD1 | SNV | Missense_Mutation | novel | c.1106A>C | p.Gln369Pro | p.Q369P | Q96PB1 | protein_coding | tolerated(0.19) | benign(0.266) | TCGA-AA-3984-01 | Colorectum | colon adenocarcinoma | Female | <65 | I/II | Unknown | Unknown | SD |
| Page: 1 2 3 4 5 6 7 8 9 10 11 12 |
Top |
Related drugs of malignant transformation related genes |
| Identification of chemicals and drugs interact with genes involved in malignant transfromation |
| (DGIdb 4.0) |
| Entrez ID | Symbol | Category | Interaction Types | Drug Claim Name | Drug Name | PMIDs |
| Page: 1 |

Copyright 2023-Present -The University of Texas Health Science Center at Houston |