
|
|||||
|
 | |
| |
| |
| |
| |
| |
|
Gene: CASC4 |
Gene summary for CASC4 |
| Gene information | Species | Human | Gene symbol | CASC4 | Gene ID | 113201 |
| Gene name | golgi membrane protein 2 | |
| Gene Alias | CASC4 | |
| Cytomap | 15q15.3 | |
| Gene Type | protein-coding | GO ID | GO:0005575 | UniProtAcc | Q6P4E1 |
Top |
Malignant transformation analysis |
| Identification of the aberrant gene expression in precancerous and cancerous lesions by comparing the gene expression of stem-like cells in diseased tissues with normal stem cells |
| Entrez ID | Symbol | Replicates | Species | Organ | Tissue | Adj P-value | Log2FC | Malignancy |
| 113201 | CASC4 | A002-C-203 | Human | Colorectum | FAP | 6.01e-03 | 3.95e-02 | 0.2786 |
| 113201 | CASC4 | A001-C-119 | Human | Colorectum | FAP | 2.14e-04 | -1.73e-01 | -0.1557 |
| 113201 | CASC4 | A001-C-108 | Human | Colorectum | FAP | 5.15e-17 | -6.66e-02 | -0.0272 |
| 113201 | CASC4 | A002-C-205 | Human | Colorectum | FAP | 1.51e-20 | -1.84e-01 | -0.1236 |
| 113201 | CASC4 | A001-C-104 | Human | Colorectum | FAP | 1.41e-02 | -6.60e-04 | 0.0184 |
| 113201 | CASC4 | A015-C-005 | Human | Colorectum | FAP | 1.73e-02 | -1.18e-01 | -0.0336 |
| 113201 | CASC4 | A015-C-006 | Human | Colorectum | FAP | 5.84e-13 | -3.04e-01 | -0.0994 |
| 113201 | CASC4 | A015-C-106 | Human | Colorectum | FAP | 1.15e-09 | -2.11e-01 | -0.0511 |
| 113201 | CASC4 | A002-C-114 | Human | Colorectum | FAP | 1.87e-15 | -3.15e-01 | -0.1561 |
| 113201 | CASC4 | A015-C-104 | Human | Colorectum | FAP | 1.47e-32 | -3.68e-01 | -0.1899 |
| 113201 | CASC4 | A001-C-014 | Human | Colorectum | FAP | 2.80e-13 | -1.01e-01 | 0.0135 |
| 113201 | CASC4 | A002-C-016 | Human | Colorectum | FAP | 2.79e-23 | -3.20e-01 | 0.0521 |
| 113201 | CASC4 | A015-C-002 | Human | Colorectum | FAP | 7.48e-11 | -1.86e-01 | -0.0763 |
| 113201 | CASC4 | A001-C-203 | Human | Colorectum | FAP | 1.02e-09 | -8.32e-02 | -0.0481 |
| 113201 | CASC4 | A002-C-116 | Human | Colorectum | FAP | 1.21e-35 | -2.90e-01 | -0.0452 |
| 113201 | CASC4 | A014-C-008 | Human | Colorectum | FAP | 2.00e-15 | -2.78e-01 | -0.191 |
| 113201 | CASC4 | A018-E-020 | Human | Colorectum | FAP | 1.24e-18 | -2.66e-01 | -0.2034 |
| 113201 | CASC4 | F034 | Human | Colorectum | FAP | 1.58e-18 | -2.24e-01 | -0.0665 |
| 113201 | CASC4 | F072B | Human | Colorectum | FAP | 4.80e-06 | 5.07e-02 | 0.257 |
| 113201 | CASC4 | CRC-1-8810 | Human | Colorectum | CRC | 2.08e-20 | -4.46e-01 | 0.6257 |
| Page: 1 2 3 4 5 6 7 8 9 |
| Tissue | Expression Dynamics | Abbreviation |
| Colorectum (GSE201348) |  | FAP: Familial adenomatous polyposis |
| CRC: Colorectal cancer | ||
| Colorectum (HTA11) |  | AD: Adenomas |
| SER: Sessile serrated lesions | ||
| MSI-H: Microsatellite-high colorectal cancer | ||
| MSS: Microsatellite stable colorectal cancer | ||
| Esophagus |  | ESCC: Esophageal squamous cell carcinoma |
| HGIN: High-grade intraepithelial neoplasias | ||
| LGIN: Low-grade intraepithelial neoplasias | ||
| Liver |  | HCC: Hepatocellular carcinoma |
| NAFLD: Non-alcoholic fatty liver disease | ||
| Prostate | 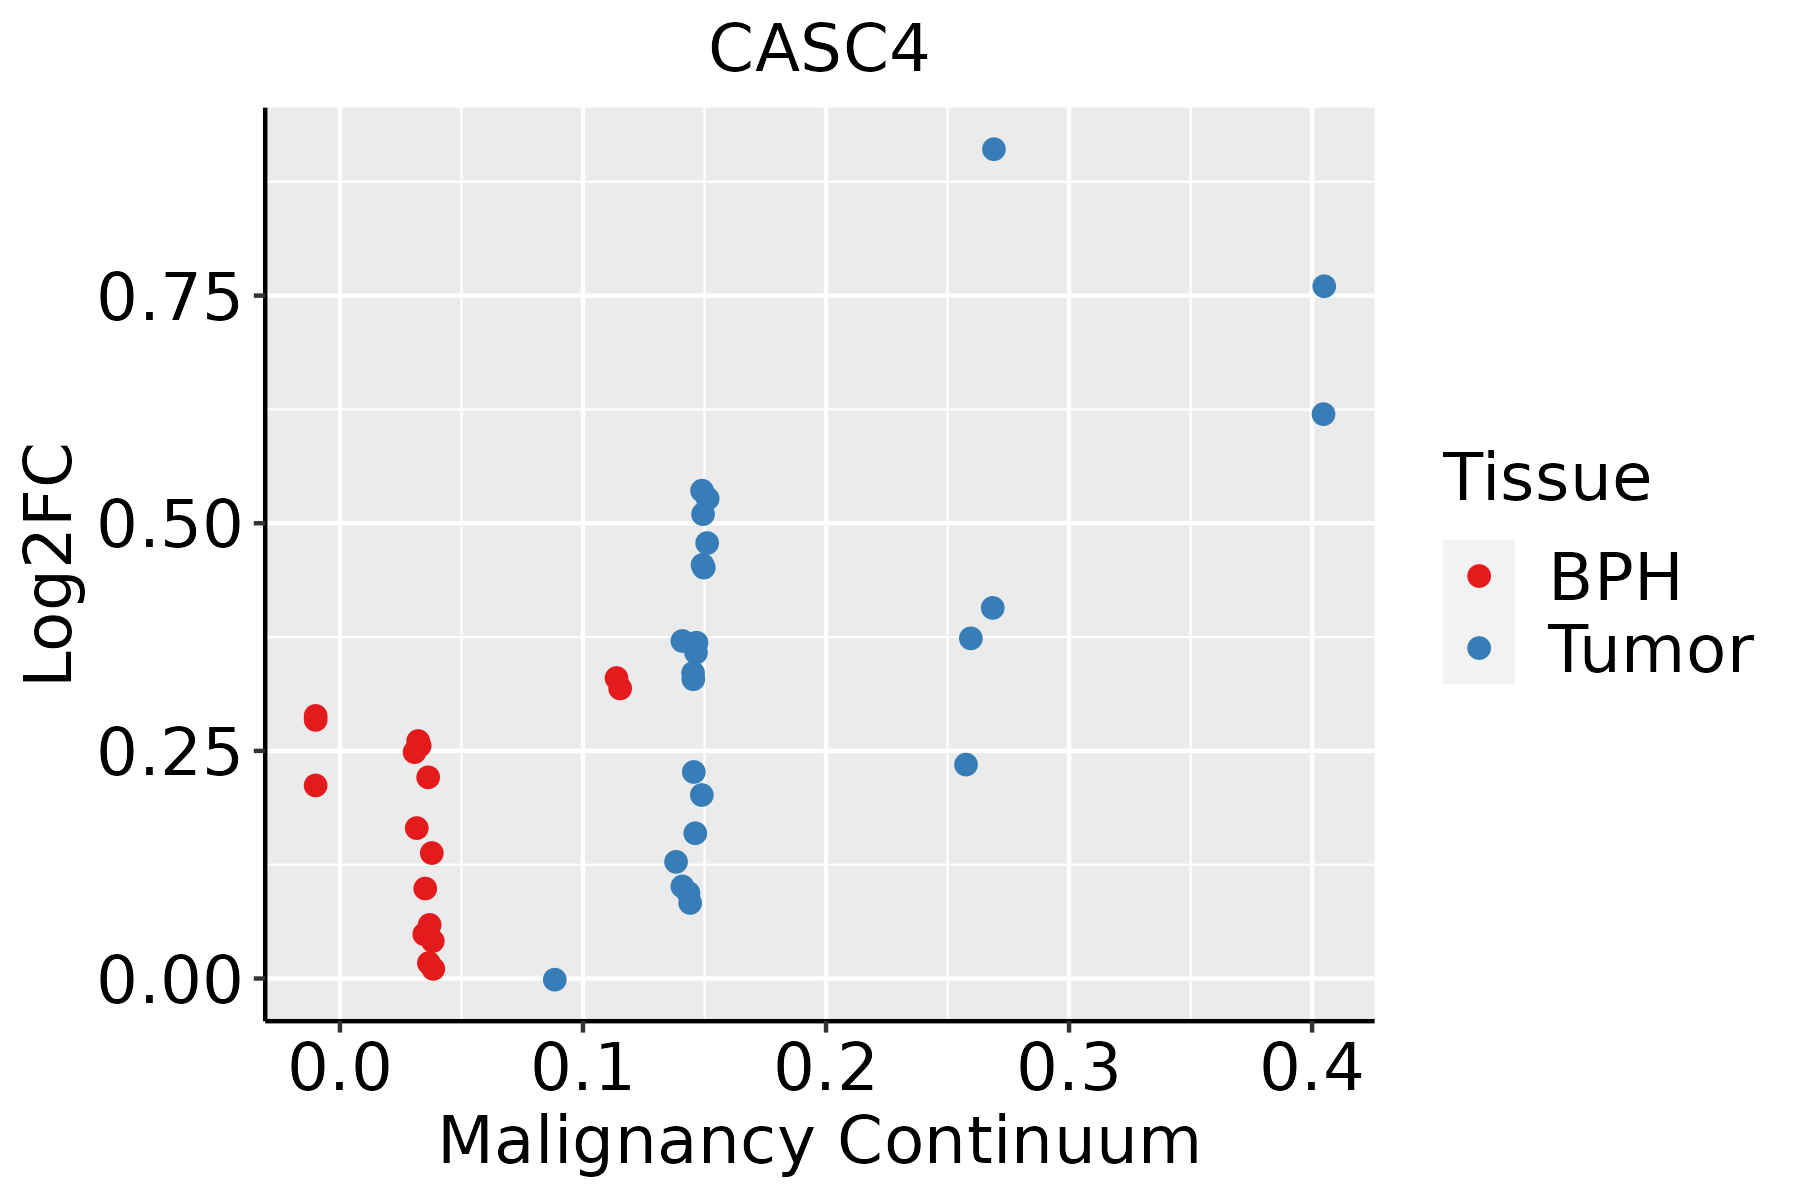 | BPH: Benign Prostatic Hyperplasia |
| Thyroid | 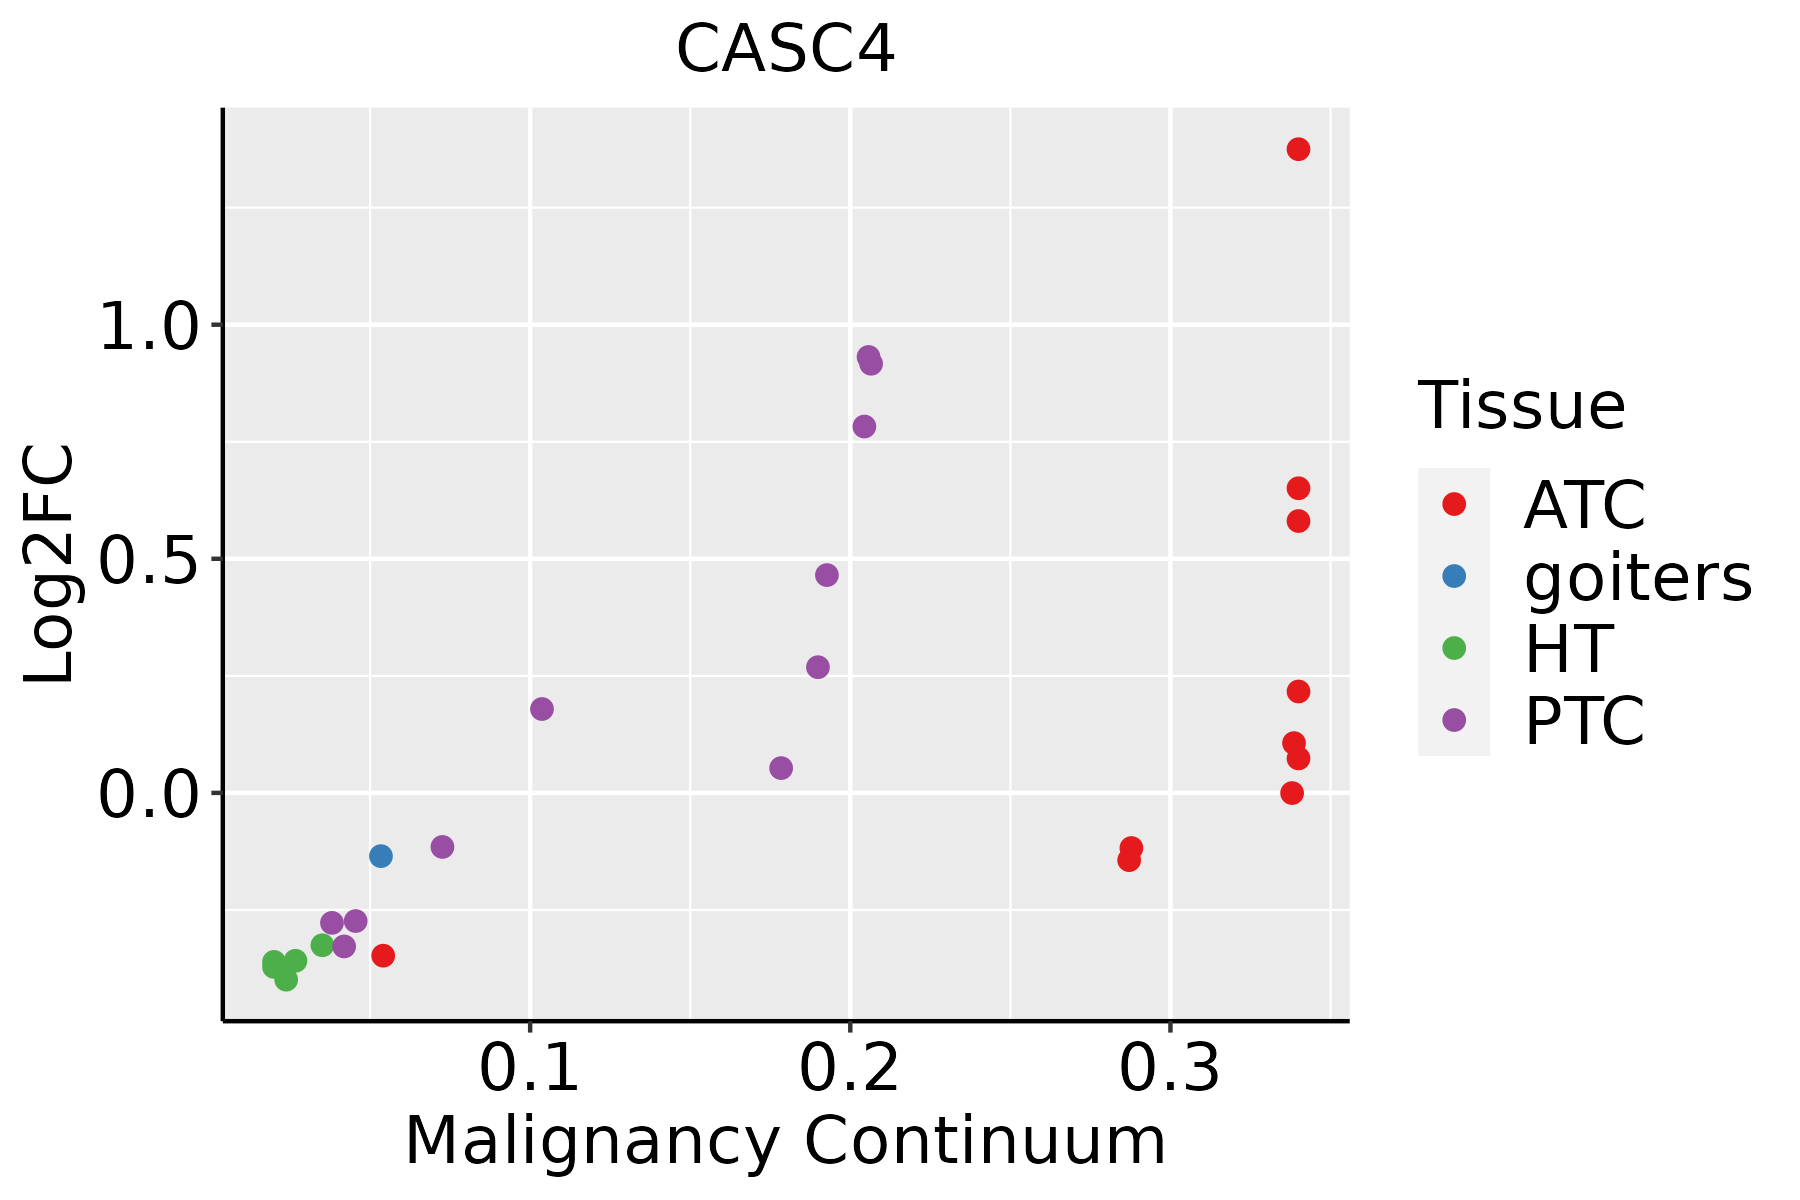 | ATC: Anaplastic thyroid cancer |
| HT: Hashimoto's thyroiditis | ||
| PTC: Papillary thyroid cancer |
| ∗log2FC in expression of this searched gene in stem-like cells from each diseased tissue sample relative to stem-like cells in normal samples in each tissue plotted against the malignancy continuum. Samples are colored based on if they are from different disease stage. |
Top |
Malignant transformation related pathway analysis |
| Find out the enriched GO biological processes and KEGG pathways involved in transition from healthy to precancer to cancer |
| Tissue | Disease Stage | Enriched GO biological Processes |
| Colorectum | AD |  |
| Colorectum | SER |  |
| Colorectum | MSS |  |
| Colorectum | MSI-H |  |
| Colorectum | FAP |  |
| ∗Top 15 enriched GO BP terms are showed in the bar plot of each disease state in each tissue. Each row represents a significant GO biological process which is colored according to the -log10(p.adjust). |
| Page: 1 2 3 4 5 6 7 8 9 |
| GO ID | Tissue | Disease Stage | Description | Gene Ratio | Bg Ratio | pvalue | p.adjust | Count |
| Page: 1 |
| Pathway ID | Tissue | Disease Stage | Description | Gene Ratio | Bg Ratio | pvalue | p.adjust | qvalue | Count |
| Page: 1 |
Top |
Cell-cell communication analysis |
| Identification of potential cell-cell interactions between two cell types and their ligand-receptor pairs for different disease states |
| Ligand | Receptor | LRpair | Pathway | Tissue | Disease Stage |
| Page: 1 |
Top |
Single-cell gene regulatory network inference analysis |
| Find out the significant the regulons (TFs) and the target genes of each regulon across cell types for different disease states |
| TF | Cell Type | Tissue | Disease Stage | Target Gene | RSS | Regulon Activity |
| ∗The dot plots of a searched regulon are shown for all cell subpopulations in each disease state of each tissue based on the regulon specific score inferred using pySCENIC and by calculating the average expression. |
| Page: 1 |
Top |
Somatic mutation of malignant transformation related genes |
| Annotation of somatic variants for genes involved in malignant transformation |
| Hugo Symbol | Variant Class | Variant Classification | dbSNP RS | HGVSc | HGVSp | HGVSp Short | SWISSPROT | BIOTYPE | SIFT | PolyPhen | Tumor Sample Barcode | Tissue | Histology | Sex | Age | Stage | Therapy Types | Drugs | Outcome |
| CASC4 | SNV | Missense_Mutation | c.631C>G | p.Gln211Glu | p.Q211E | Q6P4E1 | protein_coding | tolerated(0.79) | benign(0.009) | TCGA-A8-A075-01 | Breast | breast invasive carcinoma | Female | <65 | I/II | Chemotherapy | epirubicin | CR | |
| CASC4 | SNV | Missense_Mutation | c.1037N>G | p.Lys346Arg | p.K346R | Q6P4E1 | protein_coding | tolerated(0.17) | benign(0.005) | TCGA-AC-A2FG-01 | Breast | breast invasive carcinoma | Female | >=65 | I/II | Hormone Therapy | arimidex | CR | |
| CASC4 | SNV | Missense_Mutation | novel | c.77N>C | p.Val26Ala | p.V26A | Q6P4E1 | protein_coding | tolerated(1) | benign(0) | TCGA-BH-A0HK-01 | Breast | breast invasive carcinoma | Female | >=65 | I/II | Hormone Therapy | arimidex | SD |
| CASC4 | SNV | Missense_Mutation | c.349N>A | p.Ser117Thr | p.S117T | Q6P4E1 | protein_coding | tolerated(0.57) | probably_damaging(0.961) | TCGA-E9-A1R7-01 | Breast | breast invasive carcinoma | Female | <65 | I/II | Hormone Therapy | fareston | SD | |
| CASC4 | SNV | Missense_Mutation | novel | c.56N>G | p.Val19Gly | p.V19G | Q6P4E1 | protein_coding | deleterious(0) | benign(0.073) | TCGA-2W-A8YY-01 | Cervix | cervical & endocervical cancer | Female | <65 | I/II | Chemotherapy | cisplatin | CR |
| CASC4 | SNV | Missense_Mutation | novel | c.1212N>G | p.Asp404Glu | p.D404E | Q6P4E1 | protein_coding | deleterious(0) | probably_damaging(0.996) | TCGA-A6-5665-01 | Colorectum | colon adenocarcinoma | Female | >=65 | I/II | Unknown | Unknown | PD |
| CASC4 | SNV | Missense_Mutation | c.582G>T | p.Glu194Asp | p.E194D | Q6P4E1 | protein_coding | tolerated(0.37) | benign(0.003) | TCGA-AA-A010-01 | Colorectum | colon adenocarcinoma | Female | <65 | I/II | Chemotherapy | folinic | CR | |
| CASC4 | SNV | Missense_Mutation | c.301N>A | p.Leu101Ile | p.L101I | Q6P4E1 | protein_coding | tolerated(0.21) | benign(0.003) | TCGA-NH-A5IV-01 | Colorectum | colon adenocarcinoma | Female | >=65 | I/II | Unknown | Unknown | SD | |
| CASC4 | SNV | Missense_Mutation | novel | c.576G>T | p.Lys192Asn | p.K192N | Q6P4E1 | protein_coding | deleterious(0.01) | probably_damaging(0.99) | TCGA-AG-3892-01 | Colorectum | rectum adenocarcinoma | Female | <65 | I/II | Unknown | Unknown | SD |
| CASC4 | SNV | Missense_Mutation | c.525N>T | p.Gln175His | p.Q175H | Q6P4E1 | protein_coding | deleterious(0) | probably_damaging(0.989) | TCGA-A5-A1OF-01 | Endometrium | uterine corpus endometrioid carcinoma | Female | <65 | I/II | Unknown | Unknown | SD |
| Page: 1 2 3 4 |
Top |
Related drugs of malignant transformation related genes |
| Identification of chemicals and drugs interact with genes involved in malignant transfromation |
| (DGIdb 4.0) |
| Entrez ID | Symbol | Category | Interaction Types | Drug Claim Name | Drug Name | PMIDs |
| Page: 1 |

Copyright 2023-Present -The University of Texas Health Science Center at Houston |