
|
|||||
|
 | |
| |
| |
| |
| |
| |
|
Gene: CACYBP |
Gene summary for CACYBP |
| Gene information | Species | Human | Gene symbol | CACYBP | Gene ID | 27101 |
| Gene name | calcyclin binding protein | |
| Gene Alias | GIG5 | |
| Cytomap | 1q25.1 | |
| Gene Type | protein-coding | GO ID | GO:0006260 | UniProtAcc | Q9HB71 |
Top |
Malignant transformation analysis |
| Identification of the aberrant gene expression in precancerous and cancerous lesions by comparing the gene expression of stem-like cells in diseased tissues with normal stem cells |
| Entrez ID | Symbol | Replicates | Species | Organ | Tissue | Adj P-value | Log2FC | Malignancy |
| 27101 | CACYBP | GSM5276934 | Human | Endometrium | EEC | 8.52e-07 | -1.66e-01 | -0.0913 |
| 27101 | CACYBP | GSM5276935 | Human | Endometrium | EEC | 1.79e-23 | 5.91e-01 | -0.123 |
| 27101 | CACYBP | GSM5276937 | Human | Endometrium | EEC | 1.31e-05 | 2.33e-01 | -0.0897 |
| 27101 | CACYBP | GSM6177620_NYU_UCEC1_lib1_lib1 | Human | Endometrium | EEC | 3.73e-29 | -7.49e-03 | -0.1869 |
| 27101 | CACYBP | GSM6177620_NYU_UCEC1_lib2_lib2 | Human | Endometrium | EEC | 2.55e-32 | -1.27e-01 | -0.1875 |
| 27101 | CACYBP | GSM6177620_NYU_UCEC1_lib3_lib3 | Human | Endometrium | EEC | 1.06e-36 | 1.10e-01 | -0.1883 |
| 27101 | CACYBP | GSM6177621_NYU_UCEC2_lib1_lib1 | Human | Endometrium | EEC | 1.75e-38 | 4.44e-01 | -0.1934 |
| 27101 | CACYBP | GSM6177622_NYU_UCEC3_lib1_lib1 | Human | Endometrium | EEC | 5.00e-44 | -2.03e-01 | -0.1917 |
| 27101 | CACYBP | GSM6177622_NYU_UCEC3_lib2_lib2 | Human | Endometrium | EEC | 4.68e-45 | 5.21e-02 | -0.1916 |
| 27101 | CACYBP | GSM6177623_NYU_UCEC3_Vis | Human | Endometrium | EEC | 3.21e-06 | -1.57e-01 | -0.1269 |
| 27101 | CACYBP | LZE2T | Human | Esophagus | ESCC | 3.93e-08 | 1.66e+00 | 0.082 |
| 27101 | CACYBP | LZE4T | Human | Esophagus | ESCC | 1.55e-32 | 1.95e+00 | 0.0811 |
| 27101 | CACYBP | LZE7T | Human | Esophagus | ESCC | 6.61e-13 | 1.47e+00 | 0.0667 |
| 27101 | CACYBP | LZE8T | Human | Esophagus | ESCC | 2.96e-04 | 5.35e-01 | 0.067 |
| 27101 | CACYBP | LZE20T | Human | Esophagus | ESCC | 1.94e-02 | 4.73e-01 | 0.0662 |
| 27101 | CACYBP | LZE22D1 | Human | Esophagus | HGIN | 3.32e-03 | 1.47e-01 | 0.0595 |
| 27101 | CACYBP | LZE22T | Human | Esophagus | ESCC | 2.17e-11 | 2.13e+00 | 0.068 |
| 27101 | CACYBP | LZE24T | Human | Esophagus | ESCC | 2.75e-14 | 8.25e-01 | 0.0596 |
| 27101 | CACYBP | LZE21T | Human | Esophagus | ESCC | 1.30e-02 | 9.75e-01 | 0.0655 |
| 27101 | CACYBP | LZE6T | Human | Esophagus | ESCC | 5.50e-15 | 1.19e+00 | 0.0845 |
| Page: 1 2 3 4 5 6 7 8 9 10 11 12 |
| Tissue | Expression Dynamics | Abbreviation |
| Breast | 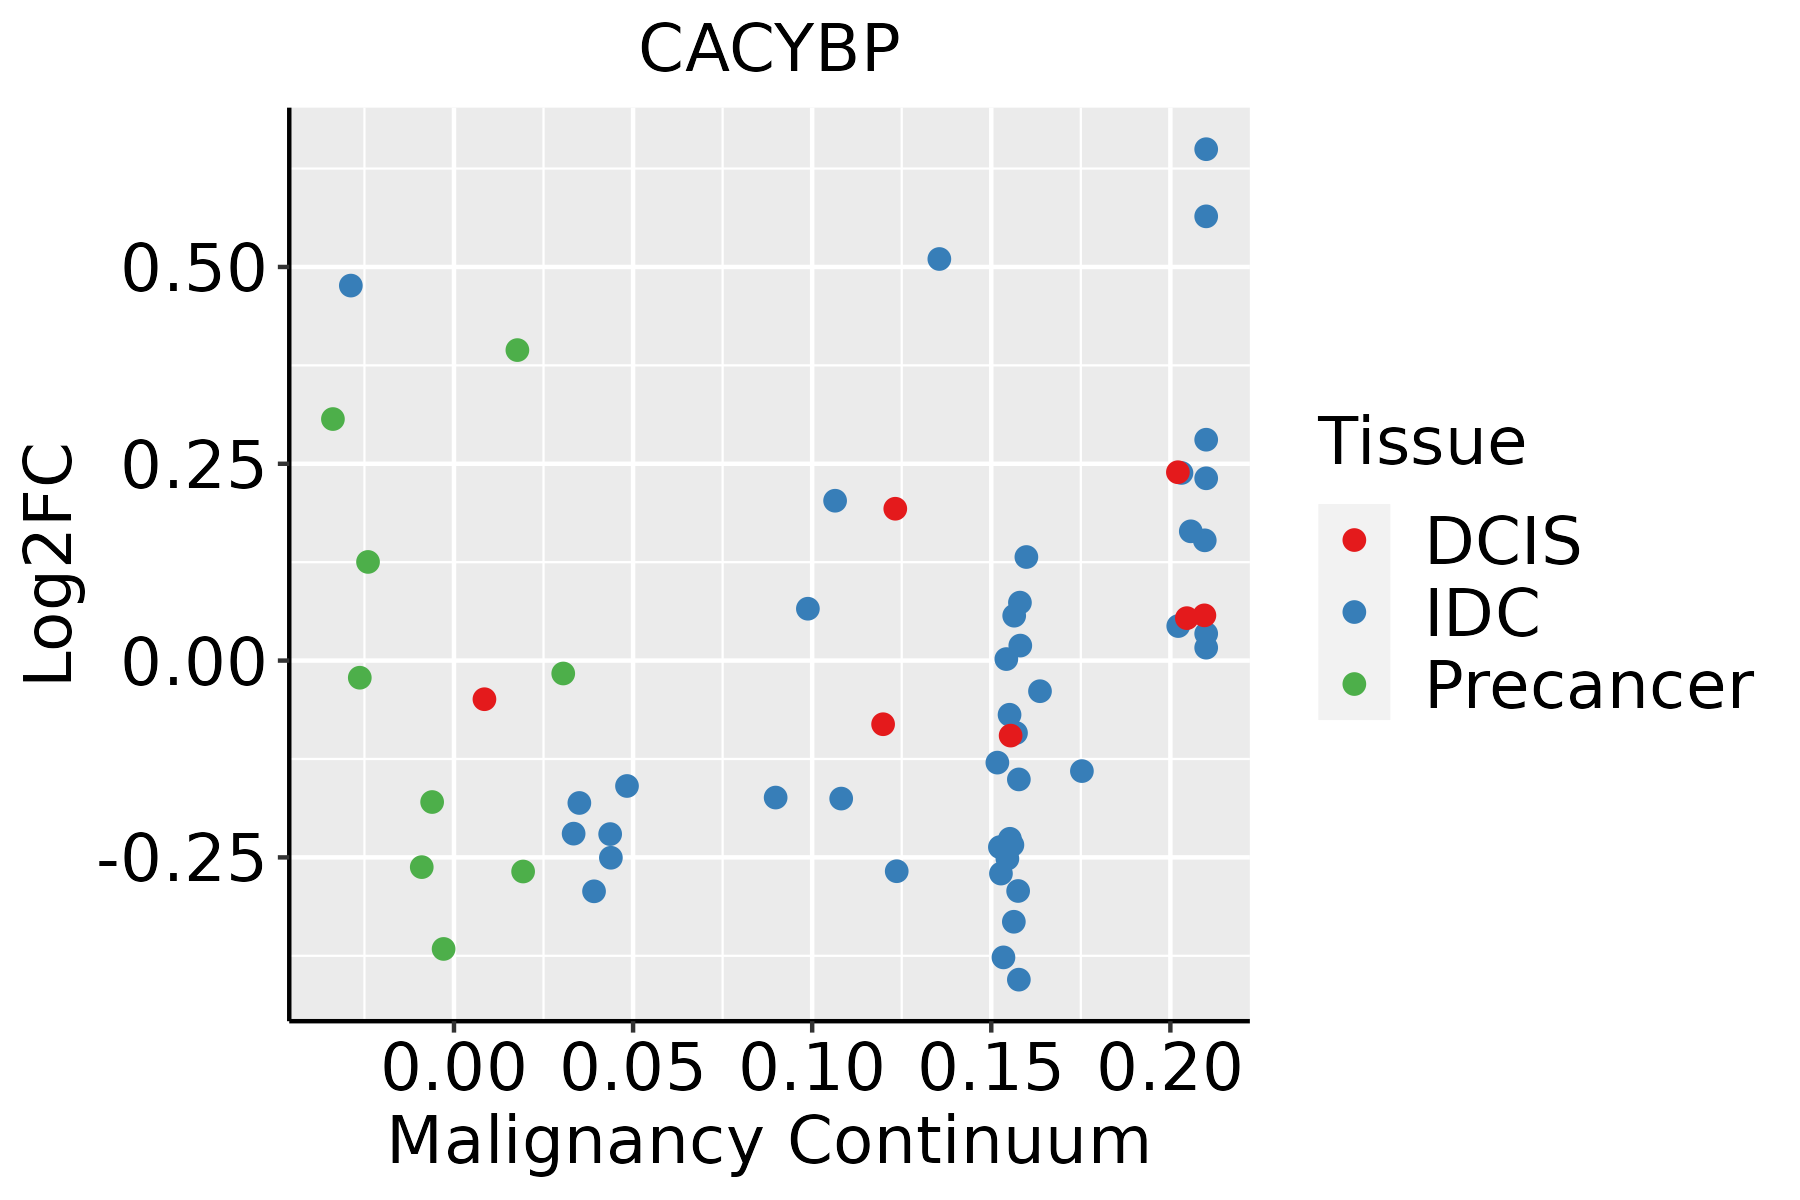 | IDC: Invasive ductal carcinoma |
| DCIS: Ductal carcinoma in situ | ||
| Precancer(BRCA1-mut): Precancerous lesion from BRCA1 mutation carriers | ||
| Cervix | 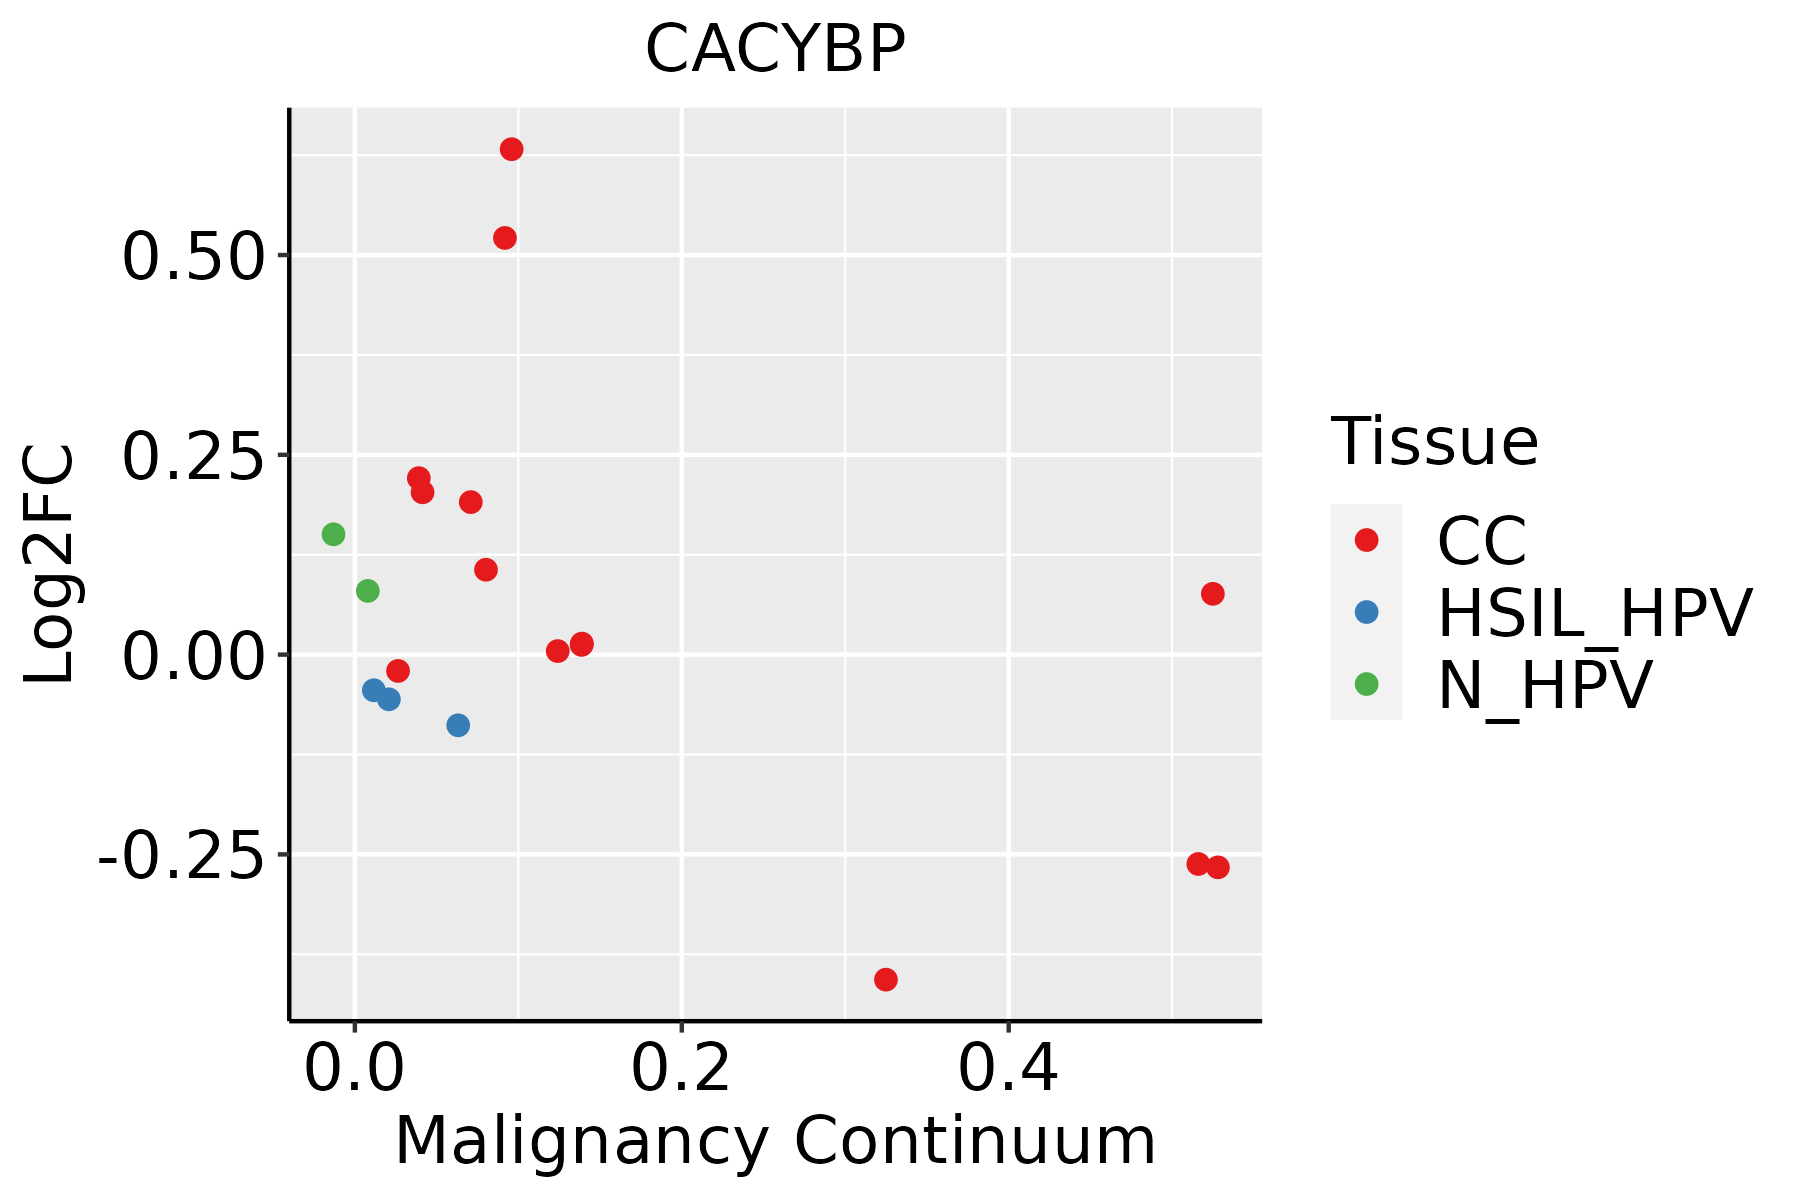 | CC: Cervix cancer |
| HSIL_HPV: HPV-infected high-grade squamous intraepithelial lesions | ||
| N_HPV: HPV-infected normal cervix | ||
| Endometrium | 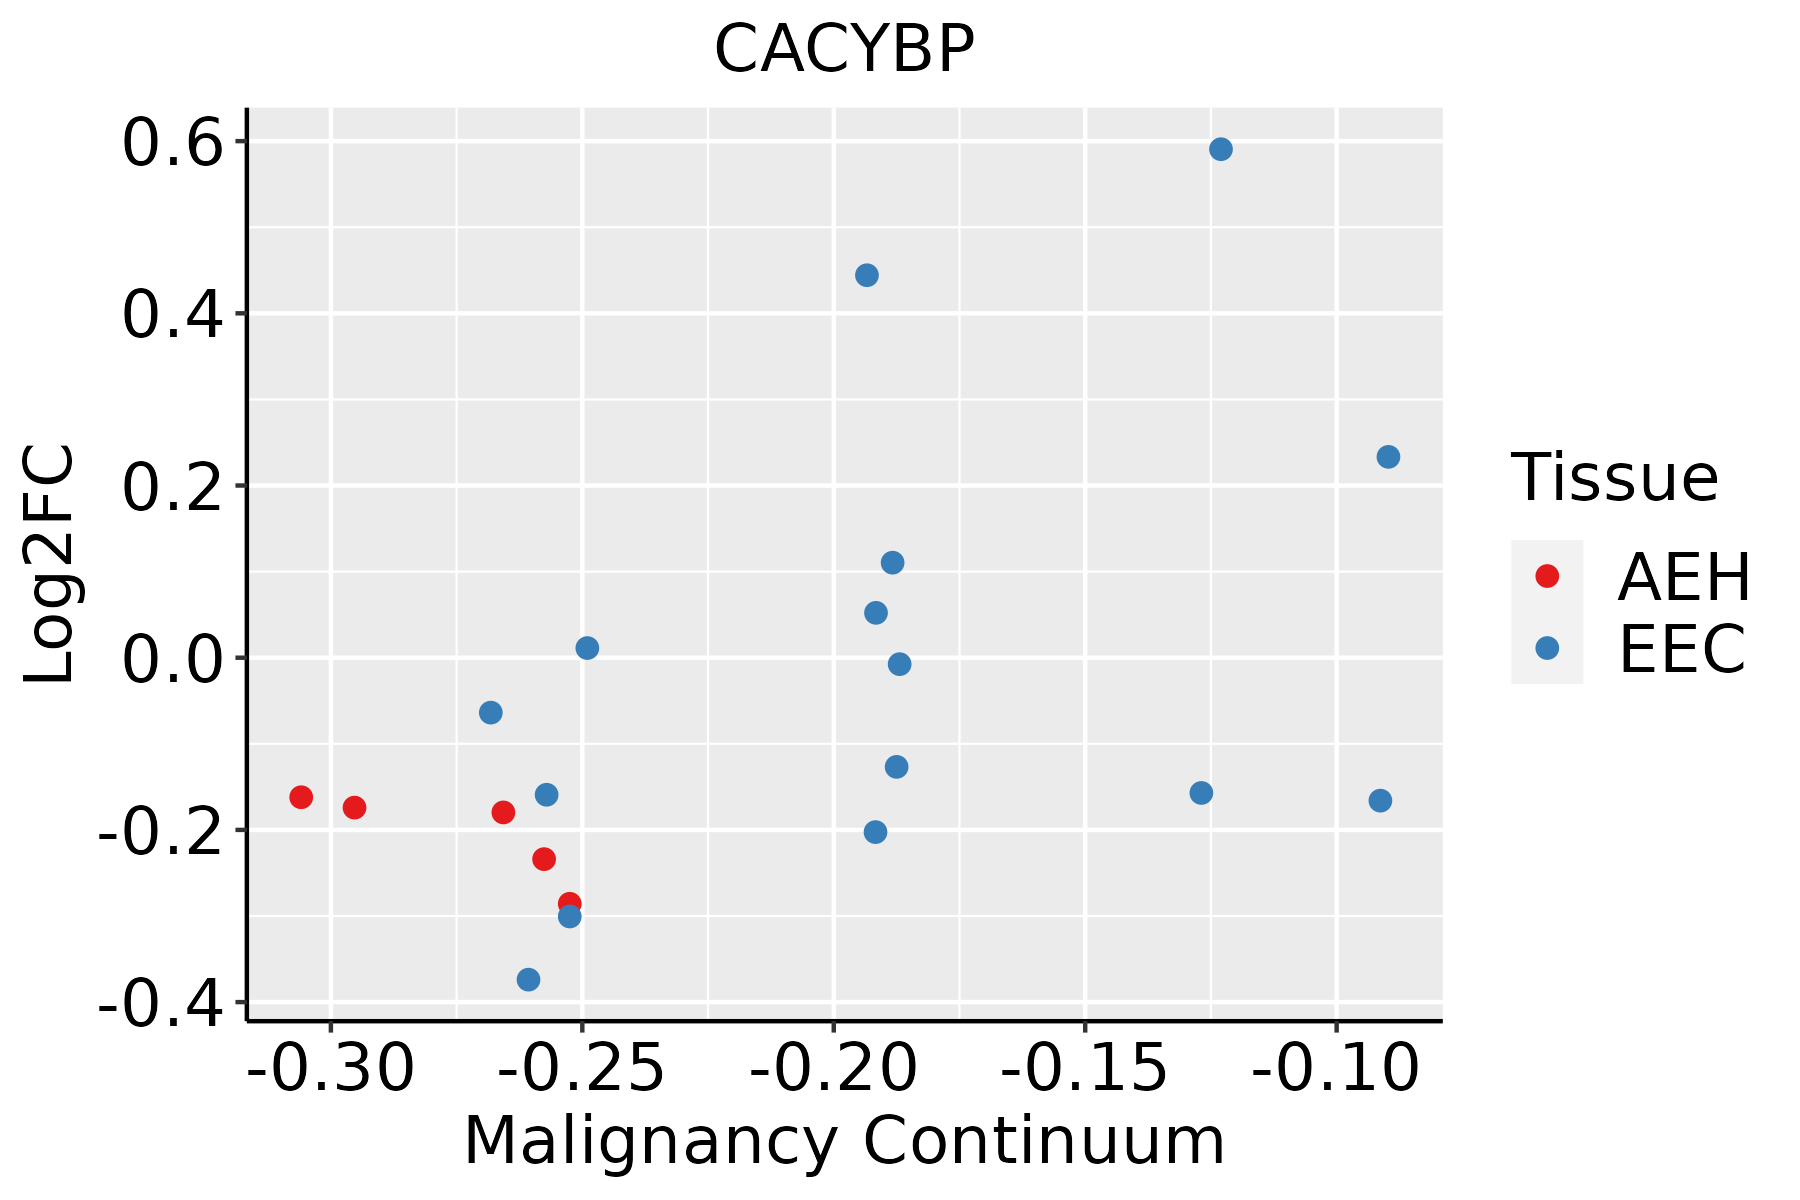 | AEH: Atypical endometrial hyperplasia |
| EEC: Endometrioid Cancer | ||
| Esophagus | 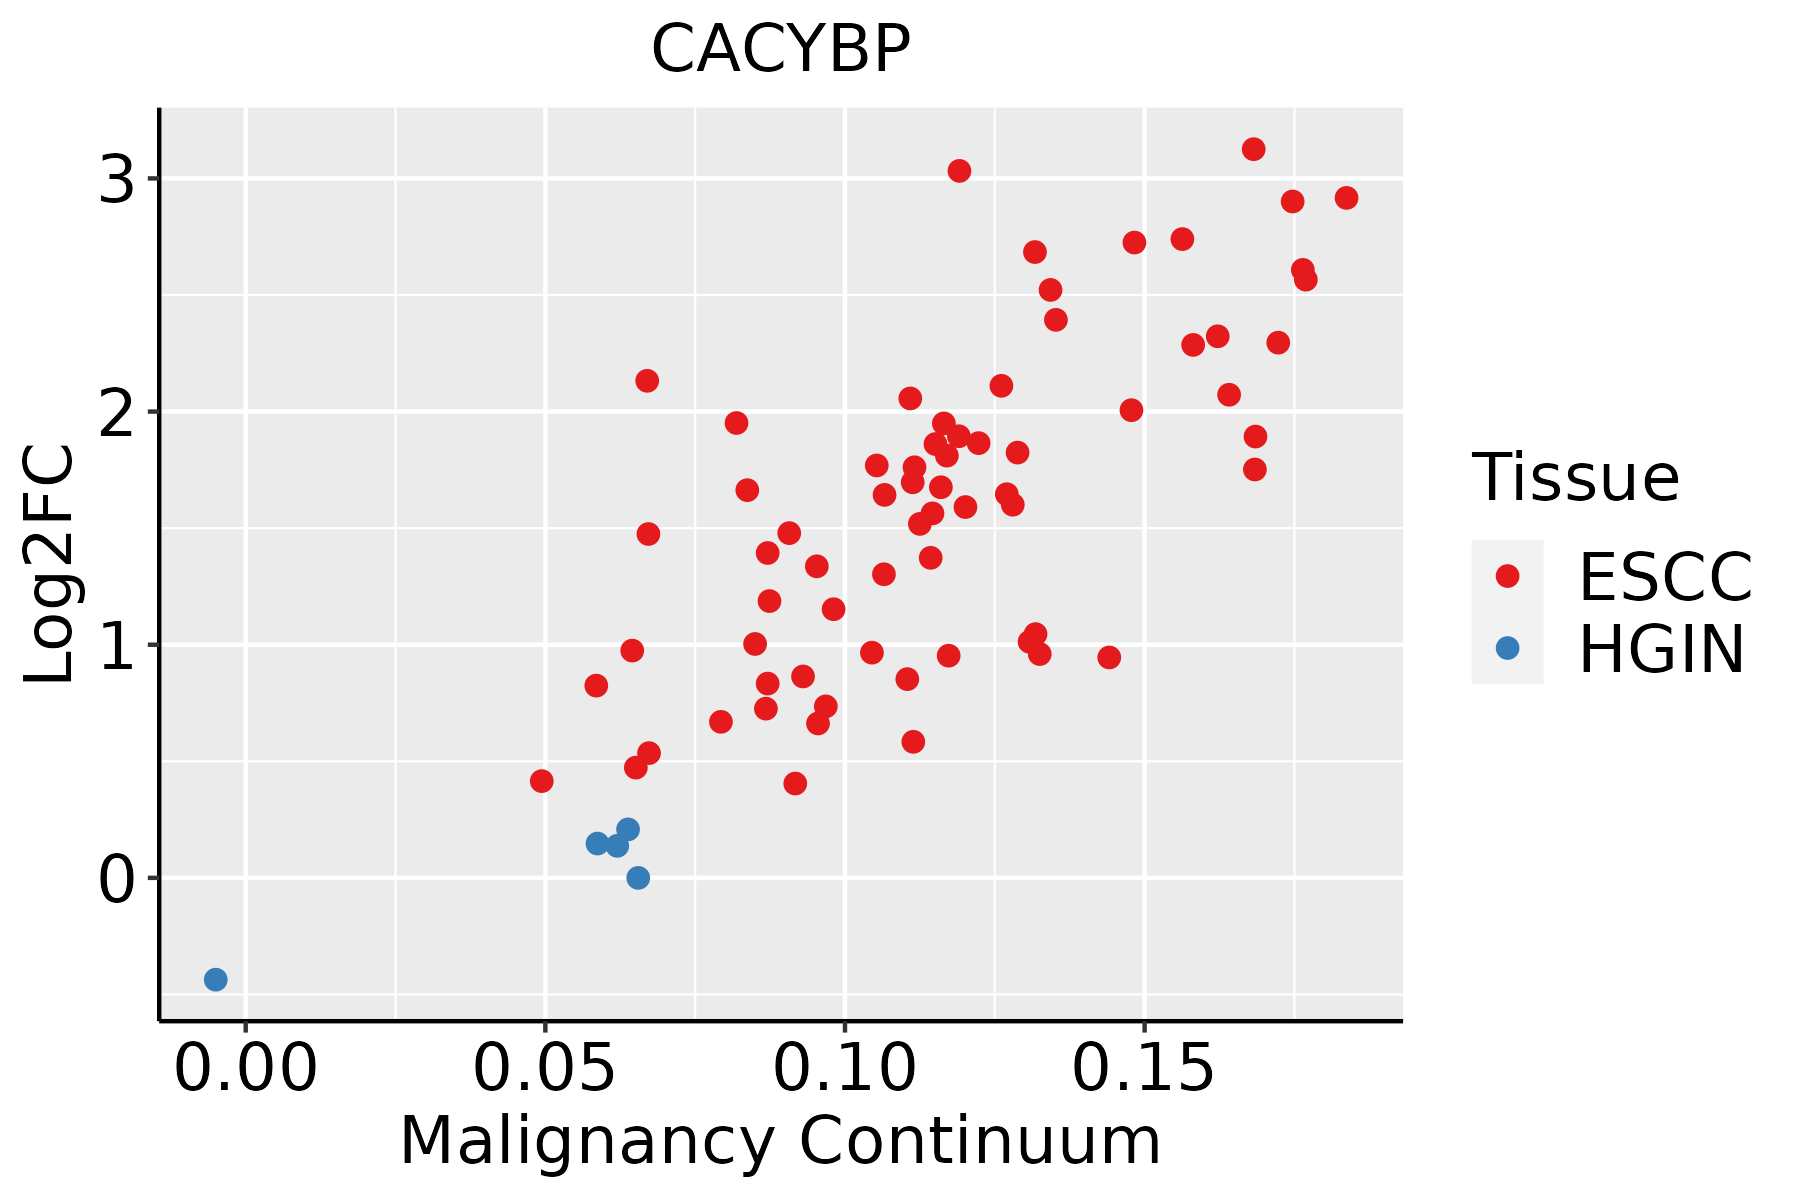 | ESCC: Esophageal squamous cell carcinoma |
| HGIN: High-grade intraepithelial neoplasias | ||
| LGIN: Low-grade intraepithelial neoplasias | ||
| GC |  | CAG: Chronic atrophic gastritis |
| CAG with IM: Chronic atrophic gastritis with intestinal metaplasia | ||
| CSG: Chronic superficial gastritis | ||
| GC: Gastric cancer | ||
| SIM: Severe intestinal metaplasia | ||
| WIM: Wild intestinal metaplasia | ||
| Liver | 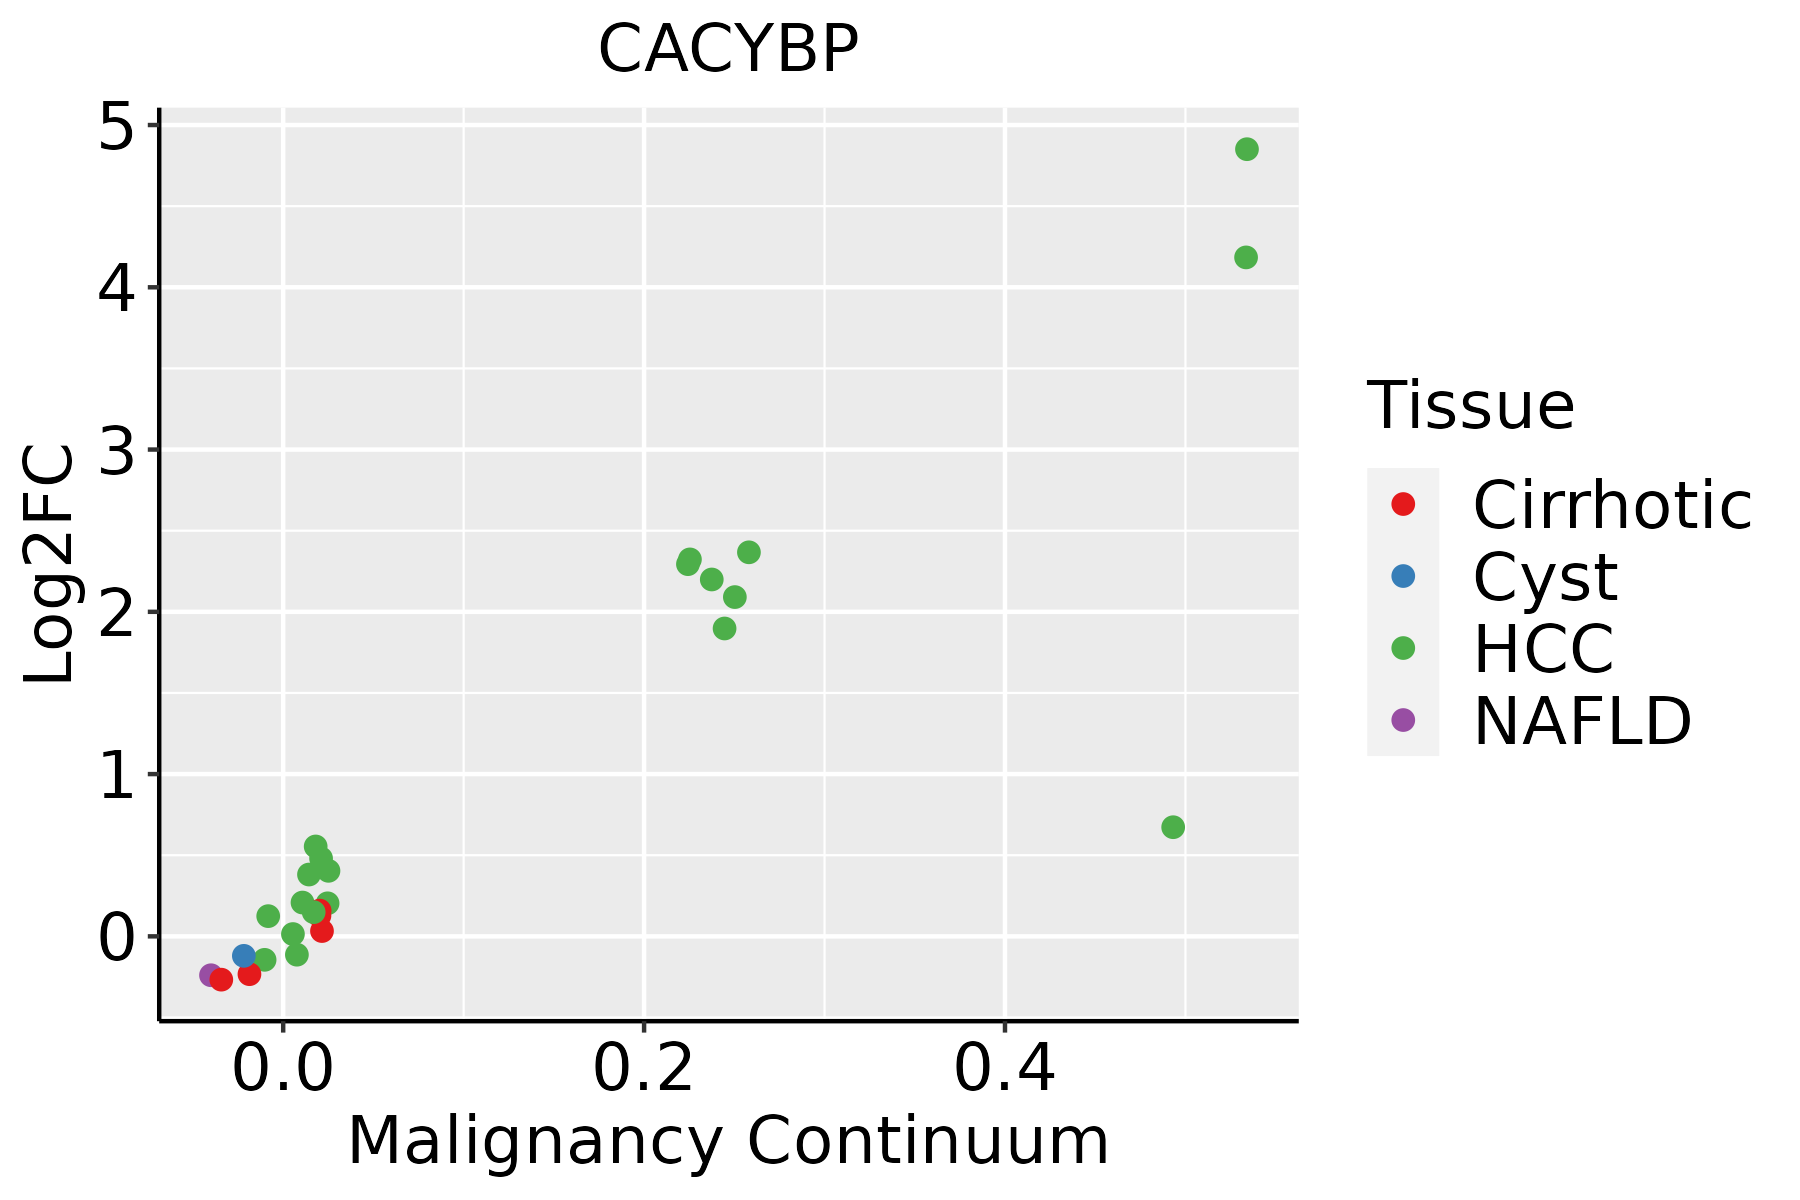 | HCC: Hepatocellular carcinoma |
| NAFLD: Non-alcoholic fatty liver disease | ||
| Oral Cavity | 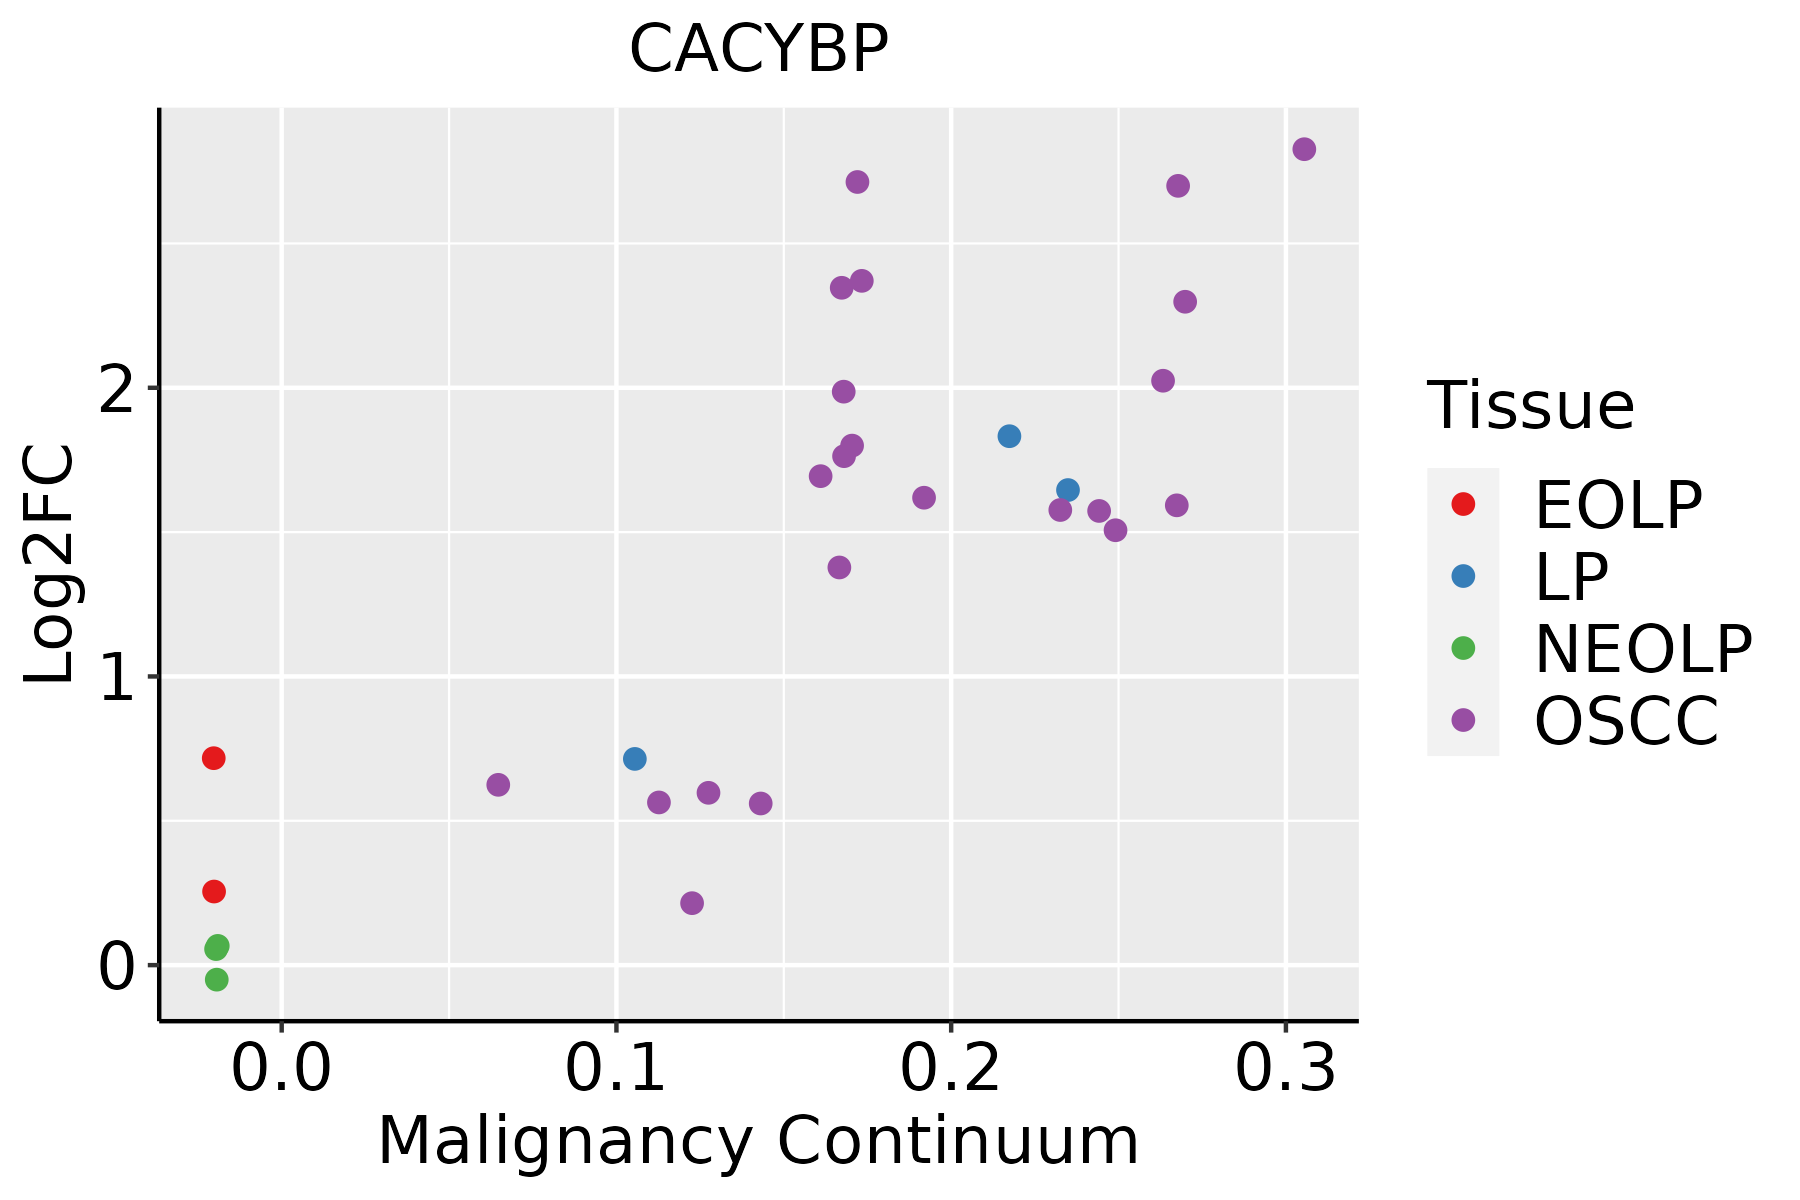 | EOLP: Erosive Oral lichen planus |
| LP: leukoplakia | ||
| NEOLP: Non-erosive oral lichen planus | ||
| OSCC: Oral squamous cell carcinoma | ||
| Prostate | 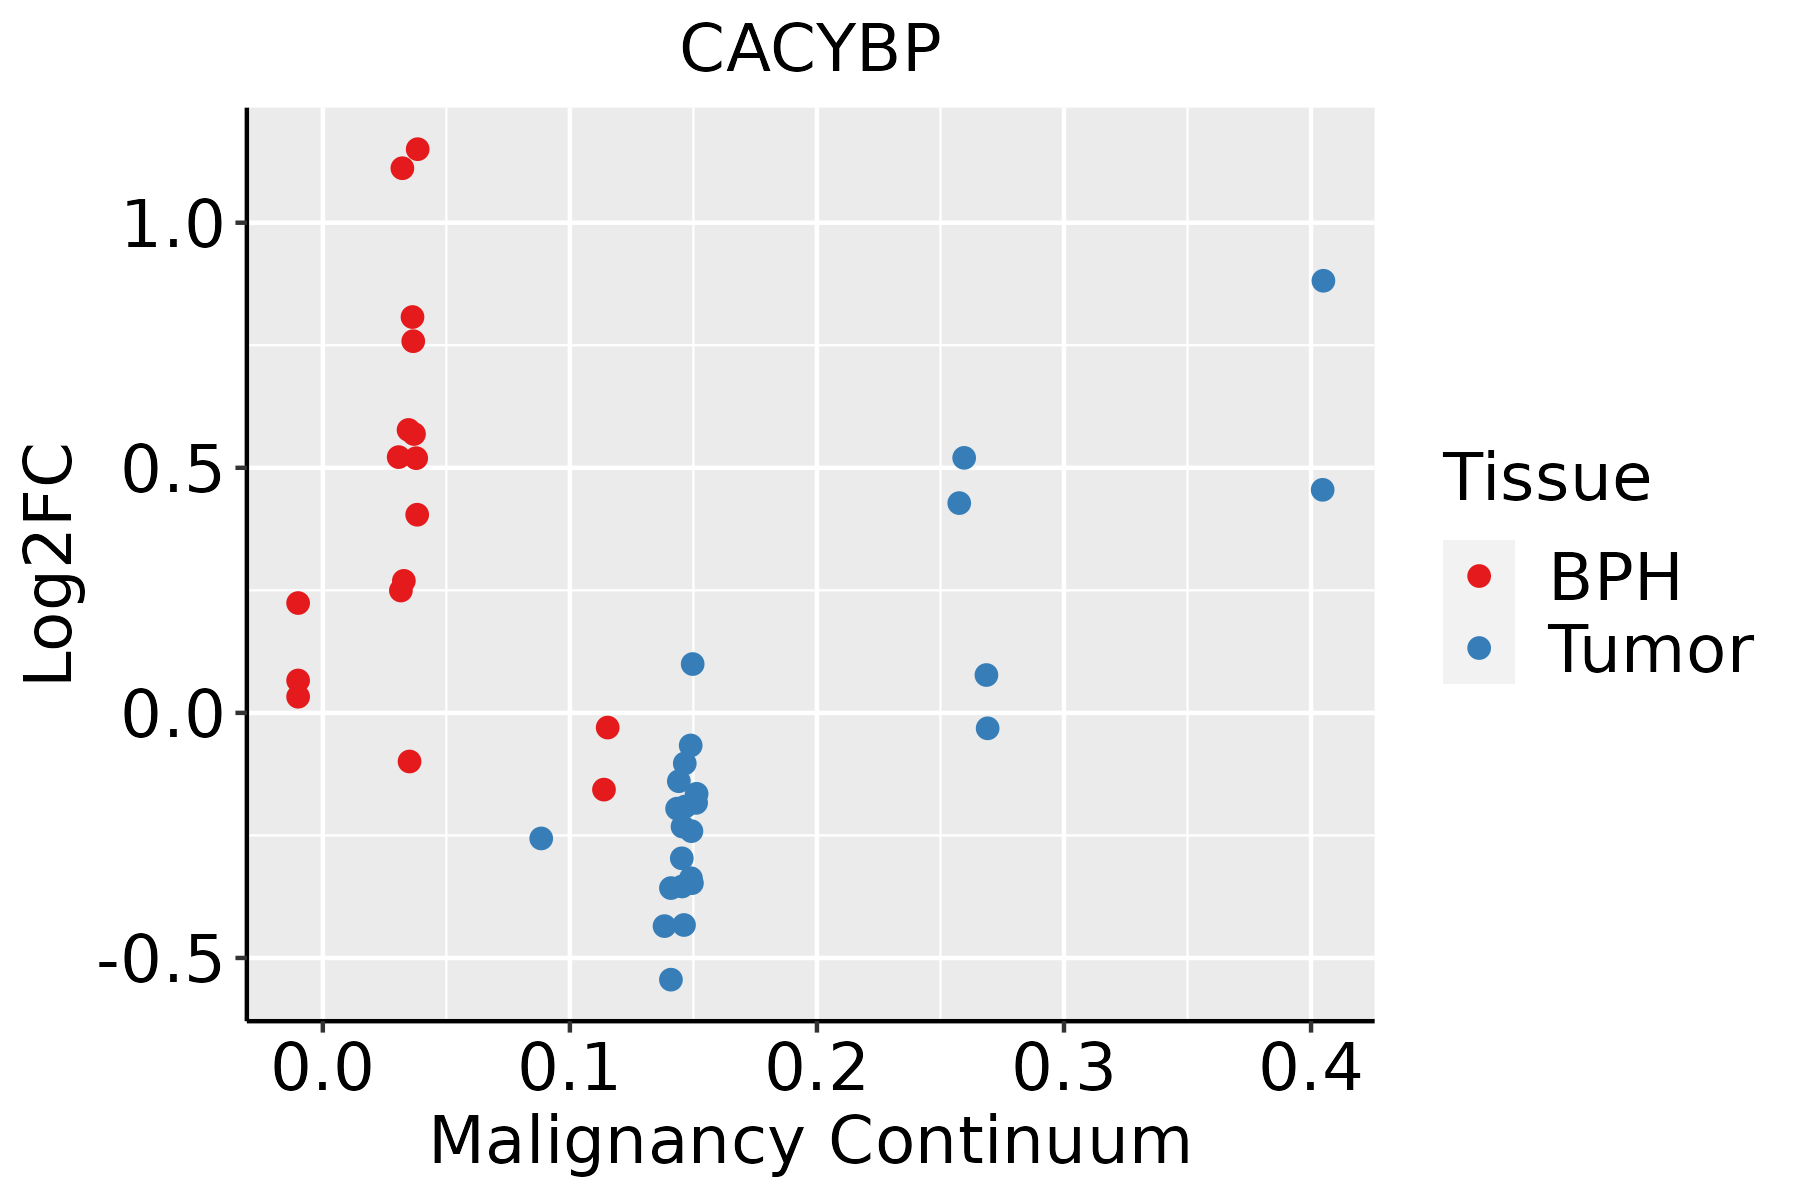 | BPH: Benign Prostatic Hyperplasia |
| Skin | 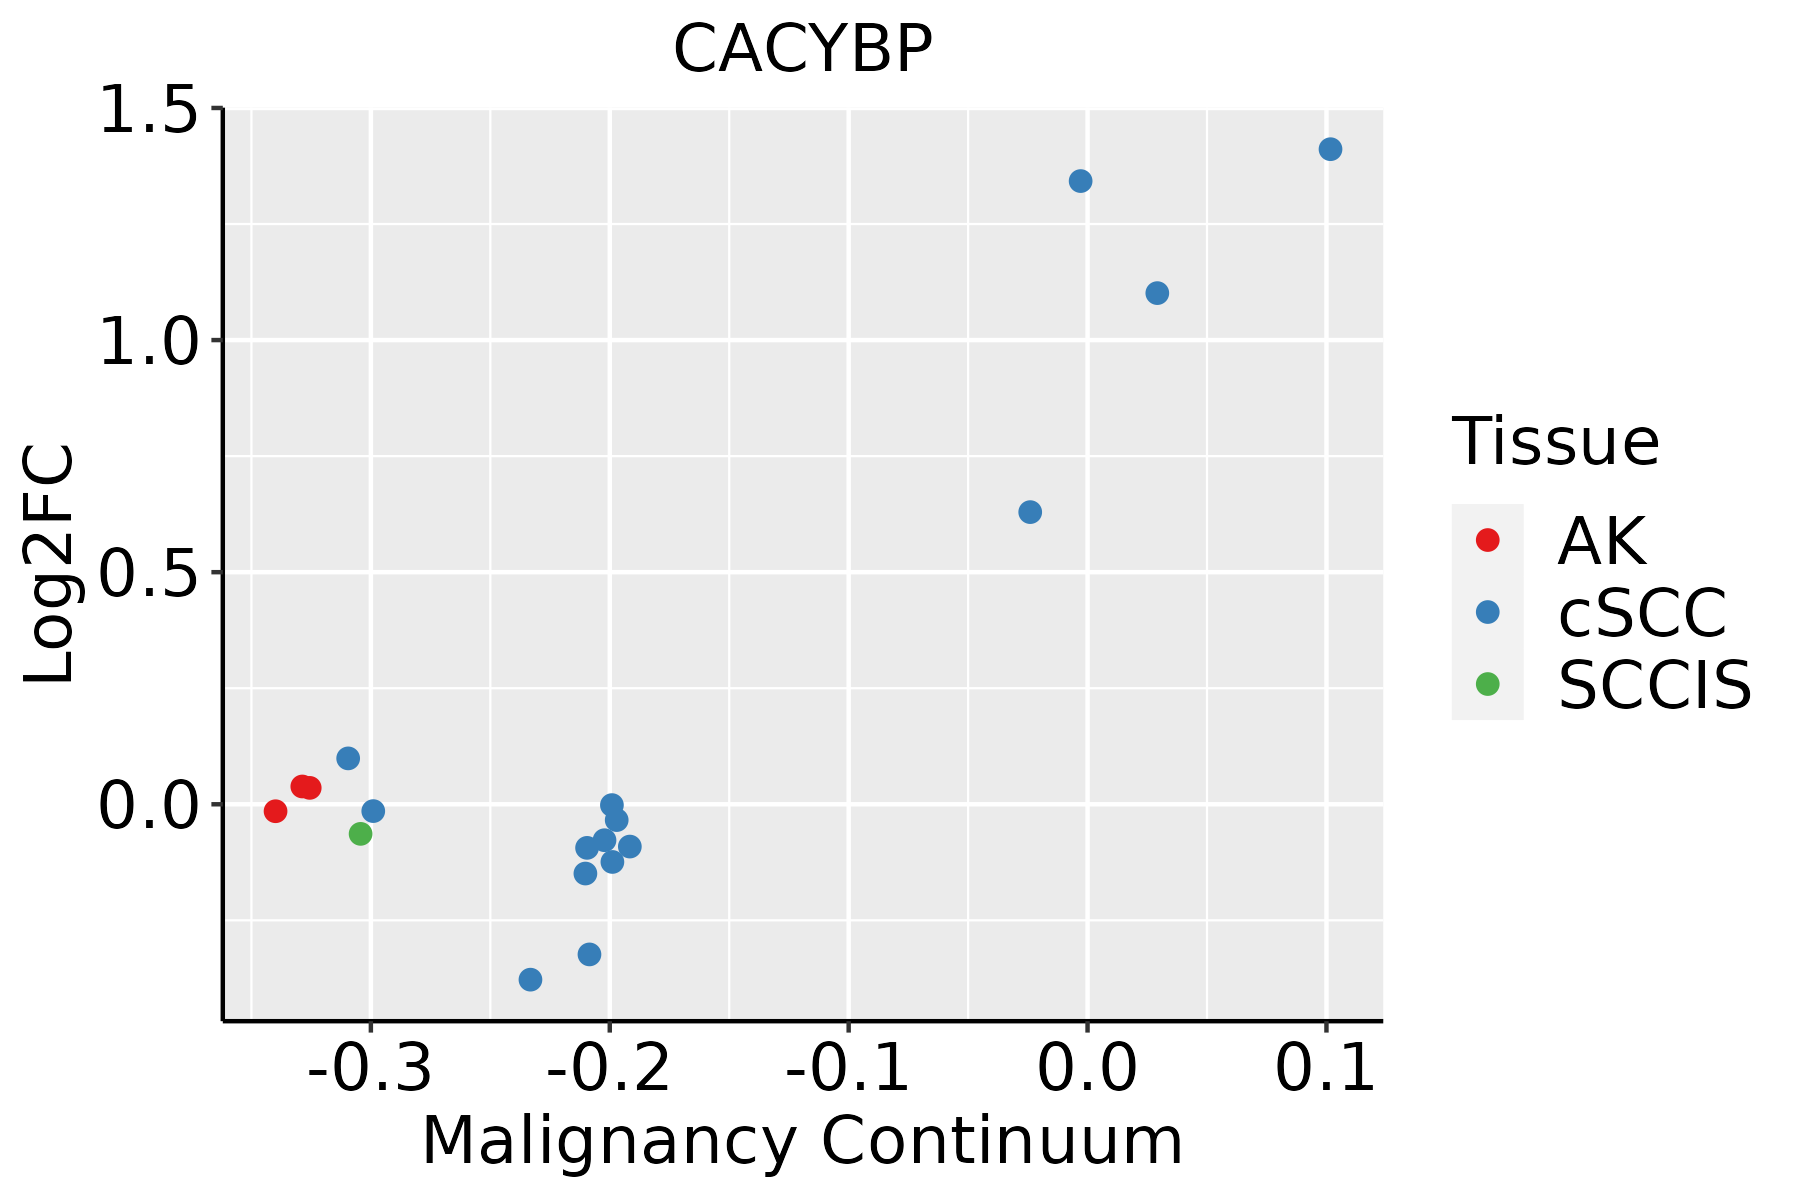 | AK: Actinic keratosis |
| cSCC: Cutaneous squamous cell carcinoma | ||
| SCCIS:squamous cell carcinoma in situ | ||
| Thyroid | 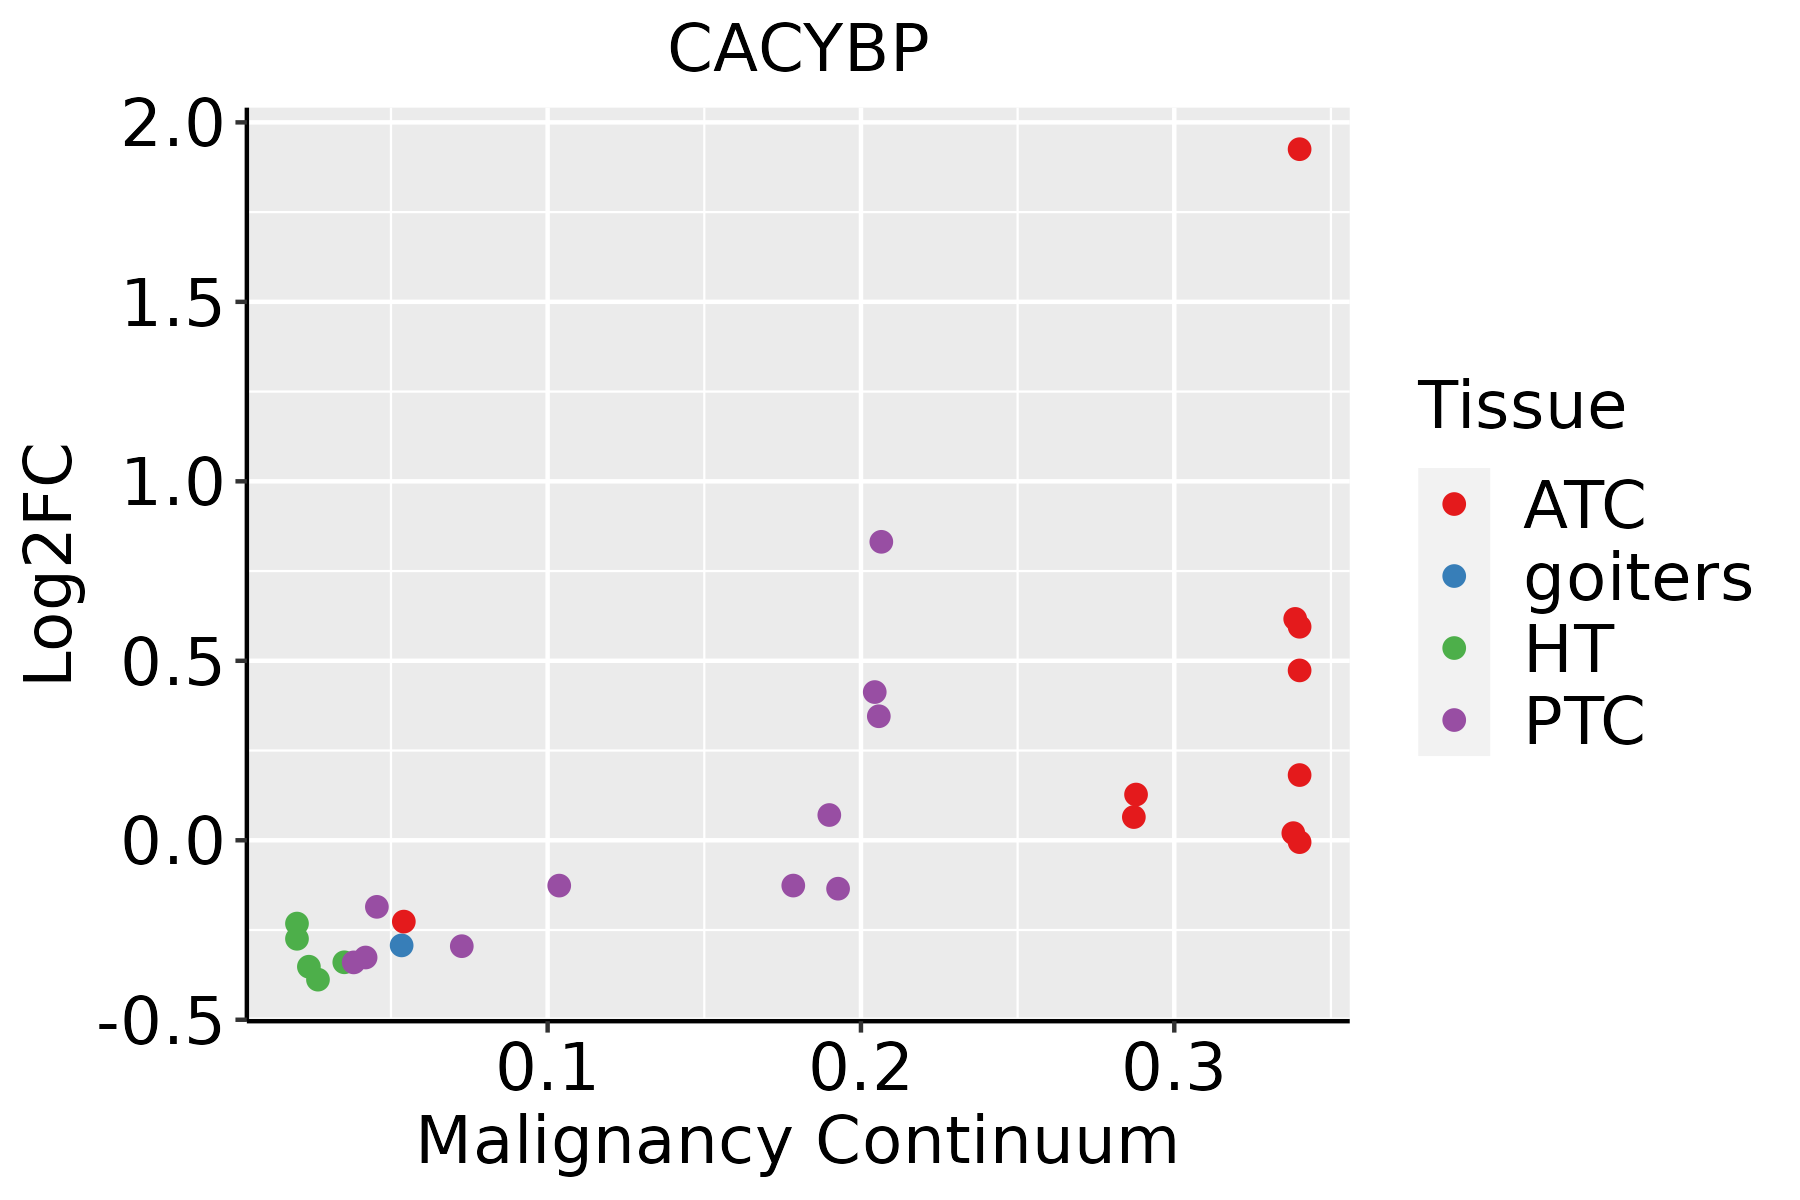 | ATC: Anaplastic thyroid cancer |
| HT: Hashimoto's thyroiditis | ||
| PTC: Papillary thyroid cancer |
| ∗log2FC in expression of this searched gene in stem-like cells from each diseased tissue sample relative to stem-like cells in normal samples in each tissue plotted against the malignancy continuum. Samples are colored based on if they are from different disease stage. |
Top |
Malignant transformation related pathway analysis |
| Find out the enriched GO biological processes and KEGG pathways involved in transition from healthy to precancer to cancer |
| Tissue | Disease Stage | Enriched GO biological Processes |
| Colorectum | AD |  |
| Colorectum | SER |  |
| Colorectum | MSS |  |
| Colorectum | MSI-H |  |
| Colorectum | FAP |  |
| ∗Top 15 enriched GO BP terms are showed in the bar plot of each disease state in each tissue. Each row represents a significant GO biological process which is colored according to the -log10(p.adjust). |
| Page: 1 2 3 4 5 6 7 8 9 |
| GO ID | Tissue | Disease Stage | Description | Gene Ratio | Bg Ratio | pvalue | p.adjust | Count |
| GO:00100389 | Breast | Precancer | response to metal ion | 47/1080 | 373/18723 | 3.88e-07 | 1.79e-05 | 47 |
| GO:00075688 | Breast | Precancer | aging | 41/1080 | 339/18723 | 5.95e-06 | 1.71e-04 | 41 |
| GO:00712488 | Breast | Precancer | cellular response to metal ion | 24/1080 | 197/18723 | 4.35e-04 | 5.79e-03 | 24 |
| GO:00712418 | Breast | Precancer | cellular response to inorganic substance | 26/1080 | 226/18723 | 6.23e-04 | 7.78e-03 | 26 |
| GO:00457403 | Breast | Precancer | positive regulation of DNA replication | 8/1080 | 40/18723 | 1.76e-03 | 1.74e-02 | 8 |
| GO:00515925 | Breast | Precancer | response to calcium ion | 18/1080 | 149/18723 | 2.37e-03 | 2.19e-02 | 18 |
| GO:19908303 | Breast | Precancer | cellular response to leukemia inhibitory factor | 13/1080 | 94/18723 | 2.83e-03 | 2.49e-02 | 13 |
| GO:19908233 | Breast | Precancer | response to leukemia inhibitory factor | 13/1080 | 95/18723 | 3.11e-03 | 2.64e-02 | 13 |
| GO:00605374 | Breast | Precancer | muscle tissue development | 37/1080 | 403/18723 | 3.60e-03 | 2.98e-02 | 37 |
| GO:00147063 | Breast | Precancer | striated muscle tissue development | 35/1080 | 384/18723 | 5.10e-03 | 3.83e-02 | 35 |
| GO:001003814 | Breast | IDC | response to metal ion | 65/1434 | 373/18723 | 2.95e-10 | 3.42e-08 | 65 |
| GO:000756813 | Breast | IDC | aging | 52/1434 | 339/18723 | 1.14e-06 | 5.10e-05 | 52 |
| GO:00434348 | Breast | IDC | response to peptide hormone | 54/1434 | 414/18723 | 8.25e-05 | 1.61e-03 | 54 |
| GO:006053711 | Breast | IDC | muscle tissue development | 50/1434 | 403/18723 | 4.91e-04 | 6.45e-03 | 50 |
| GO:00147061 | Breast | IDC | striated muscle tissue development | 46/1434 | 384/18723 | 1.67e-03 | 1.63e-02 | 46 |
| GO:007124813 | Breast | IDC | cellular response to metal ion | 27/1434 | 197/18723 | 2.28e-03 | 2.09e-02 | 27 |
| GO:00457401 | Breast | IDC | positive regulation of DNA replication | 9/1434 | 40/18723 | 2.76e-03 | 2.42e-02 | 9 |
| GO:007124113 | Breast | IDC | cellular response to inorganic substance | 29/1434 | 226/18723 | 4.28e-03 | 3.34e-02 | 29 |
| GO:00426923 | Breast | IDC | muscle cell differentiation | 44/1434 | 384/18723 | 4.77e-03 | 3.66e-02 | 44 |
| GO:005159213 | Breast | IDC | response to calcium ion | 21/1434 | 149/18723 | 4.79e-03 | 3.67e-02 | 21 |
| Page: 1 2 3 4 5 6 7 8 9 10 11 12 13 |
| Pathway ID | Tissue | Disease Stage | Description | Gene Ratio | Bg Ratio | pvalue | p.adjust | qvalue | Count |
| hsa0431010 | Endometrium | AEH | Wnt signaling pathway | 37/1197 | 171/8465 | 4.68e-03 | 2.53e-02 | 1.86e-02 | 37 |
| hsa0431013 | Endometrium | AEH | Wnt signaling pathway | 37/1197 | 171/8465 | 4.68e-03 | 2.53e-02 | 1.86e-02 | 37 |
| hsa0431022 | Endometrium | EEC | Wnt signaling pathway | 40/1237 | 171/8465 | 1.37e-03 | 8.99e-03 | 6.70e-03 | 40 |
| hsa0431032 | Endometrium | EEC | Wnt signaling pathway | 40/1237 | 171/8465 | 1.37e-03 | 8.99e-03 | 6.70e-03 | 40 |
| hsa0431014 | Prostate | BPH | Wnt signaling pathway | 50/1718 | 171/8465 | 3.11e-03 | 1.15e-02 | 7.14e-03 | 50 |
| hsa0431015 | Prostate | BPH | Wnt signaling pathway | 50/1718 | 171/8465 | 3.11e-03 | 1.15e-02 | 7.14e-03 | 50 |
| hsa0431023 | Prostate | Tumor | Wnt signaling pathway | 50/1791 | 171/8465 | 7.32e-03 | 2.37e-02 | 1.47e-02 | 50 |
| hsa0431033 | Prostate | Tumor | Wnt signaling pathway | 50/1791 | 171/8465 | 7.32e-03 | 2.37e-02 | 1.47e-02 | 50 |
| Page: 1 |
Top |
Cell-cell communication analysis |
| Identification of potential cell-cell interactions between two cell types and their ligand-receptor pairs for different disease states |
| Ligand | Receptor | LRpair | Pathway | Tissue | Disease Stage |
| Page: 1 |
Top |
Single-cell gene regulatory network inference analysis |
| Find out the significant the regulons (TFs) and the target genes of each regulon across cell types for different disease states |
| TF | Cell Type | Tissue | Disease Stage | Target Gene | RSS | Regulon Activity |
| ∗The dot plots of a searched regulon are shown for all cell subpopulations in each disease state of each tissue based on the regulon specific score inferred using pySCENIC and by calculating the average expression. |
| Page: 1 |
Top |
Somatic mutation of malignant transformation related genes |
| Annotation of somatic variants for genes involved in malignant transformation |
| Hugo Symbol | Variant Class | Variant Classification | dbSNP RS | HGVSc | HGVSp | HGVSp Short | SWISSPROT | BIOTYPE | SIFT | PolyPhen | Tumor Sample Barcode | Tissue | Histology | Sex | Age | Stage | Therapy Types | Drugs | Outcome |
| CACYBP | SNV | Missense_Mutation | novel | c.28N>G | p.Leu10Val | p.L10V | Q9HB71 | protein_coding | deleterious(0.05) | probably_damaging(0.985) | TCGA-BH-A28O-01 | Breast | breast invasive carcinoma | Female | <65 | III/IV | Chemotherapy | cytoxan | CR |
| CACYBP | deletion | Frame_Shift_Del | c.432delA | p.Val145SerfsTer22 | p.V145Sfs*22 | Q9HB71 | protein_coding | TCGA-2W-A8YY-01 | Cervix | cervical & endocervical cancer | Female | <65 | I/II | Chemotherapy | cisplatin | CR | |||
| CACYBP | SNV | Missense_Mutation | c.379A>G | p.Met127Val | p.M127V | Q9HB71 | protein_coding | deleterious(0.01) | benign(0.015) | TCGA-A6-5661-01 | Colorectum | colon adenocarcinoma | Female | >=65 | I/II | Unknown | Unknown | SD | |
| CACYBP | SNV | Missense_Mutation | novel | c.231N>G | p.Asn77Lys | p.N77K | Q9HB71 | protein_coding | deleterious(0) | probably_damaging(0.981) | TCGA-CA-6717-01 | Colorectum | colon adenocarcinoma | Male | <65 | I/II | Chemotherapy | oxaliplatin | CR |
| CACYBP | deletion | Frame_Shift_Del | c.426delN | p.Val145SerfsTer22 | p.V145Sfs*22 | Q9HB71 | protein_coding | TCGA-AA-3715-01 | Colorectum | colon adenocarcinoma | Male | >=65 | I/II | Unknown | Unknown | PD | |||
| CACYBP | SNV | Missense_Mutation | c.463N>G | p.Arg155Gly | p.R155G | Q9HB71 | protein_coding | deleterious(0.03) | benign(0.408) | TCGA-A5-A0G9-01 | Endometrium | uterine corpus endometrioid carcinoma | Female | >=65 | I/II | Unknown | Unknown | SD | |
| CACYBP | SNV | Missense_Mutation | novel | c.638C>T | p.Ala213Val | p.A213V | Q9HB71 | protein_coding | deleterious(0) | probably_damaging(0.998) | TCGA-A5-A1OF-01 | Endometrium | uterine corpus endometrioid carcinoma | Female | <65 | I/II | Unknown | Unknown | SD |
| CACYBP | SNV | Missense_Mutation | novel | c.215N>T | p.Thr72Met | p.T72M | Q9HB71 | protein_coding | deleterious(0.02) | possibly_damaging(0.592) | TCGA-A5-A7WJ-01 | Endometrium | uterine corpus endometrioid carcinoma | Female | <65 | I/II | Unknown | Unknown | SD |
| CACYBP | SNV | Missense_Mutation | c.185N>T | p.Ala62Val | p.A62V | Q9HB71 | protein_coding | tolerated(0.22) | benign(0.228) | TCGA-AP-A059-01 | Endometrium | uterine corpus endometrioid carcinoma | Female | >=65 | I/II | Unknown | Unknown | SD | |
| CACYBP | SNV | Missense_Mutation | novel | c.664N>T | p.Ala222Ser | p.A222S | Q9HB71 | protein_coding | tolerated(0.41) | benign(0.054) | TCGA-AP-A1E1-01 | Endometrium | uterine corpus endometrioid carcinoma | Female | >=65 | I/II | Unknown | Unknown | SD |
| Page: 1 2 3 4 |
Top |
Related drugs of malignant transformation related genes |
| Identification of chemicals and drugs interact with genes involved in malignant transfromation |
| (DGIdb 4.0) |
| Entrez ID | Symbol | Category | Interaction Types | Drug Claim Name | Drug Name | PMIDs |
| Page: 1 |

Copyright 2023-Present -The University of Texas Health Science Center at Houston |