
|
|||||
|
 | |
| |
| |
| |
| |
| |
|
Gene: C15orf57 |
Gene summary for C15ORF57 |
| Gene information | Species | Human | Gene symbol | C15orf57 | Gene ID | 90416 |
| Gene name | coiled-coil domain containing 32 | |
| Gene Alias | C15orf57 | |
| Cytomap | 15q15.1 | |
| Gene Type | protein-coding | GO ID | GO:0006996 | UniProtAcc | Q9BV29 |
Top |
Malignant transformation analysis |
| Identification of the aberrant gene expression in precancerous and cancerous lesions by comparing the gene expression of stem-like cells in diseased tissues with normal stem cells |
| Entrez ID | Symbol | Replicates | Species | Organ | Tissue | Adj P-value | Log2FC | Malignancy |
| 90416 | C15orf57 | P79T-E | Human | Esophagus | ESCC | 3.15e-16 | 2.02e-01 | 0.1154 |
| 90416 | C15orf57 | P80T-E | Human | Esophagus | ESCC | 2.16e-10 | 2.40e-01 | 0.155 |
| 90416 | C15orf57 | P82T-E | Human | Esophagus | ESCC | 1.36e-20 | 7.84e-01 | 0.1072 |
| 90416 | C15orf57 | P83T-E | Human | Esophagus | ESCC | 7.86e-16 | 4.92e-01 | 0.1738 |
| 90416 | C15orf57 | P84T-E | Human | Esophagus | ESCC | 3.92e-05 | 2.60e-01 | 0.0933 |
| 90416 | C15orf57 | P89T-E | Human | Esophagus | ESCC | 2.30e-04 | 4.30e-01 | 0.1752 |
| 90416 | C15orf57 | P91T-E | Human | Esophagus | ESCC | 1.11e-02 | 5.33e-01 | 0.1828 |
| 90416 | C15orf57 | P104T-E | Human | Esophagus | ESCC | 1.61e-03 | 5.55e-01 | 0.0931 |
| 90416 | C15orf57 | P107T-E | Human | Esophagus | ESCC | 1.74e-17 | 3.83e-01 | 0.171 |
| 90416 | C15orf57 | P126T-E | Human | Esophagus | ESCC | 2.85e-04 | 4.01e-01 | 0.1125 |
| 90416 | C15orf57 | P127T-E | Human | Esophagus | ESCC | 1.72e-10 | 1.04e-01 | 0.0826 |
| 90416 | C15orf57 | P128T-E | Human | Esophagus | ESCC | 1.27e-13 | 4.08e-01 | 0.1241 |
| 90416 | C15orf57 | P130T-E | Human | Esophagus | ESCC | 2.13e-27 | 5.77e-01 | 0.1676 |
| 90416 | C15orf57 | C04 | Human | Oral cavity | OSCC | 6.07e-08 | 4.06e-01 | 0.2633 |
| 90416 | C15orf57 | C21 | Human | Oral cavity | OSCC | 1.07e-15 | 5.50e-01 | 0.2678 |
| 90416 | C15orf57 | C30 | Human | Oral cavity | OSCC | 1.52e-15 | 6.44e-01 | 0.3055 |
| 90416 | C15orf57 | C38 | Human | Oral cavity | OSCC | 9.30e-08 | 6.65e-01 | 0.172 |
| 90416 | C15orf57 | C43 | Human | Oral cavity | OSCC | 6.91e-05 | 2.06e-01 | 0.1704 |
| 90416 | C15orf57 | C46 | Human | Oral cavity | OSCC | 4.01e-13 | 3.53e-01 | 0.1673 |
| 90416 | C15orf57 | C57 | Human | Oral cavity | OSCC | 6.15e-05 | 2.07e-01 | 0.1679 |
| Page: 1 2 3 4 |
| Tissue | Expression Dynamics | Abbreviation |
| Esophagus |  | ESCC: Esophageal squamous cell carcinoma |
| HGIN: High-grade intraepithelial neoplasias | ||
| LGIN: Low-grade intraepithelial neoplasias | ||
| Oral Cavity | 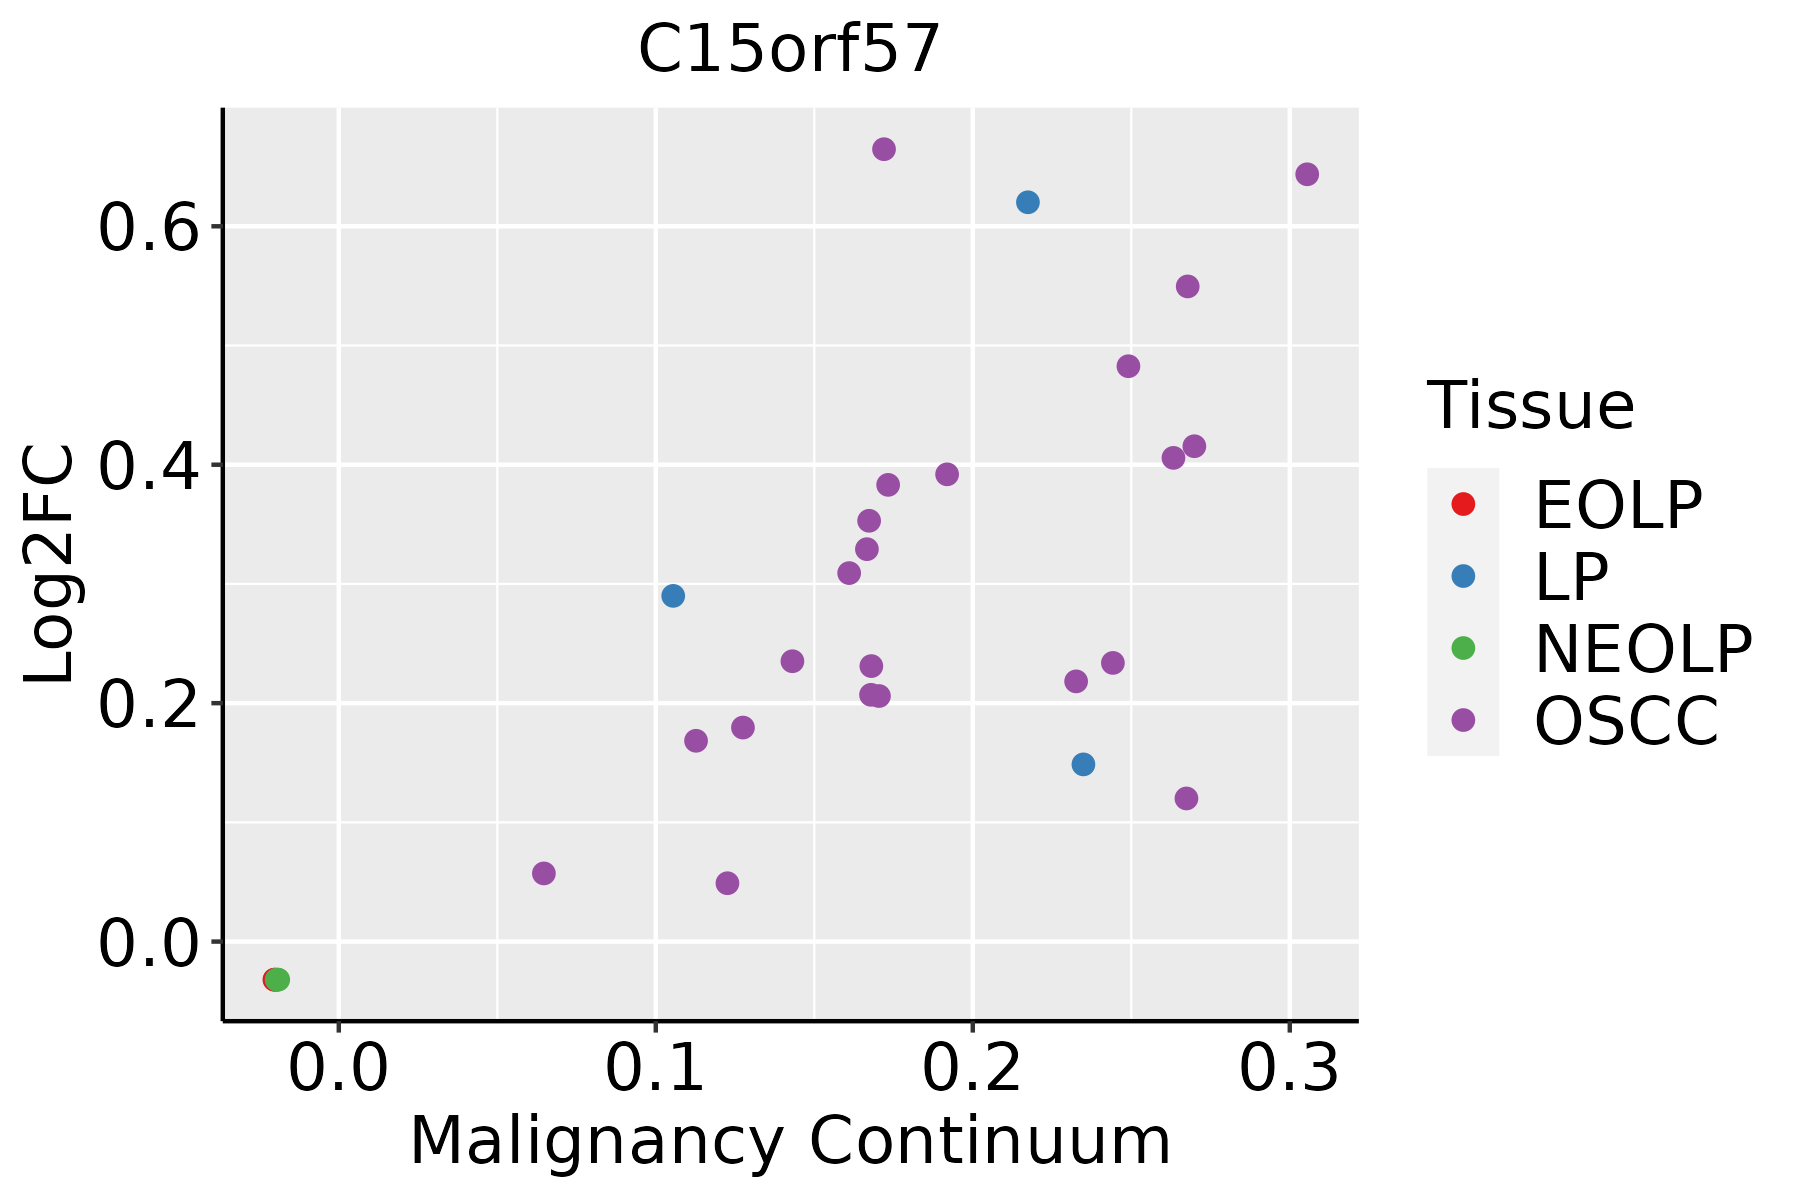 | EOLP: Erosive Oral lichen planus |
| LP: leukoplakia | ||
| NEOLP: Non-erosive oral lichen planus | ||
| OSCC: Oral squamous cell carcinoma |
| ∗log2FC in expression of this searched gene in stem-like cells from each diseased tissue sample relative to stem-like cells in normal samples in each tissue plotted against the malignancy continuum. Samples are colored based on if they are from different disease stage. |
Top |
Malignant transformation related pathway analysis |
| Find out the enriched GO biological processes and KEGG pathways involved in transition from healthy to precancer to cancer |
| Tissue | Disease Stage | Enriched GO biological Processes |
| Colorectum | AD |  |
| Colorectum | SER |  |
| Colorectum | MSS |  |
| Colorectum | MSI-H |  |
| Colorectum | FAP |  |
| ∗Top 15 enriched GO BP terms are showed in the bar plot of each disease state in each tissue. Each row represents a significant GO biological process which is colored according to the -log10(p.adjust). |
| Page: 1 2 3 4 5 6 7 8 9 |
| GO ID | Tissue | Disease Stage | Description | Gene Ratio | Bg Ratio | pvalue | p.adjust | Count |
| Page: 1 |
| Pathway ID | Tissue | Disease Stage | Description | Gene Ratio | Bg Ratio | pvalue | p.adjust | qvalue | Count |
| Page: 1 |
Top |
Cell-cell communication analysis |
| Identification of potential cell-cell interactions between two cell types and their ligand-receptor pairs for different disease states |
| Ligand | Receptor | LRpair | Pathway | Tissue | Disease Stage |
| Page: 1 |
Top |
Single-cell gene regulatory network inference analysis |
| Find out the significant the regulons (TFs) and the target genes of each regulon across cell types for different disease states |
| TF | Cell Type | Tissue | Disease Stage | Target Gene | RSS | Regulon Activity |
| ∗The dot plots of a searched regulon are shown for all cell subpopulations in each disease state of each tissue based on the regulon specific score inferred using pySCENIC and by calculating the average expression. |
| Page: 1 |
Top |
Somatic mutation of malignant transformation related genes |
| Annotation of somatic variants for genes involved in malignant transformation |
| Hugo Symbol | Variant Class | Variant Classification | dbSNP RS | HGVSc | HGVSp | HGVSp Short | SWISSPROT | BIOTYPE | SIFT | PolyPhen | Tumor Sample Barcode | Tissue | Histology | Sex | Age | Stage | Therapy Types | Drugs | Outcome |
| C15orf57 | insertion | Nonsense_Mutation | novel | c.17_18insGGAGAATTGATGTTTCTCATGAAATGGAAAGATTCAGATGAGG | p.Arg7GlufsTer3 | p.R7Efs*3 | Q9BV29 | protein_coding | TCGA-BH-A0AY-01 | Breast | breast invasive carcinoma | Female | <65 | I/II | Chemotherapy | SD | |||
| C15orf57 | SNV | Missense_Mutation | rs139886034 | c.332G>A | p.Arg111Gln | p.R111Q | Q9BV29 | protein_coding | tolerated(0.15) | benign(0.049) | TCGA-AA-3510-01 | Colorectum | colon adenocarcinoma | Male | >=65 | I/II | Unknown | Unknown | SD |
| C15orf57 | SNV | Missense_Mutation | c.152N>T | p.Ser51Phe | p.S51F | Q9BV29 | protein_coding | deleterious(0) | probably_damaging(0.964) | TCGA-A5-A2K3-01 | Endometrium | uterine corpus endometrioid carcinoma | Female | >=65 | I/II | Chemotherapy | carboplatin | SD | |
| C15orf57 | SNV | Missense_Mutation | novel | c.164N>A | p.Ser55Tyr | p.S55Y | Q9BV29 | protein_coding | deleterious(0.02) | possibly_damaging(0.804) | TCGA-E6-A1LX-01 | Endometrium | uterine corpus endometrioid carcinoma | Female | <65 | I/II | Unknown | Unknown | SD |
| C15orf57 | SNV | Missense_Mutation | novel | c.30G>T | p.Met10Ile | p.M10I | Q9BV29 | protein_coding | deleterious_low_confidence(0) | benign(0.05) | TCGA-EO-A3B0-01 | Endometrium | uterine corpus endometrioid carcinoma | Female | <65 | III/IV | Unknown | Unknown | SD |
| C15orf57 | SNV | Missense_Mutation | novel | c.250G>A | p.Glu84Lys | p.E84K | Q9BV29 | protein_coding | deleterious(0.01) | possibly_damaging(0.889) | TCGA-EY-A1GI-01 | Endometrium | uterine corpus endometrioid carcinoma | Female | <65 | I/II | Unknown | Unknown | SD |
| C15orf57 | SNV | Missense_Mutation | rs139886034 | c.332N>A | p.Arg111Gln | p.R111Q | Q9BV29 | protein_coding | tolerated(0.15) | benign(0.049) | TCGA-FI-A2D5-01 | Endometrium | uterine corpus endometrioid carcinoma | Female | <65 | III/IV | Chemotherapy | carboplatinum | PD |
| C15orf57 | SNV | Missense_Mutation | c.27A>T | p.Gln9His | p.Q9H | Q9BV29 | protein_coding | deleterious_low_confidence(0.04) | benign(0.005) | TCGA-55-7727-01 | Lung | lung adenocarcinoma | Male | >=65 | III/IV | Unknown | Unknown | SD | |
| C15orf57 | SNV | Missense_Mutation | c.94T>C | p.Cys32Arg | p.C32R | Q9BV29 | protein_coding | deleterious(0) | possibly_damaging(0.734) | TCGA-18-3409-01 | Lung | lung squamous cell carcinoma | Male | >=65 | I/II | Unknown | Unknown | PD | |
| C15orf57 | SNV | Missense_Mutation | novel | c.278N>T | p.Lys93Met | p.K93M | Q9BV29 | protein_coding | deleterious(0) | probably_damaging(0.964) | TCGA-22-1016-01 | Lung | lung squamous cell carcinoma | Male | >=65 | I/II | Unknown | Unknown | SD |
| Page: 1 2 |
Top |
Related drugs of malignant transformation related genes |
| Identification of chemicals and drugs interact with genes involved in malignant transfromation |
| (DGIdb 4.0) |
| Entrez ID | Symbol | Category | Interaction Types | Drug Claim Name | Drug Name | PMIDs |
| Page: 1 |

Copyright 2023-Present -The University of Texas Health Science Center at Houston |