
|
|||||
|
 | |
| |
| |
| |
| |
| |
|
Gene: BCL7A |
Gene summary for BCL7A |
| Gene information | Species | Human | Gene symbol | BCL7A | Gene ID | 605 |
| Gene name | BAF chromatin remodeling complex subunit BCL7A | |
| Gene Alias | BCL7 | |
| Cytomap | 12q24.31 | |
| Gene Type | protein-coding | GO ID | GO:0006139 | UniProtAcc | Q4VC05 |
Top |
Malignant transformation analysis |
| Identification of the aberrant gene expression in precancerous and cancerous lesions by comparing the gene expression of stem-like cells in diseased tissues with normal stem cells |
| Entrez ID | Symbol | Replicates | Species | Organ | Tissue | Adj P-value | Log2FC | Malignancy |
| 605 | BCL7A | P61T-E | Human | Esophagus | ESCC | 9.49e-20 | 3.74e-01 | 0.099 |
| 605 | BCL7A | P62T-E | Human | Esophagus | ESCC | 5.61e-18 | 2.34e-01 | 0.1302 |
| 605 | BCL7A | P65T-E | Human | Esophagus | ESCC | 1.86e-15 | 2.04e-01 | 0.0978 |
| 605 | BCL7A | P74T-E | Human | Esophagus | ESCC | 1.82e-13 | 4.06e-01 | 0.1479 |
| 605 | BCL7A | P75T-E | Human | Esophagus | ESCC | 4.43e-16 | 3.25e-01 | 0.1125 |
| 605 | BCL7A | P76T-E | Human | Esophagus | ESCC | 1.68e-16 | 2.28e-01 | 0.1207 |
| 605 | BCL7A | P79T-E | Human | Esophagus | ESCC | 1.10e-30 | 5.55e-01 | 0.1154 |
| 605 | BCL7A | P80T-E | Human | Esophagus | ESCC | 5.56e-29 | 8.32e-01 | 0.155 |
| 605 | BCL7A | P82T-E | Human | Esophagus | ESCC | 4.56e-04 | 2.03e-01 | 0.1072 |
| 605 | BCL7A | P83T-E | Human | Esophagus | ESCC | 3.79e-16 | 5.25e-01 | 0.1738 |
| 605 | BCL7A | P89T-E | Human | Esophagus | ESCC | 6.12e-06 | 4.03e-01 | 0.1752 |
| 605 | BCL7A | P91T-E | Human | Esophagus | ESCC | 2.50e-04 | 5.41e-01 | 0.1828 |
| 605 | BCL7A | P107T-E | Human | Esophagus | ESCC | 8.03e-22 | 4.52e-01 | 0.171 |
| 605 | BCL7A | P127T-E | Human | Esophagus | ESCC | 1.76e-10 | 3.82e-02 | 0.0826 |
| 605 | BCL7A | P128T-E | Human | Esophagus | ESCC | 5.77e-08 | 2.02e-01 | 0.1241 |
| 605 | BCL7A | P130T-E | Human | Esophagus | ESCC | 2.27e-45 | 8.40e-01 | 0.1676 |
| 605 | BCL7A | S43 | Human | Liver | Cirrhotic | 3.01e-04 | -1.68e-01 | -0.0187 |
| 605 | BCL7A | HCC1_Meng | Human | Liver | HCC | 5.51e-60 | -4.64e-02 | 0.0246 |
| 605 | BCL7A | HCC2_Meng | Human | Liver | HCC | 3.38e-11 | -9.39e-02 | 0.0107 |
| 605 | BCL7A | cirrhotic1 | Human | Liver | Cirrhotic | 1.27e-05 | 1.92e-01 | 0.0202 |
| Page: 1 2 3 4 5 |
| Tissue | Expression Dynamics | Abbreviation |
| Esophagus | 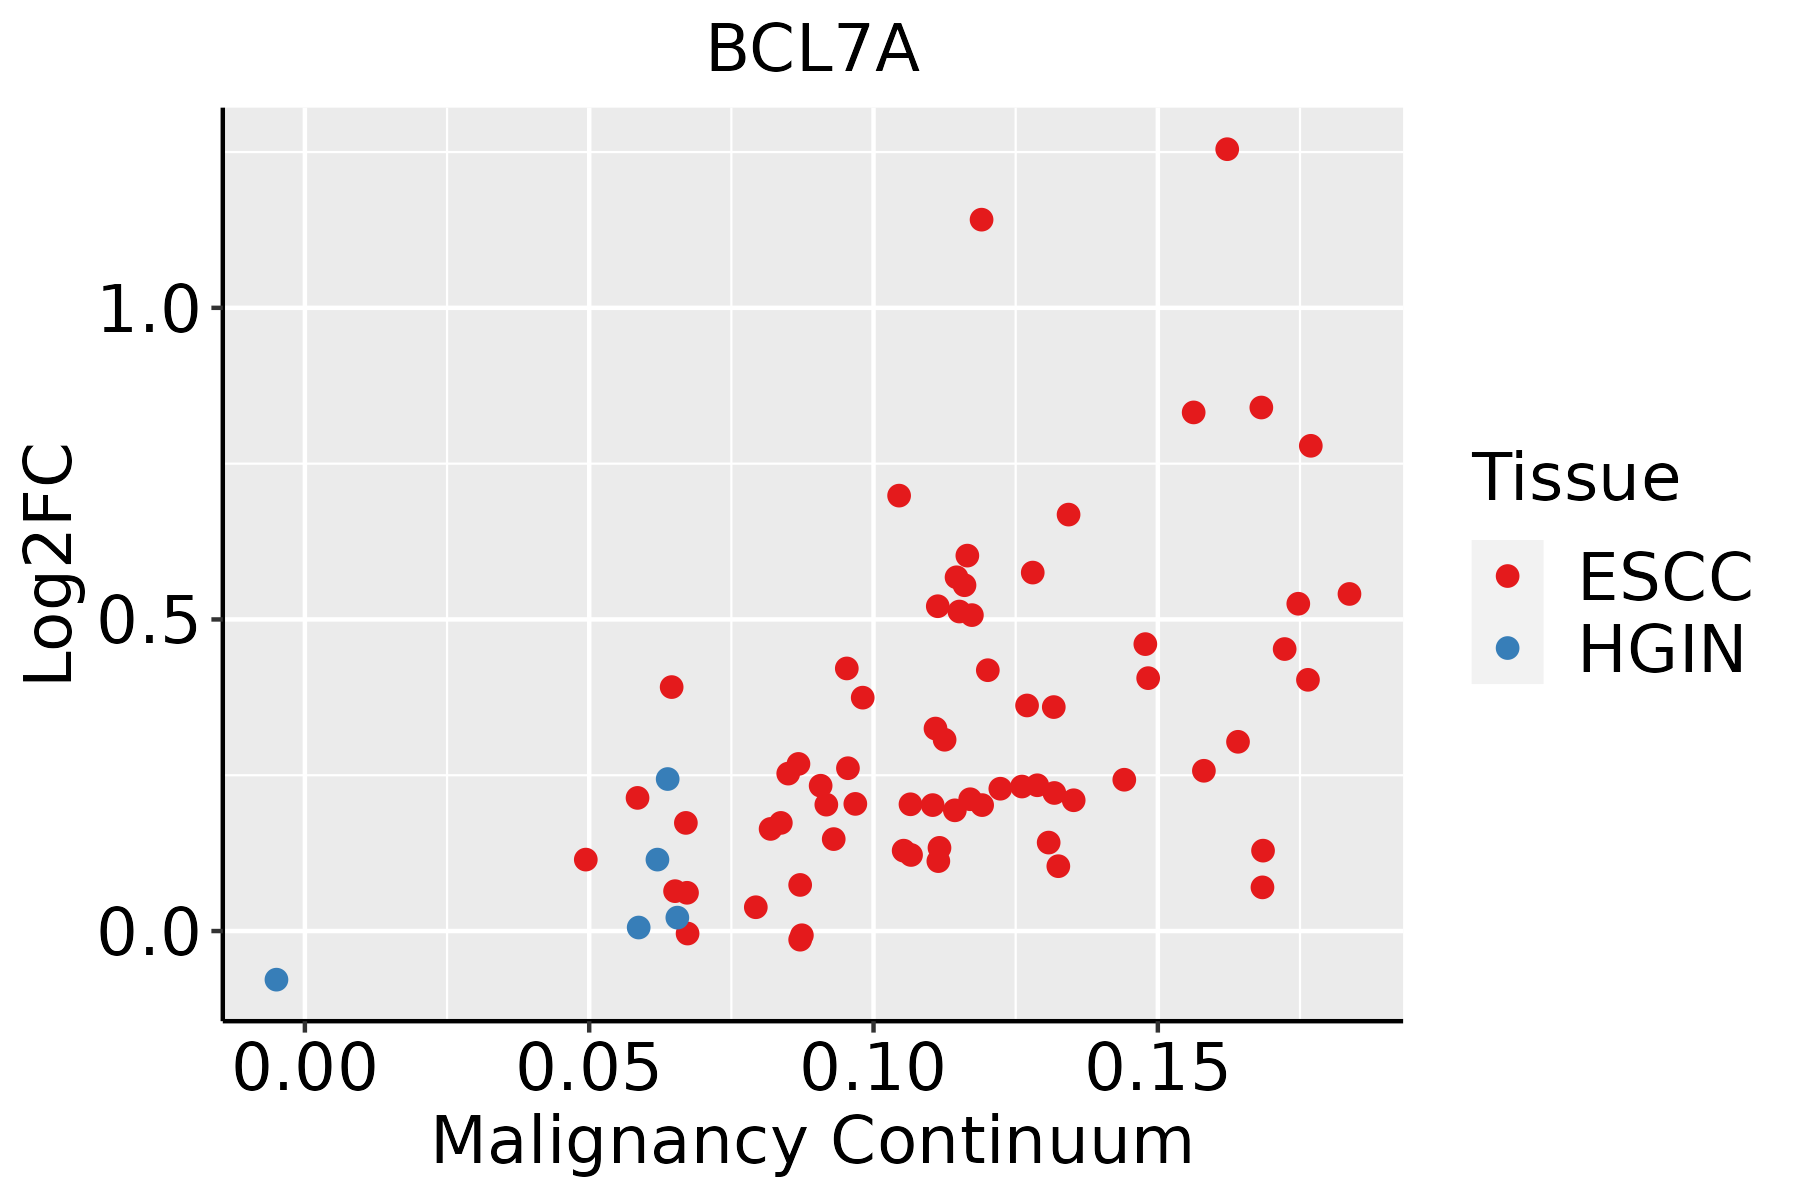 | ESCC: Esophageal squamous cell carcinoma |
| HGIN: High-grade intraepithelial neoplasias | ||
| LGIN: Low-grade intraepithelial neoplasias | ||
| Liver |  | HCC: Hepatocellular carcinoma |
| NAFLD: Non-alcoholic fatty liver disease | ||
| Oral Cavity | 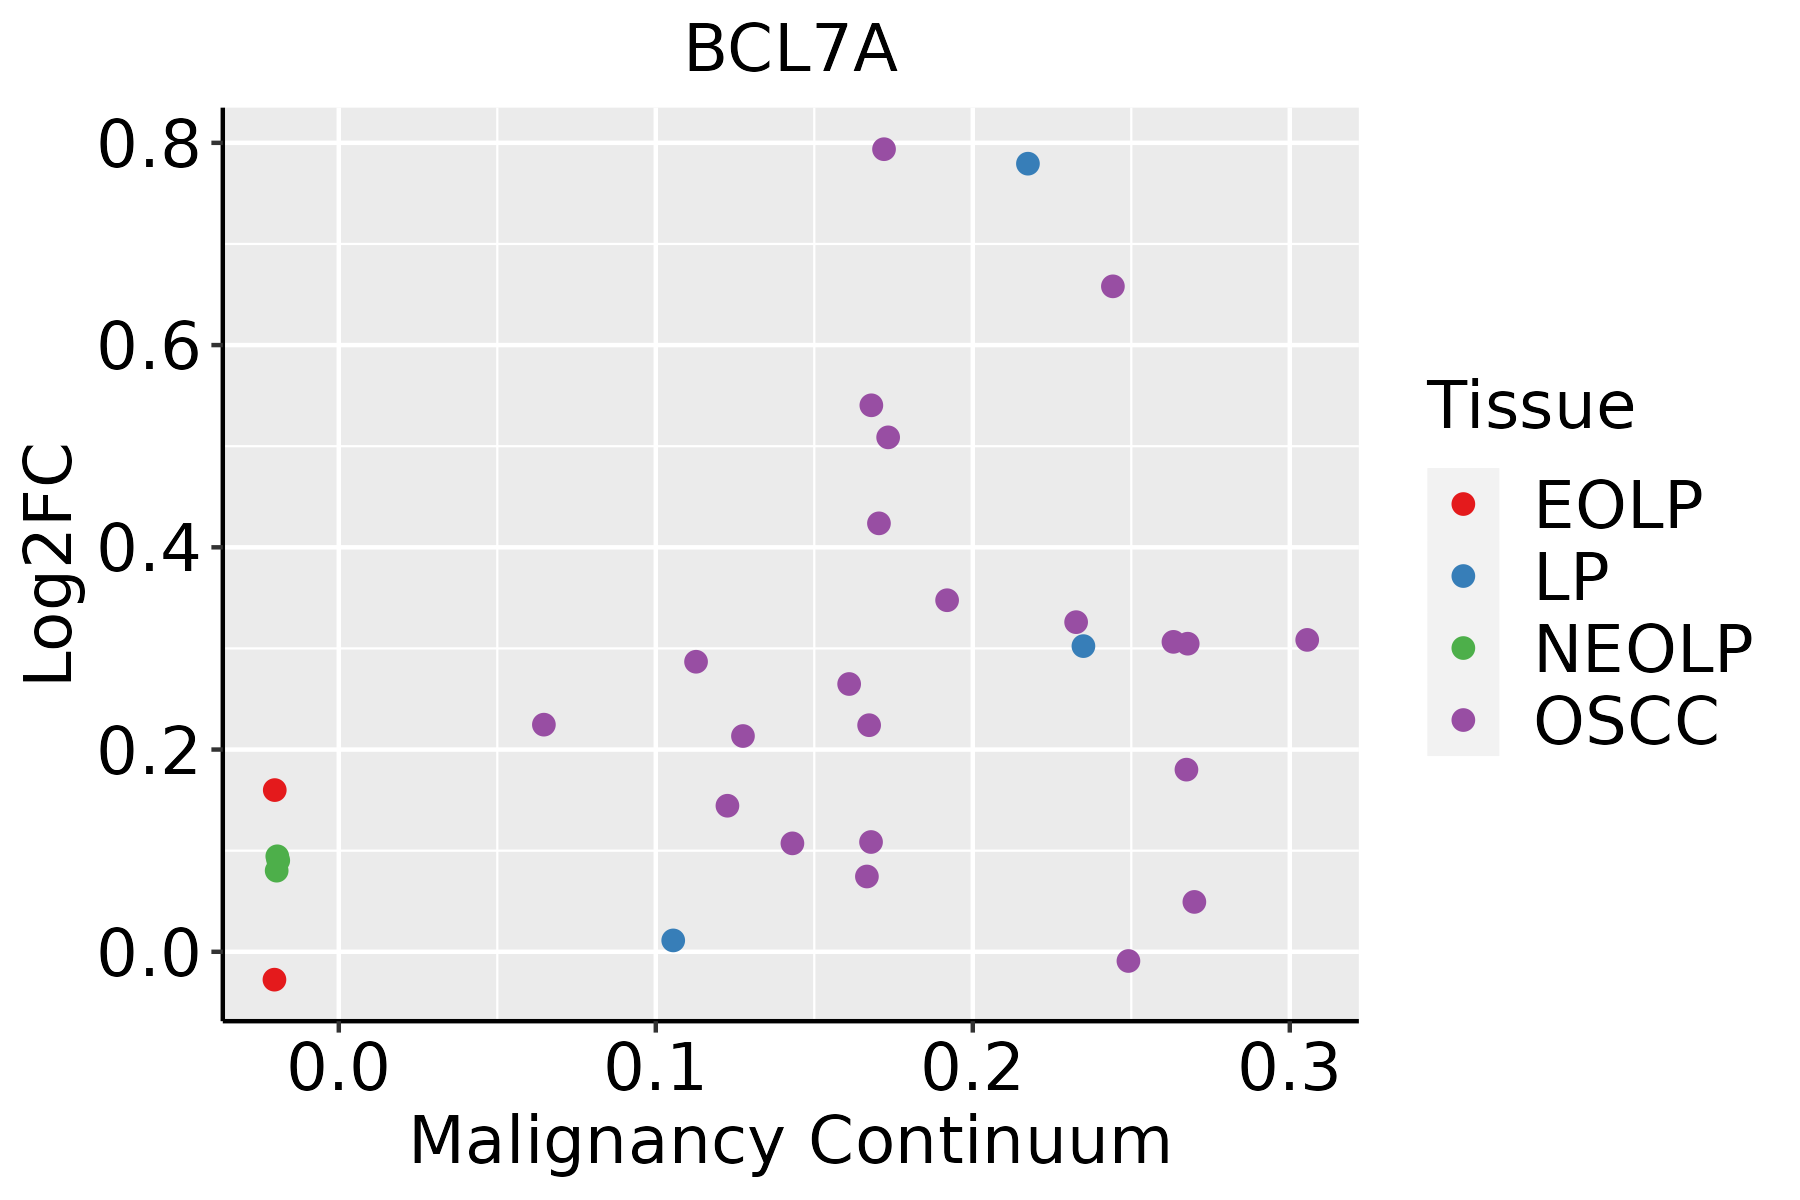 | EOLP: Erosive Oral lichen planus |
| LP: leukoplakia | ||
| NEOLP: Non-erosive oral lichen planus | ||
| OSCC: Oral squamous cell carcinoma | ||
| Thyroid | 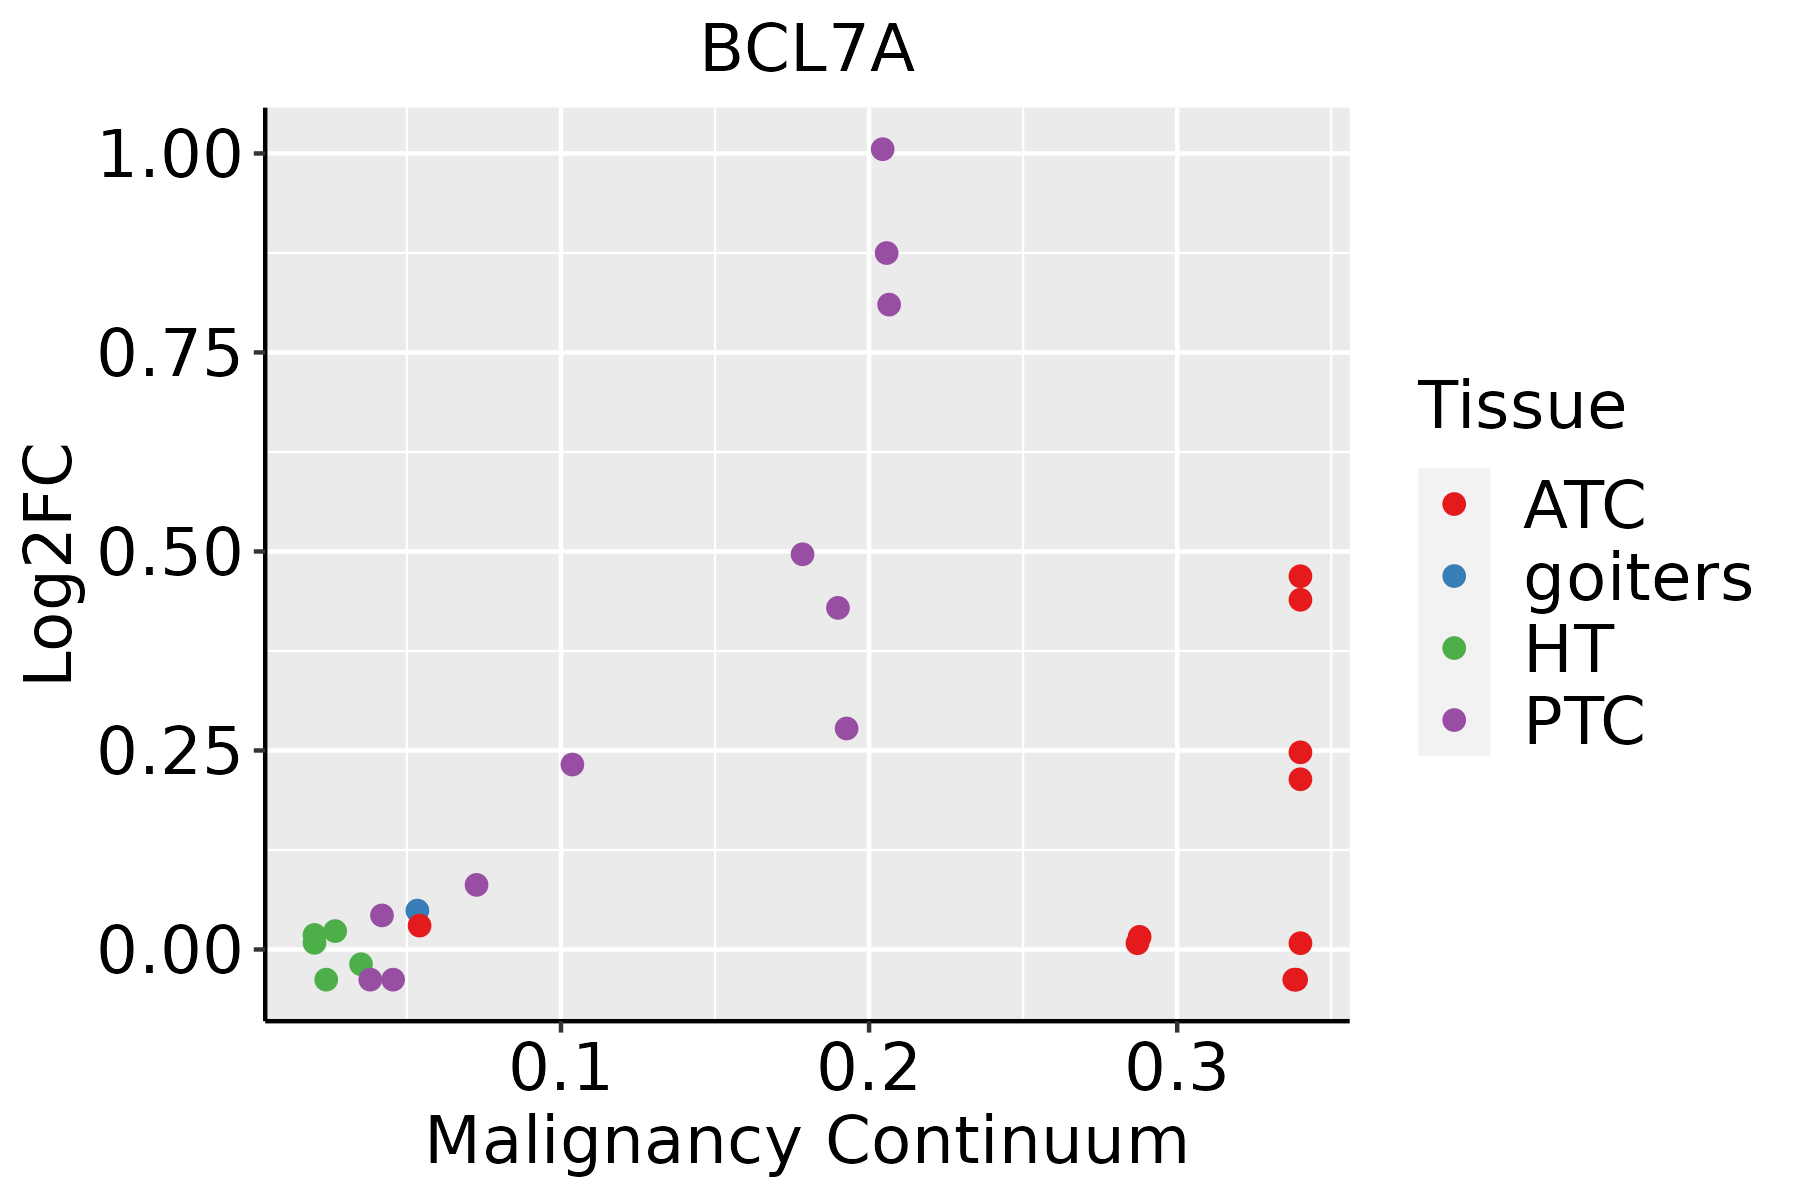 | ATC: Anaplastic thyroid cancer |
| HT: Hashimoto's thyroiditis | ||
| PTC: Papillary thyroid cancer |
| ∗log2FC in expression of this searched gene in stem-like cells from each diseased tissue sample relative to stem-like cells in normal samples in each tissue plotted against the malignancy continuum. Samples are colored based on if they are from different disease stage. |
Top |
Malignant transformation related pathway analysis |
| Find out the enriched GO biological processes and KEGG pathways involved in transition from healthy to precancer to cancer |
| Tissue | Disease Stage | Enriched GO biological Processes |
| Colorectum | AD |  |
| Colorectum | SER |  |
| Colorectum | MSS |  |
| Colorectum | MSI-H |  |
| Colorectum | FAP |  |
| ∗Top 15 enriched GO BP terms are showed in the bar plot of each disease state in each tissue. Each row represents a significant GO biological process which is colored according to the -log10(p.adjust). |
| Page: 1 2 3 4 5 6 7 8 9 |
| GO ID | Tissue | Disease Stage | Description | Gene Ratio | Bg Ratio | pvalue | p.adjust | Count |
| Page: 1 |
| Pathway ID | Tissue | Disease Stage | Description | Gene Ratio | Bg Ratio | pvalue | p.adjust | qvalue | Count |
| Page: 1 |
Top |
Cell-cell communication analysis |
| Identification of potential cell-cell interactions between two cell types and their ligand-receptor pairs for different disease states |
| Ligand | Receptor | LRpair | Pathway | Tissue | Disease Stage |
| Page: 1 |
Top |
Single-cell gene regulatory network inference analysis |
| Find out the significant the regulons (TFs) and the target genes of each regulon across cell types for different disease states |
| TF | Cell Type | Tissue | Disease Stage | Target Gene | RSS | Regulon Activity |
| ∗The dot plots of a searched regulon are shown for all cell subpopulations in each disease state of each tissue based on the regulon specific score inferred using pySCENIC and by calculating the average expression. |
| Page: 1 |
Top |
Somatic mutation of malignant transformation related genes |
| Annotation of somatic variants for genes involved in malignant transformation |
| Hugo Symbol | Variant Class | Variant Classification | dbSNP RS | HGVSc | HGVSp | HGVSp Short | SWISSPROT | BIOTYPE | SIFT | PolyPhen | Tumor Sample Barcode | Tissue | Histology | Sex | Age | Stage | Therapy Types | Drugs | Outcome |
| BCL7A | SNV | Missense_Mutation | c.618N>T | p.Leu206Phe | p.L206F | Q4VC05 | protein_coding | deleterious_low_confidence(0.02) | benign(0.001) | TCGA-A8-A09A-01 | Breast | breast invasive carcinoma | Female | <65 | I/II | Hormone Therapy | tamoxiphen | SD | |
| BCL7A | SNV | Missense_Mutation | novel | c.514C>G | p.Pro172Ala | p.P172A | Q4VC05 | protein_coding | deleterious(0.02) | benign(0.107) | TCGA-D8-A1XQ-01 | Breast | breast invasive carcinoma | Female | >=65 | I/II | Unknown | Unknown | SD |
| BCL7A | SNV | Missense_Mutation | rs763960478 | c.51N>A | p.Asp17Glu | p.D17E | Q4VC05 | protein_coding | deleterious(0.03) | benign(0.391) | TCGA-OL-A66P-01 | Breast | breast invasive carcinoma | Female | >=65 | I/II | Chemotherapy | cytoxan | CR |
| BCL7A | SNV | Missense_Mutation | rs749055080 | c.155N>T | p.Thr52Met | p.T52M | Q4VC05 | protein_coding | deleterious(0.02) | probably_damaging(0.989) | TCGA-AA-A01R-01 | Colorectum | colon adenocarcinoma | Male | <65 | III/IV | Chemotherapy | 5-fluorouracil | PD |
| BCL7A | SNV | Missense_Mutation | rs767784265 | c.620N>T | p.Ser207Leu | p.S207L | Q4VC05 | protein_coding | tolerated_low_confidence(0.96) | benign(0) | TCGA-AG-A002-01 | Colorectum | rectum adenocarcinoma | Male | <65 | I/II | Unknown | Unknown | SD |
| BCL7A | SNV | Missense_Mutation | rs780831032 | c.112N>A | p.Val38Ile | p.V38I | Q4VC05 | protein_coding | tolerated(0.07) | possibly_damaging(0.51) | TCGA-AJ-A3BH-01 | Endometrium | uterine corpus endometrioid carcinoma | Female | Unknown | I/II | Unknown | Unknown | SD |
| BCL7A | SNV | Missense_Mutation | c.498N>T | p.Glu166Asp | p.E166D | Q4VC05 | protein_coding | tolerated(0.14) | probably_damaging(0.99) | TCGA-AX-A05Z-01 | Endometrium | uterine corpus endometrioid carcinoma | Female | <65 | III/IV | Chemotherapy | adriamycin | SD | |
| BCL7A | SNV | Missense_Mutation | novel | c.104N>T | p.Trp35Leu | p.W35L | Q4VC05 | protein_coding | deleterious(0) | probably_damaging(0.998) | TCGA-AX-A1CE-01 | Endometrium | uterine corpus endometrioid carcinoma | Female | <65 | I/II | Unspecific | Paclitaxel | SD |
| BCL7A | SNV | Missense_Mutation | c.157G>A | p.Glu53Lys | p.E53K | Q4VC05 | protein_coding | deleterious(0.01) | benign(0.062) | TCGA-B5-A0JY-01 | Endometrium | uterine corpus endometrioid carcinoma | Female | <65 | III/IV | Chemotherapy | doxorubicin | SD | |
| BCL7A | SNV | Missense_Mutation | novel | c.637N>A | p.Val213Met | p.V213M | Q4VC05 | protein_coding | deleterious_low_confidence(0.04) | benign(0.444) | TCGA-B5-A11R-01 | Endometrium | uterine corpus endometrioid carcinoma | Female | <65 | I/II | Chemotherapy | paclitaxel | SD |
| Page: 1 2 3 |
Top |
Related drugs of malignant transformation related genes |
| Identification of chemicals and drugs interact with genes involved in malignant transfromation |
| (DGIdb 4.0) |
| Entrez ID | Symbol | Category | Interaction Types | Drug Claim Name | Drug Name | PMIDs |
| Page: 1 |

Copyright 2023-Present -The University of Texas Health Science Center at Houston |