
|
|||||
|
 | |
| |
| |
| |
| |
| |
|
Gene: ATXN7L1 |
Gene summary for ATXN7L1 |
| Gene information | Species | Human | Gene symbol | ATXN7L1 | Gene ID | 222255 |
| Gene name | ataxin 7 like 1 | |
| Gene Alias | ATXN7L4 | |
| Cytomap | 7q22.3 | |
| Gene Type | protein-coding | GO ID | GO:0003674 | UniProtAcc | Q9BTQ8 |
Top |
Malignant transformation analysis |
| Identification of the aberrant gene expression in precancerous and cancerous lesions by comparing the gene expression of stem-like cells in diseased tissues with normal stem cells |
| Entrez ID | Symbol | Replicates | Species | Organ | Tissue | Adj P-value | Log2FC | Malignancy |
| 222255 | ATXN7L1 | P8T-E | Human | Esophagus | ESCC | 4.36e-09 | 9.74e-02 | 0.0889 |
| 222255 | ATXN7L1 | P9T-E | Human | Esophagus | ESCC | 1.17e-03 | 1.04e-01 | 0.1131 |
| 222255 | ATXN7L1 | P10T-E | Human | Esophagus | ESCC | 5.73e-11 | 1.58e-01 | 0.116 |
| 222255 | ATXN7L1 | P11T-E | Human | Esophagus | ESCC | 2.80e-03 | 1.90e-01 | 0.1426 |
| 222255 | ATXN7L1 | P12T-E | Human | Esophagus | ESCC | 2.98e-10 | 2.30e-01 | 0.1122 |
| 222255 | ATXN7L1 | P15T-E | Human | Esophagus | ESCC | 3.42e-17 | 3.23e-01 | 0.1149 |
| 222255 | ATXN7L1 | P16T-E | Human | Esophagus | ESCC | 5.47e-13 | 1.95e-01 | 0.1153 |
| 222255 | ATXN7L1 | P17T-E | Human | Esophagus | ESCC | 5.82e-11 | 3.97e-01 | 0.1278 |
| 222255 | ATXN7L1 | P20T-E | Human | Esophagus | ESCC | 2.18e-27 | 6.18e-01 | 0.1124 |
| 222255 | ATXN7L1 | P21T-E | Human | Esophagus | ESCC | 1.03e-14 | 1.43e-01 | 0.1617 |
| 222255 | ATXN7L1 | P22T-E | Human | Esophagus | ESCC | 1.77e-04 | 4.54e-02 | 0.1236 |
| 222255 | ATXN7L1 | P23T-E | Human | Esophagus | ESCC | 3.21e-15 | 3.77e-01 | 0.108 |
| 222255 | ATXN7L1 | P24T-E | Human | Esophagus | ESCC | 2.83e-03 | 6.76e-02 | 0.1287 |
| 222255 | ATXN7L1 | P26T-E | Human | Esophagus | ESCC | 3.16e-12 | 1.15e-01 | 0.1276 |
| 222255 | ATXN7L1 | P27T-E | Human | Esophagus | ESCC | 5.85e-14 | 2.58e-01 | 0.1055 |
| 222255 | ATXN7L1 | P28T-E | Human | Esophagus | ESCC | 1.12e-07 | 1.42e-01 | 0.1149 |
| 222255 | ATXN7L1 | P30T-E | Human | Esophagus | ESCC | 1.30e-02 | 1.44e-01 | 0.137 |
| 222255 | ATXN7L1 | P31T-E | Human | Esophagus | ESCC | 6.01e-08 | 1.16e-01 | 0.1251 |
| 222255 | ATXN7L1 | P32T-E | Human | Esophagus | ESCC | 4.95e-07 | 1.44e-01 | 0.1666 |
| 222255 | ATXN7L1 | P36T-E | Human | Esophagus | ESCC | 4.46e-08 | 2.00e-01 | 0.1187 |
| Page: 1 2 3 4 5 |
| Tissue | Expression Dynamics | Abbreviation |
| Cervix | 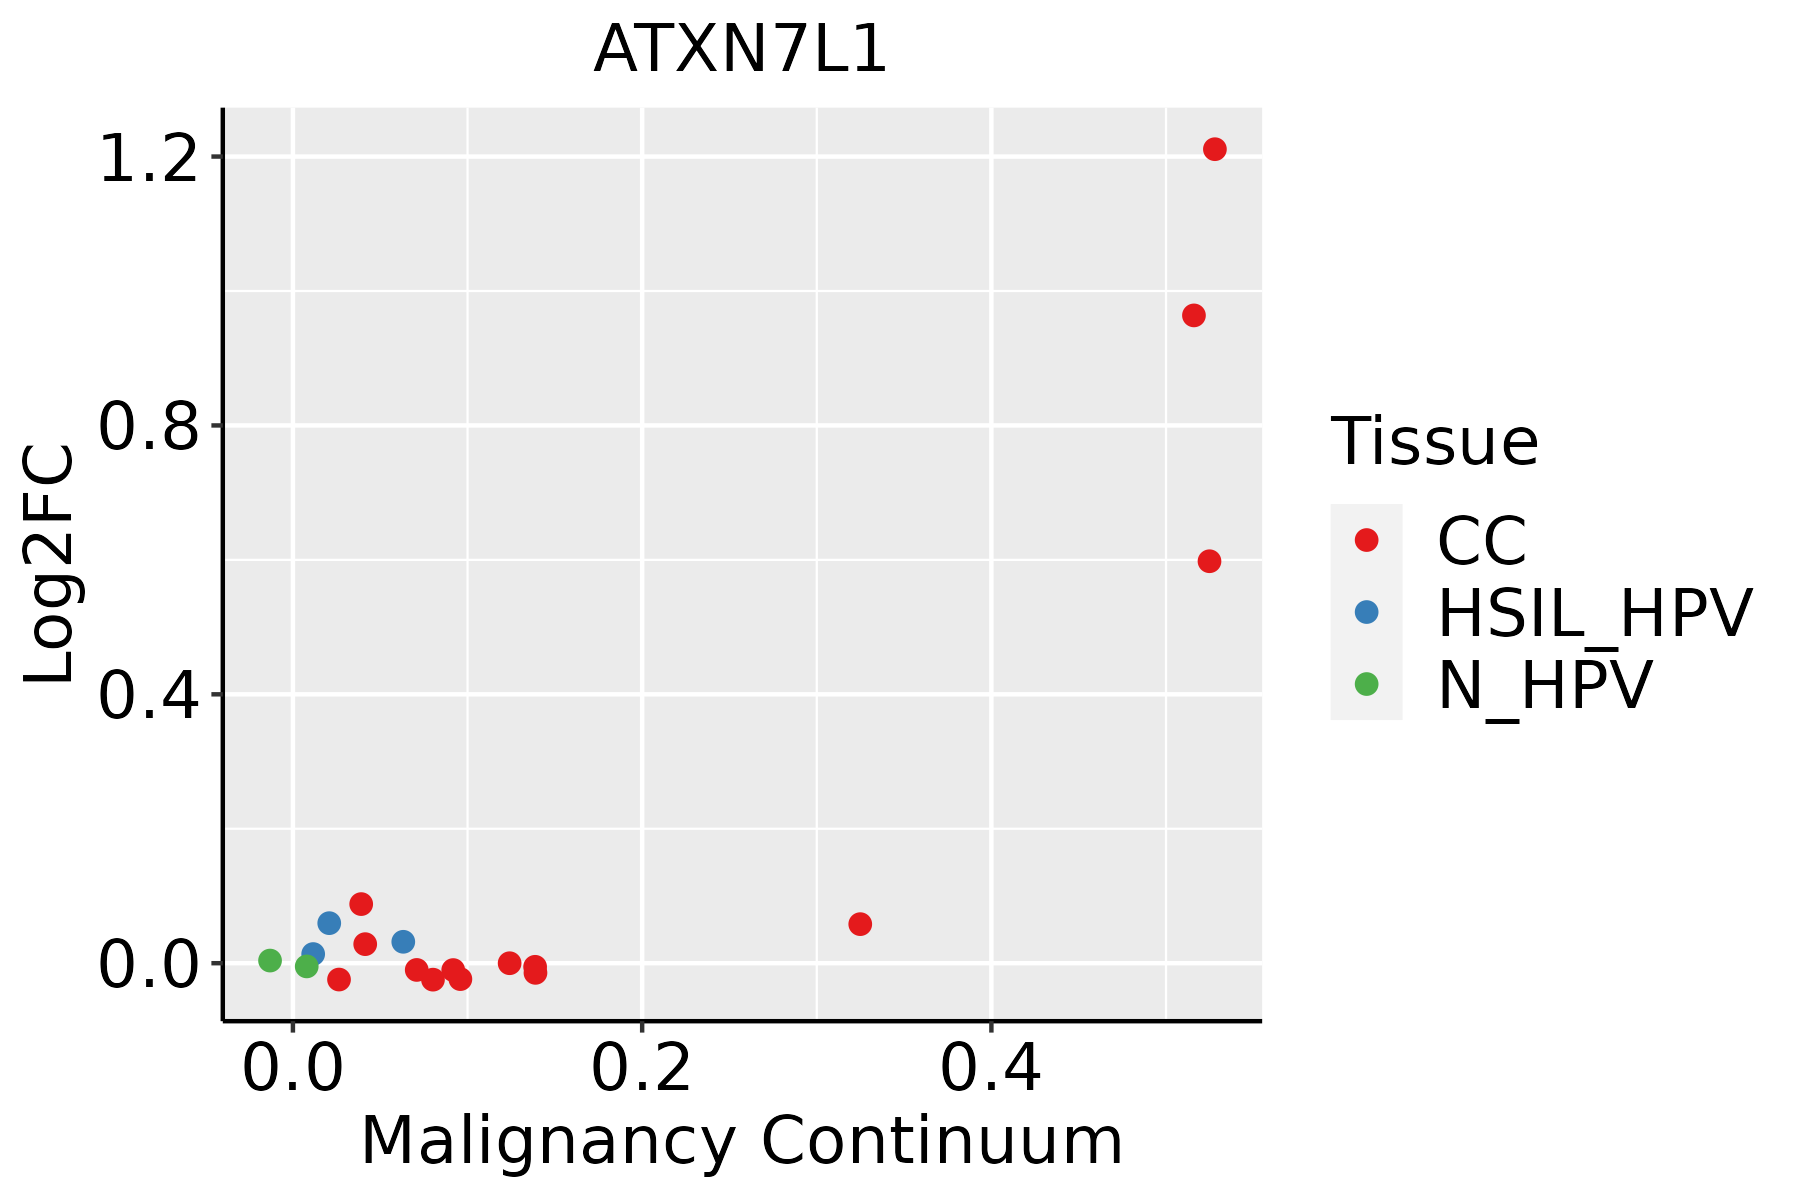 | CC: Cervix cancer |
| HSIL_HPV: HPV-infected high-grade squamous intraepithelial lesions | ||
| N_HPV: HPV-infected normal cervix | ||
| Colorectum (GSE201348) |  | FAP: Familial adenomatous polyposis |
| CRC: Colorectal cancer | ||
| Colorectum (HTA11) |  | AD: Adenomas |
| SER: Sessile serrated lesions | ||
| MSI-H: Microsatellite-high colorectal cancer | ||
| MSS: Microsatellite stable colorectal cancer | ||
| Esophagus | 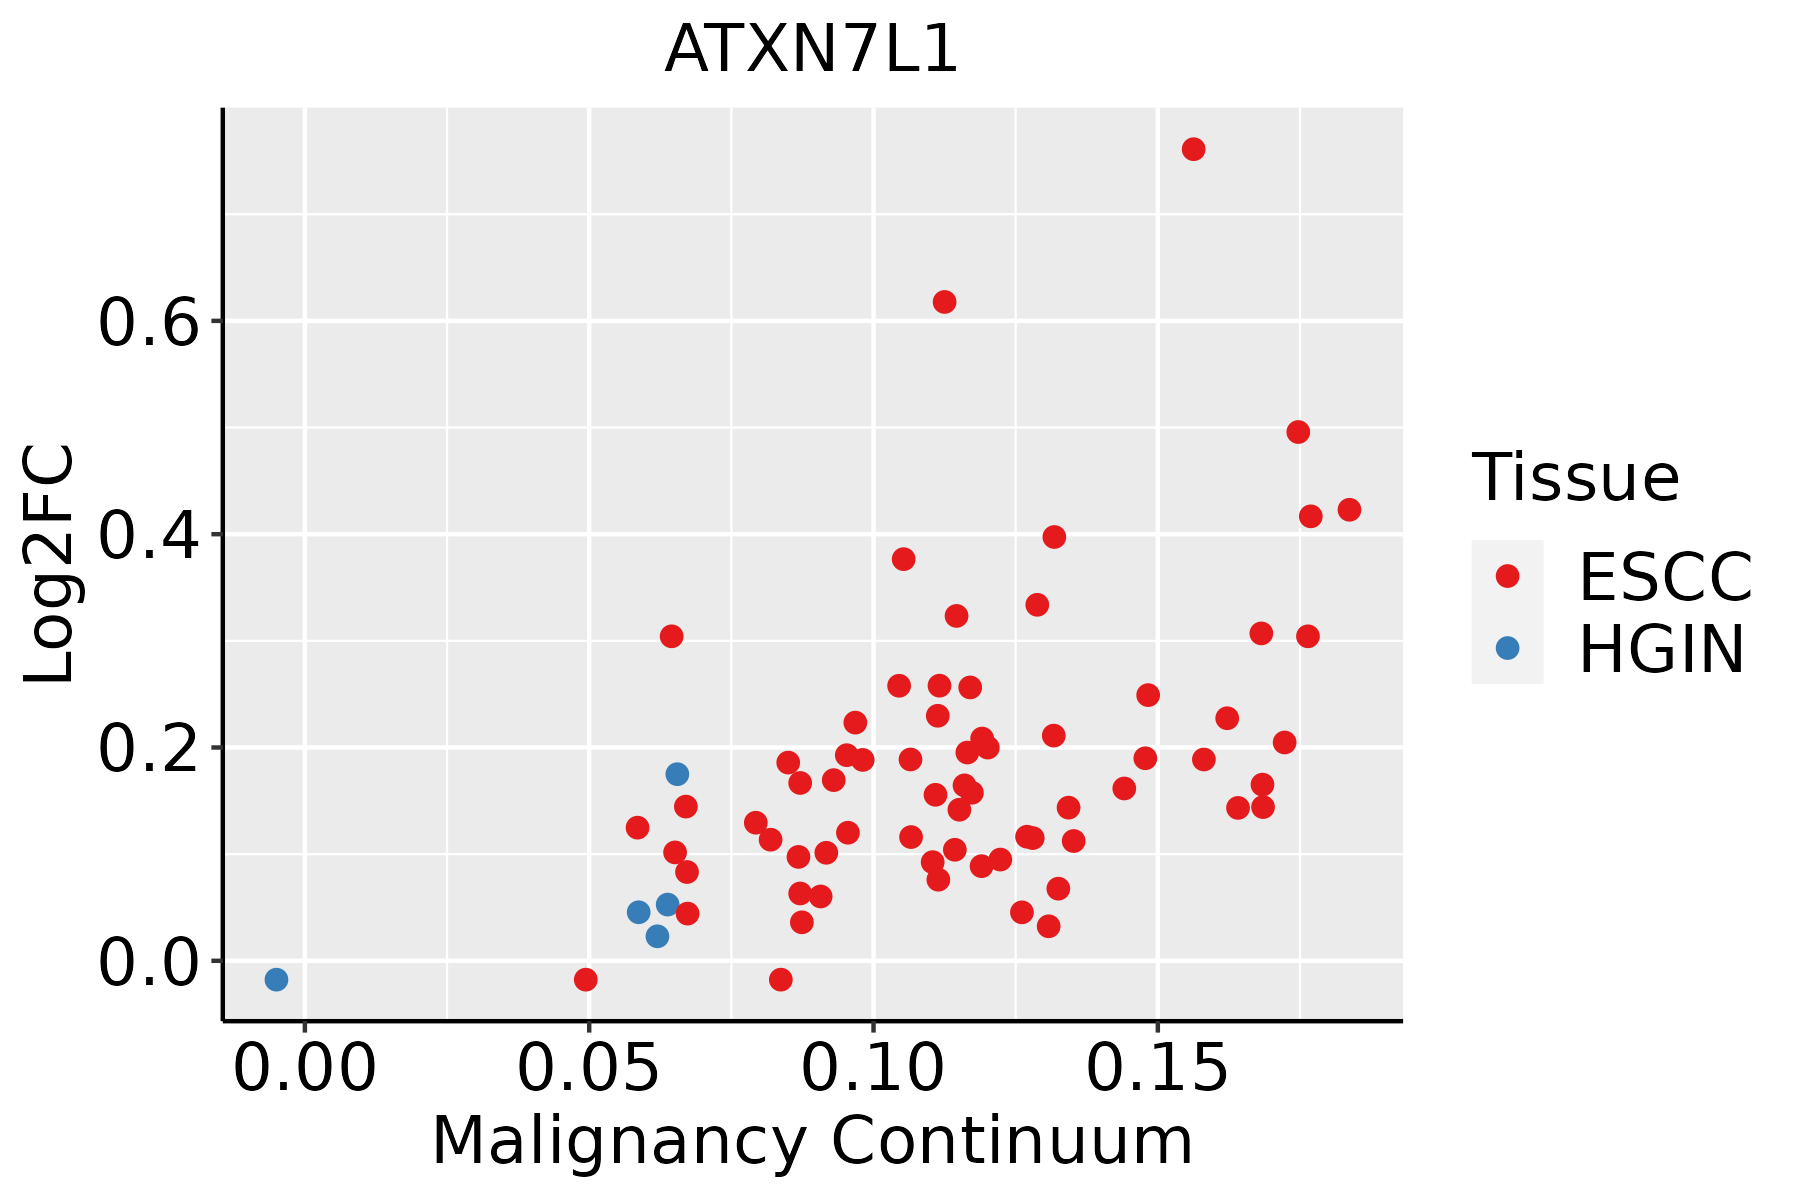 | ESCC: Esophageal squamous cell carcinoma |
| HGIN: High-grade intraepithelial neoplasias | ||
| LGIN: Low-grade intraepithelial neoplasias | ||
| Liver | 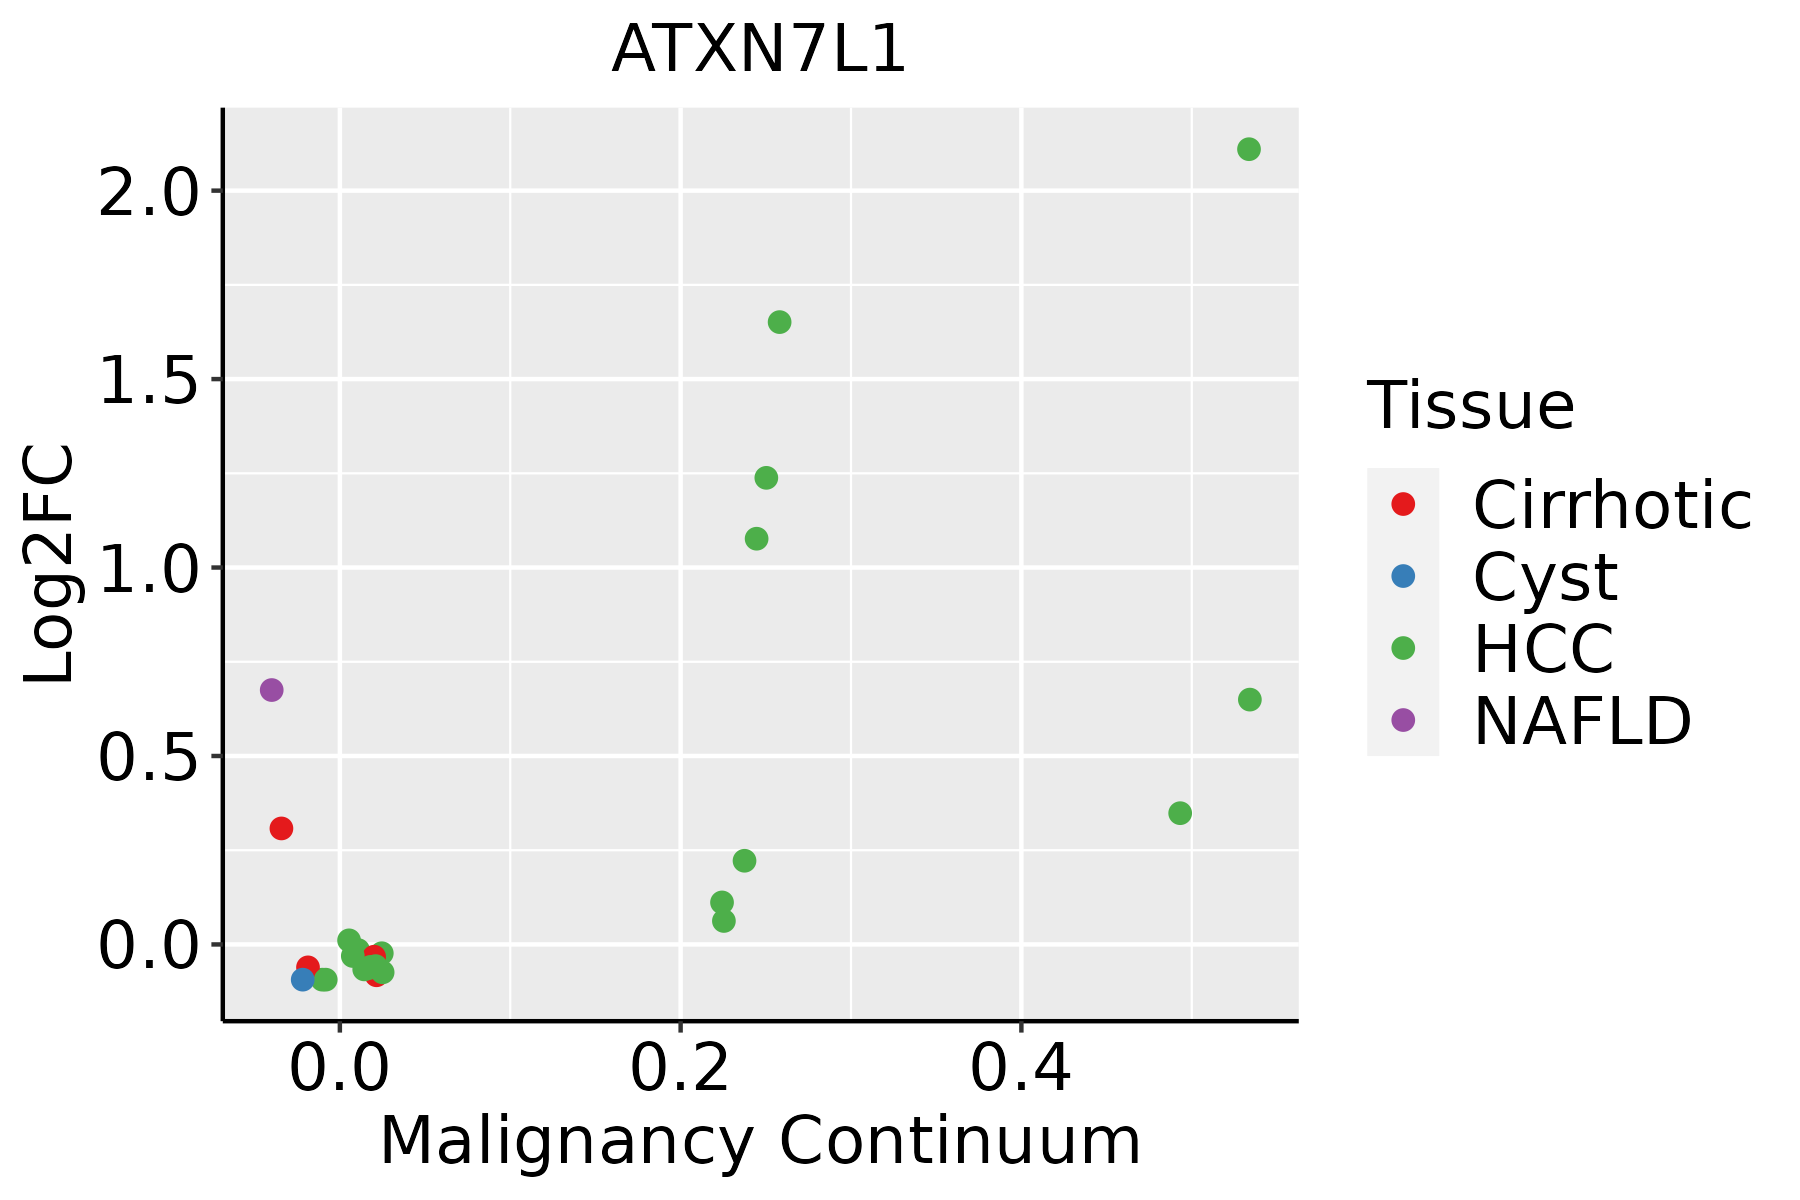 | HCC: Hepatocellular carcinoma |
| NAFLD: Non-alcoholic fatty liver disease | ||
| Lung |  | AAH: Atypical adenomatous hyperplasia |
| AIS: Adenocarcinoma in situ | ||
| IAC: Invasive lung adenocarcinoma | ||
| MIA: Minimally invasive adenocarcinoma |
| ∗log2FC in expression of this searched gene in stem-like cells from each diseased tissue sample relative to stem-like cells in normal samples in each tissue plotted against the malignancy continuum. Samples are colored based on if they are from different disease stage. |
Top |
Malignant transformation related pathway analysis |
| Find out the enriched GO biological processes and KEGG pathways involved in transition from healthy to precancer to cancer |
| Tissue | Disease Stage | Enriched GO biological Processes |
| Colorectum | AD |  |
| Colorectum | SER |  |
| Colorectum | MSS |  |
| Colorectum | MSI-H |  |
| Colorectum | FAP |  |
| ∗Top 15 enriched GO BP terms are showed in the bar plot of each disease state in each tissue. Each row represents a significant GO biological process which is colored according to the -log10(p.adjust). |
| Page: 1 2 3 4 5 6 7 8 9 |
| GO ID | Tissue | Disease Stage | Description | Gene Ratio | Bg Ratio | pvalue | p.adjust | Count |
| Page: 1 |
| Pathway ID | Tissue | Disease Stage | Description | Gene Ratio | Bg Ratio | pvalue | p.adjust | qvalue | Count |
| Page: 1 |
Top |
Cell-cell communication analysis |
| Identification of potential cell-cell interactions between two cell types and their ligand-receptor pairs for different disease states |
| Ligand | Receptor | LRpair | Pathway | Tissue | Disease Stage |
| Page: 1 |
Top |
Single-cell gene regulatory network inference analysis |
| Find out the significant the regulons (TFs) and the target genes of each regulon across cell types for different disease states |
| TF | Cell Type | Tissue | Disease Stage | Target Gene | RSS | Regulon Activity |
| ∗The dot plots of a searched regulon are shown for all cell subpopulations in each disease state of each tissue based on the regulon specific score inferred using pySCENIC and by calculating the average expression. |
| Page: 1 |
Top |
Somatic mutation of malignant transformation related genes |
| Annotation of somatic variants for genes involved in malignant transformation |
| Hugo Symbol | Variant Class | Variant Classification | dbSNP RS | HGVSc | HGVSp | HGVSp Short | SWISSPROT | BIOTYPE | SIFT | PolyPhen | Tumor Sample Barcode | Tissue | Histology | Sex | Age | Stage | Therapy Types | Drugs | Outcome |
| ATXN7L1 | SNV | Missense_Mutation | c.915N>C | p.Lys305Asn | p.K305N | Q9ULK2 | protein_coding | deleterious(0) | probably_damaging(0.984) | TCGA-AC-A23H-01 | Breast | breast invasive carcinoma | Female | >=65 | I/II | Unknown | Unknown | PD | |
| ATXN7L1 | SNV | Missense_Mutation | rs533762062 | c.692N>T | p.Ser231Leu | p.S231L | Q9ULK2 | protein_coding | tolerated(0.17) | benign(0) | TCGA-AN-A0XU-01 | Breast | breast invasive carcinoma | Female | <65 | I/II | Unknown | Unknown | SD |
| ATXN7L1 | SNV | Missense_Mutation | c.1757N>T | p.His586Leu | p.H586L | Q9ULK2 | protein_coding | tolerated(0.57) | benign(0.025) | TCGA-E2-A14T-01 | Breast | breast invasive carcinoma | Female | <65 | I/II | Chemotherapy | doxorubicin | SD | |
| ATXN7L1 | insertion | Frame_Shift_Ins | novel | c.111_112insTGCTTGCATAGTTTTTTGGGTACCTATCTGGGCCAGGTAGATGGAA | p.Ser38CysfsTer59 | p.S38Cfs*59 | Q9ULK2 | protein_coding | TCGA-A2-A0D1-01 | Breast | breast invasive carcinoma | Female | >=65 | I/II | Chemotherapy | taxotere | SD | ||
| ATXN7L1 | deletion | Frame_Shift_Del | c.220delA | p.Ser74AlafsTer5 | p.S74Afs*5 | Q9ULK2 | protein_coding | TCGA-D8-A1XK-01 | Breast | breast invasive carcinoma | Female | <65 | I/II | Chemotherapy | doxorubicine+cyclophosphamide | SD | |||
| ATXN7L1 | deletion | Frame_Shift_Del | novel | c.1793delN | p.Phe598SerfsTer83 | p.F598Sfs*83 | Q9ULK2 | protein_coding | TCGA-D8-A27V-01 | Breast | breast invasive carcinoma | Female | <65 | I/II | Hormone Therapy | tamoxiphen | SD | ||
| ATXN7L1 | deletion | Frame_Shift_Del | novel | c.1271delN | p.Pro424HisfsTer29 | p.P424Hfs*29 | Q9ULK2 | protein_coding | TCGA-D8-A27V-01 | Breast | breast invasive carcinoma | Female | <65 | I/II | Hormone Therapy | tamoxiphen | SD | ||
| ATXN7L1 | deletion | Frame_Shift_Del | novel | c.955delN | p.Leu319Ter | p.L319* | Q9ULK2 | protein_coding | TCGA-D8-A27V-01 | Breast | breast invasive carcinoma | Female | <65 | I/II | Hormone Therapy | tamoxiphen | SD | ||
| ATXN7L1 | SNV | Missense_Mutation | c.2326G>A | p.Glu776Lys | p.E776K | Q9ULK2 | protein_coding | tolerated(0.18) | benign(0.202) | TCGA-EK-A2RJ-01 | Cervix | cervical & endocervical cancer | Female | <65 | I/II | Unknown | Unknown | SD | |
| ATXN7L1 | SNV | Missense_Mutation | rs367798315 | c.2180C>T | p.Ala727Val | p.A727V | Q9ULK2 | protein_coding | tolerated(0.1) | benign(0) | TCGA-A6-6653-01 | Colorectum | colon adenocarcinoma | Male | >=65 | I/II | Unknown | Unknown | SD |
| Page: 1 2 3 4 5 6 |
Top |
Related drugs of malignant transformation related genes |
| Identification of chemicals and drugs interact with genes involved in malignant transfromation |
| (DGIdb 4.0) |
| Entrez ID | Symbol | Category | Interaction Types | Drug Claim Name | Drug Name | PMIDs |
| Page: 1 |

Copyright 2023-Present -The University of Texas Health Science Center at Houston |