Schematic overview of the cellular and molecular mechanisms involved in the cancer progression, including the proposed cellular and molecular mechanisms in cancer cells trajectory. AT1: alveolar type 1 cells; AT2: alveolar type 2 cells; AAH: atypical adenomatous hyperplasia; AIS: adenocarcinoma in situ; MIA: minimally invasive adenocarcinoma; IA: invasive adenocarcinoma; EMT: epithelial-mesenchymal transition

Home

Download

Statistics

Help

Contact

Center for Computational Systems Medicine
leaf

Gene summary

leaf

Malignant transformation analysis

leaf

Malignant transformation related pathway analysis

leaf

Cell-cell communication analysis

leaf

Single-cell gene regulatory network inference analysis

leaf

Somatic mutation of malignant transformation related genes

leaf

Related drugs of malignant transformation related genes

Gene: ASNSD1

Gene summary for ASNSD1

check button Gene summary.

Gene informationSpeciesHuman
Gene symbol

ASNSD1

Gene ID

54529

Gene nameasparagine synthetase domain containing 1
Gene AliasNBLA00058
Cytomap2q32.2
Gene Typeprotein-coding
GO ID

GO:0006082

UniProtAcc

Q9NWL6


Top

Malignant transformation analysis

check button Identification of the aberrant gene expression in precancerous and cancerous lesions by comparing the gene expression of stem-like cells in diseased tissues with normal stem cells
check button Malignant transformation involving gene list.
Entrez IDSymbolReplicatesSpeciesOrganTissueAdj P-valueLog2FCMalignancy
54529ASNSD1P74T-EHumanEsophagusESCC5.27e-174.75e-010.1479
54529ASNSD1P75T-EHumanEsophagusESCC2.07e-316.33e-010.1125
54529ASNSD1P76T-EHumanEsophagusESCC1.87e-163.14e-010.1207
54529ASNSD1P79T-EHumanEsophagusESCC1.92e-254.36e-010.1154
54529ASNSD1P80T-EHumanEsophagusESCC1.23e-155.23e-010.155
54529ASNSD1P82T-EHumanEsophagusESCC7.92e-115.83e-010.1072
54529ASNSD1P83T-EHumanEsophagusESCC2.36e-287.54e-010.1738
54529ASNSD1P84T-EHumanEsophagusESCC1.36e-063.79e-010.0933
54529ASNSD1P89T-EHumanEsophagusESCC1.34e-171.06e+000.1752
54529ASNSD1P91T-EHumanEsophagusESCC2.07e-098.79e-010.1828
54529ASNSD1P104T-EHumanEsophagusESCC9.45e-053.26e-010.0931
54529ASNSD1P107T-EHumanEsophagusESCC1.10e-428.78e-010.171
54529ASNSD1P126T-EHumanEsophagusESCC5.15e-121.01e+000.1125
54529ASNSD1P127T-EHumanEsophagusESCC1.22e-142.05e-010.0826
54529ASNSD1P128T-EHumanEsophagusESCC3.73e-461.32e+000.1241
54529ASNSD1P130T-EHumanEsophagusESCC2.69e-459.10e-010.1676
54529ASNSD1HCC1_MengHumanLiverHCC4.62e-615.53e-020.0246
54529ASNSD1HCC2_MengHumanLiverHCC1.34e-336.93e-020.0107
54529ASNSD1HCC1HumanLiverHCC1.01e-033.17e+000.5336
54529ASNSD1HCC2HumanLiverHCC1.17e-083.80e+000.5341
Page: 1 2 3 4 5 6 

check button Transcriptomic changes along malignancy continuum.
TissueExpression DynamicsAbbreviation
EsophagusThe image shows the transcriptomic changes along malignancy continuum.log2FC in expression of this searched gene in stem-like cells from each diseased tissue sample relative to stem-like cells in normal samples in each tissue plotted against the malignancy continuum. Samples are colored based on if they are from different disease stage.
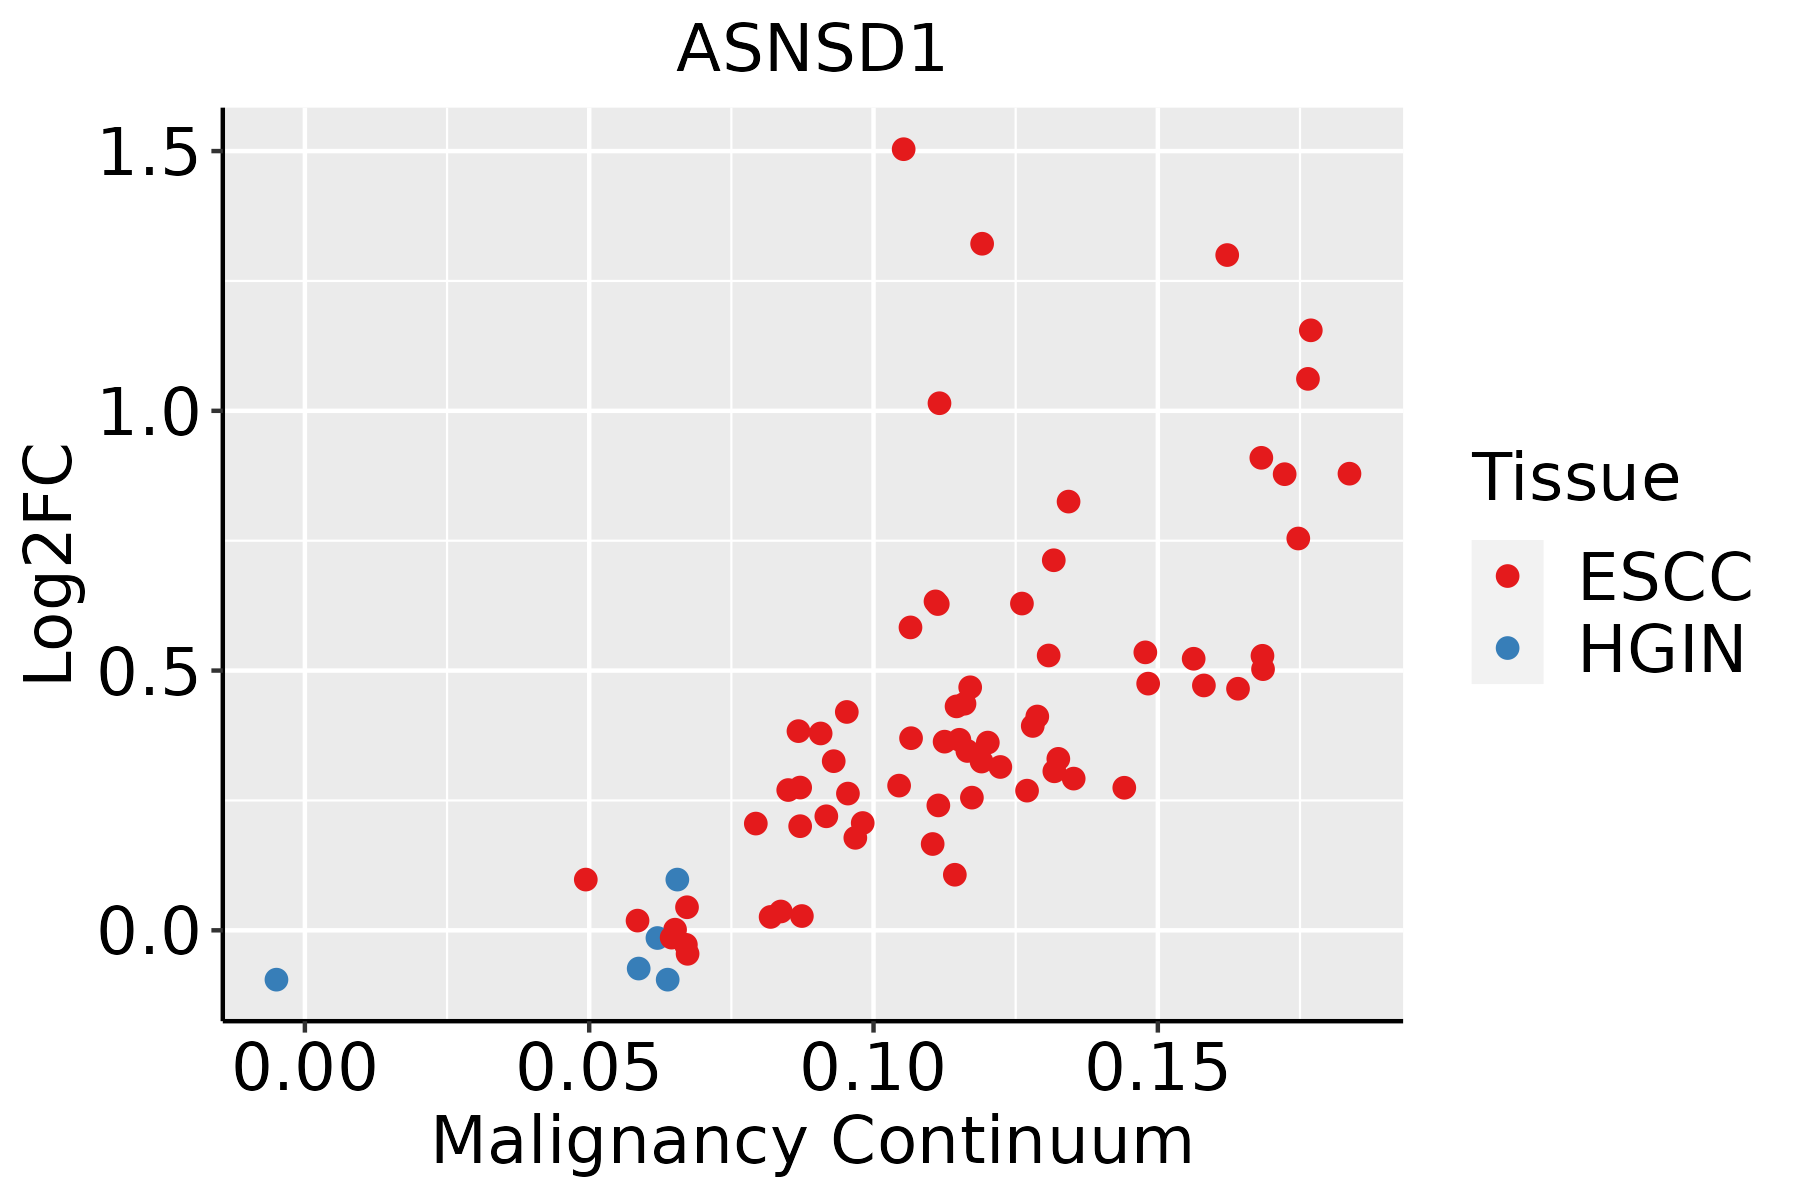
ESCC: Esophageal squamous cell carcinoma
HGIN: High-grade intraepithelial neoplasias
LGIN: Low-grade intraepithelial neoplasias
LiverThe image shows the transcriptomic changes along malignancy continuum.log2FC in expression of this searched gene in stem-like cells from each diseased tissue sample relative to stem-like cells in normal samples in each tissue plotted against the malignancy continuum. Samples are colored based on if they are from different disease stage.
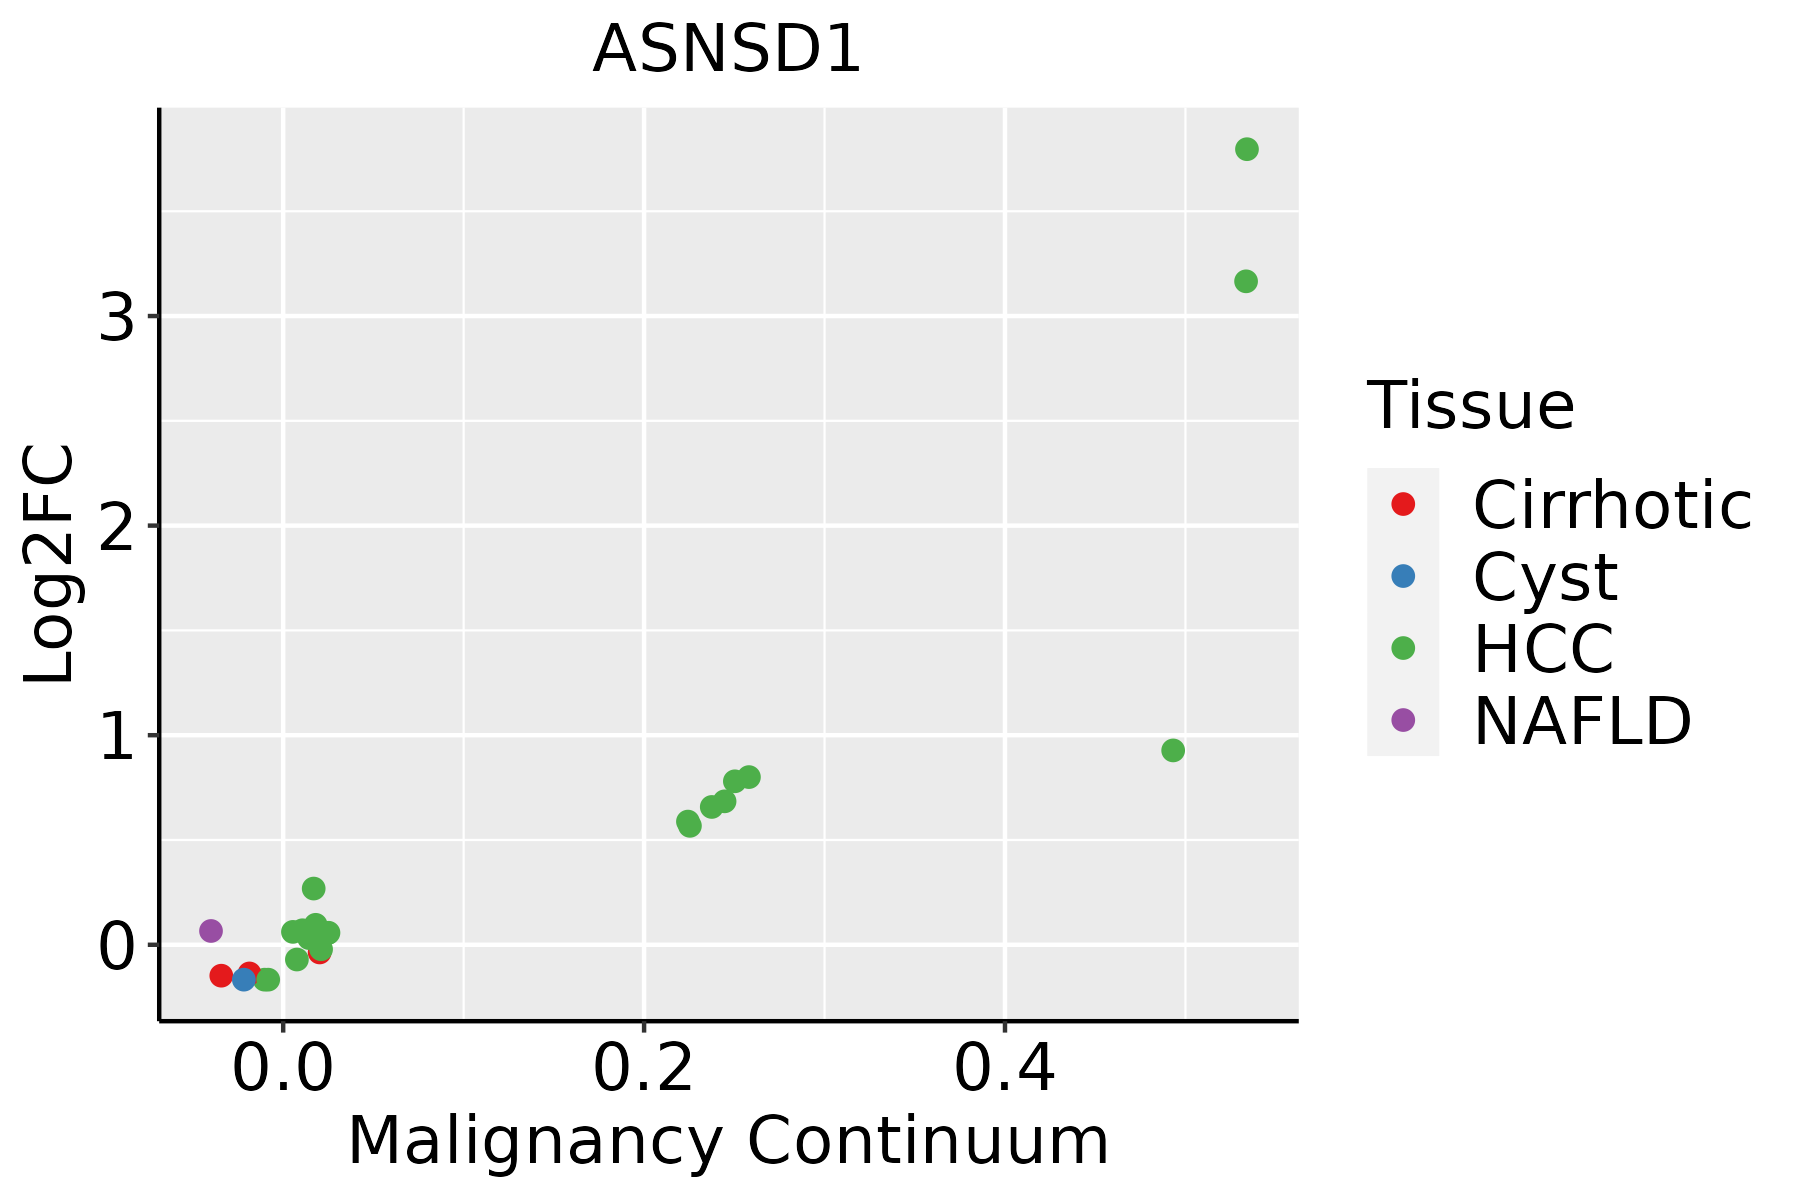
HCC: Hepatocellular carcinoma
NAFLD: Non-alcoholic fatty liver disease
Oral CavityThe image shows the transcriptomic changes along malignancy continuum.log2FC in expression of this searched gene in stem-like cells from each diseased tissue sample relative to stem-like cells in normal samples in each tissue plotted against the malignancy continuum. Samples are colored based on if they are from different disease stage.EOLP: Erosive Oral lichen planus
LP: leukoplakia
NEOLP: Non-erosive oral lichen planus
OSCC: Oral squamous cell carcinoma
SkinThe image shows the transcriptomic changes along malignancy continuum.log2FC in expression of this searched gene in stem-like cells from each diseased tissue sample relative to stem-like cells in normal samples in each tissue plotted against the malignancy continuum. Samples are colored based on if they are from different disease stage.AK: Actinic keratosis
cSCC: Cutaneous squamous cell carcinoma
SCCIS:squamous cell carcinoma in situ
ThyroidThe image shows the transcriptomic changes along malignancy continuum.log2FC in expression of this searched gene in stem-like cells from each diseased tissue sample relative to stem-like cells in normal samples in each tissue plotted against the malignancy continuum. Samples are colored based on if they are from different disease stage.ATC: Anaplastic thyroid cancer
HT: Hashimoto's thyroiditis
PTC: Papillary thyroid cancer
∗log2FC in expression of this searched gene in stem-like cells from each diseased tissue sample relative to stem-like cells in normal samples in each tissue plotted against the malignancy continuum. Samples are colored based on if they are from different disease stage.

Top

Malignant transformation related pathway analysis

check buttonFind out the enriched GO biological processes and KEGG pathways involved in transition from healthy to precancer to cancer
check button Figure of enriched GO biological processes.
TissueDisease StageEnriched GO biological Processes
ColorectumADGO analysis - Figure of enriched GO biological processes: Top 15 enriched GO BP terms are showed in the bar plot of each disease state in each tissue. Each row represents a significant GO biological process which is colored according to the -log10(p.adjust).
ColorectumSERGO analysis - Figure of enriched GO biological processes: Top 15 enriched GO BP terms are showed in the bar plot of each disease state in each tissue. Each row represents a significant GO biological process which is colored according to the -log10(p.adjust).
ColorectumMSSGO analysis - Figure of enriched GO biological processes: Top 15 enriched GO BP terms are showed in the bar plot of each disease state in each tissue. Each row represents a significant GO biological process which is colored according to the -log10(p.adjust).
ColorectumMSI-HGO analysis - Figure of enriched GO biological processes: Top 15 enriched GO BP terms are showed in the bar plot of each disease state in each tissue. Each row represents a significant GO biological process which is colored according to the -log10(p.adjust).
ColorectumFAPGO analysis - Figure of enriched GO biological processes: Top 15 enriched GO BP terms are showed in the bar plot of each disease state in each tissue. Each row represents a significant GO biological process which is colored according to the -log10(p.adjust).
∗Top 15 enriched GO BP terms are showed in the bar plot of each disease state in each tissue. Each row represents a significant GO biological process which is colored according to the -log10(p.adjust).
Page: 1 2 3 4 5 6 7 8 9 

check button Enriched GO biological processes.
GO IDTissueDisease StageDescriptionGene RatioBg Ratiopvaluep.adjustCount
GO:00086525EsophagusESCCcellular amino acid biosynthetic process51/855276/187231.30e-048.88e-0451
GO:00463948EsophagusESCCcarboxylic acid biosynthetic process175/8552314/187231.98e-041.26e-03175
GO:00160538EsophagusESCCorganic acid biosynthetic process175/8552316/187233.04e-041.82e-03175
GO:19016075EsophagusESCCalpha-amino acid biosynthetic process45/855268/187235.13e-042.84e-0345
GO:00090674EsophagusESCCaspartate family amino acid biosynthetic process17/855221/187231.03e-035.19e-0317
GO:001605321LiverHCCorganic acid biosynthetic process200/7958316/187235.24e-143.22e-12200
GO:004639421LiverHCCcarboxylic acid biosynthetic process198/7958314/187231.19e-136.78e-12198
GO:00086522LiverHCCcellular amino acid biosynthetic process58/795876/187231.98e-095.63e-0858
GO:19016052LiverHCCalpha-amino acid metabolic process124/7958195/187232.07e-095.79e-08124
GO:19016072LiverHCCalpha-amino acid biosynthetic process53/795868/187232.62e-097.16e-0853
GO:00065202LiverHCCcellular amino acid metabolic process167/7958284/187231.91e-084.56e-07167
GO:00090672LiverHCCaspartate family amino acid biosynthetic process19/795821/187236.44e-067.84e-0519
GO:00090662LiverHCCaspartate family amino acid metabolic process34/795849/187231.28e-041.06e-0334
GO:0009064LiverHCCglutamine family amino acid metabolic process47/795878/187231.17e-036.54e-0347
GO:00160537Oral cavityOSCCorganic acid biosynthetic process155/7305316/187231.64e-041.13e-03155
GO:00463947Oral cavityOSCCcarboxylic acid biosynthetic process154/7305314/187231.73e-041.19e-03154
GO:00086524Oral cavityOSCCcellular amino acid biosynthetic process42/730576/187232.93e-031.27e-0242
GO:19016074Oral cavityOSCCalpha-amino acid biosynthetic process37/730568/187237.09e-032.63e-0237
GO:190160711Oral cavityLPalpha-amino acid biosynthetic process28/462368/187232.01e-031.49e-0228
GO:000865211Oral cavityLPcellular amino acid biosynthetic process30/462376/187233.07e-032.09e-0230
Page: 1 2 

check button Enriched KEGG pathways.
Pathway IDTissueDisease StageDescriptionGene RatioBg Ratiopvaluep.adjustqvalueCount
Page: 1 

Top

Cell-cell communication analysis

check buttonIdentification of potential cell-cell interactions between two cell types and their ligand-receptor pairs for different disease states
LigandReceptorLRpairPathwayTissueDisease Stage
Page: 1 

Top

Single-cell gene regulatory network inference analysis

check buttonFind out the significant the regulons (TFs) and the target genes of each regulon across cell types for different disease states
TFCell TypeTissueDisease StageTarget GeneRSSRegulon Activity
∗The dot plots of a searched regulon are shown for all cell subpopulations in each disease state of each tissue based on the regulon specific score inferred using pySCENIC and by calculating the average expression.
Page: 1 

Top

Somatic mutation of malignant transformation related genes

check buttonAnnotation of somatic variants for genes involved in malignant transformation
Hugo SymbolVariant ClassVariant ClassificationdbSNP RSHGVScHGVSpHGVSp ShortSWISSPROTBIOTYPESIFTPolyPhenTumor Sample BarcodeTissueHistologySexAgeStageTherapy TypesDrugsOutcome
ASNSD1SNVMissense_Mutationc.1792C>Gp.Leu598Valp.L598VQ9NWL6protein_codingtolerated(0.89)benign(0.017)TCGA-A2-A04W-01Breastbreast invasive carcinomaFemale<65I/IIChemotherapycytoxanSD
ASNSD1SNVMissense_Mutationrs753403228c.1526N>Ap.Arg509Hisp.R509HQ9NWL6protein_codingtolerated(0.11)benign(0.036)TCGA-AN-A046-01Breastbreast invasive carcinomaFemale>=65I/IIUnknownUnknownSD
ASNSD1SNVMissense_Mutationnovelc.1826N>Tp.Arg609Ilep.R609IQ9NWL6protein_codingdeleterious(0)probably_damaging(0.94)TCGA-AN-A046-01Breastbreast invasive carcinomaFemale>=65I/IIUnknownUnknownSD
ASNSD1SNVMissense_Mutationc.52G>Cp.Asp18Hisp.D18HQ9NWL6protein_codingtolerated(0.12)benign(0.023)TCGA-AO-A1KR-01Breastbreast invasive carcinomaFemale<65I/IIChemotherapycyclophosphamideSD
ASNSD1SNVMissense_Mutationc.451N>Tp.Gly151Cysp.G151CQ9NWL6protein_codingdeleterious(0.02)possibly_damaging(0.52)TCGA-GM-A2DB-01Breastbreast invasive carcinomaFemale<65I/IIChemotherapytaxolCR
ASNSD1SNVMissense_Mutationrs777711639c.1520G>Ap.Arg507Hisp.R507HQ9NWL6protein_codingdeleterious(0)probably_damaging(0.987)TCGA-2W-A8YY-01Cervixcervical & endocervical cancerFemale<65I/IIChemotherapycisplatinCR
ASNSD1SNVMissense_Mutationc.109N>Gp.Gln37Glup.Q37EQ9NWL6protein_codingtolerated(0.12)benign(0.007)TCGA-DS-A1OC-01Cervixcervical & endocervical cancerFemale<65I/IIChemotherapygemcitabineSD
ASNSD1SNVMissense_Mutationc.168N>Tp.Leu56Phep.L56FQ9NWL6protein_codingtolerated(0.06)benign(0.066)TCGA-LP-A7HU-01Cervixcervical & endocervical cancerFemale<65I/IIUnknownUnknownSD
ASNSD1SNVMissense_Mutationrs781735004c.889N>Tp.Arg297Cysp.R297CQ9NWL6protein_codingdeleterious(0)probably_damaging(1)TCGA-MA-AA42-01Cervixcervical & endocervical cancerFemale>=65I/IIUnknownUnknownSD
ASNSD1SNVMissense_Mutationrs144391161c.1217G>Ap.Arg406Glnp.R406QQ9NWL6protein_codingdeleterious(0)probably_damaging(1)TCGA-AA-3510-01Colorectumcolon adenocarcinomaMale>=65I/IIUnknownUnknownSD
Page: 1 2 3 4 5 6 

Top

Related drugs of malignant transformation related genes

check buttonIdentification of chemicals and drugs interact with genes involved in malignant transfromation
(DGIdb 4.0)
Entrez IDSymbolCategoryInteraction TypesDrug Claim NameDrug NamePMIDs
Page: 1